 🏗️ New Construction
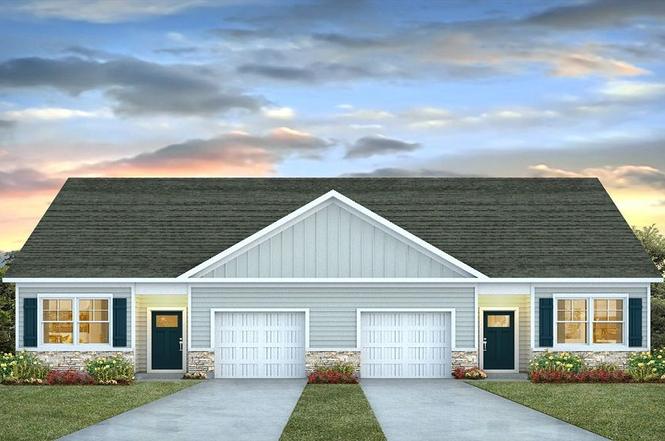
Belmont Plan · Carolina Shores, NC
Flood risk No data
- FEMA flood zone
- —
- Chance of flooding over 30 yrs
- —
- Est. flood insurance / yr
- —
Fire risk No data
- Est. fire insurance / yr
- —
Heat risk No data
- Hot days now (above threshold)
- —
- Hot days in 30 yrs
- —
Wind risk No data
- Chance of severe wind over 30 yrs
- —
Air-quality risk No data
- Unhealthy air days now
- —
- Unhealthy air days in 30 yrs
- —
Risk factors via First Street. Map © Google.
Why this score? — see what drove the D grade
The composite is a weighted blend of 9 inputs, each scored 0–100. Each bar is that input's sub-score; the figure is the points it added to the 100-point composite (weight × sub-score).
- Cash flow +10.1/30.0
- ARV discount +7.5/15.0
- Appreciation +6.3/10.0
- Schools +3.9/10.0
- Livability +3.2/5.0
- 1% rule +3.0/10.0
- DSCR +2.9/10.0
- Rent growth +2.5/5.0
- Condition / age +2.5/5.0
$247,490
🖨 Deal sheet 📄 Offer letter ✓ Due diligence
Listing remarks
Introducing the Belmont! This home features one level living at its finest with an open concept design. A large island in your kitchen opens to your living and dining. Your primary suite has a walk in closet, large bath with double vanities and walk in shower. The covered back porch adds a perfect finishing touch for your home. The Home Is Connected® Smart Home Package is included in your new home so you can control the thermostat, front door light and lock, plus video doorbell from your smartphone or with voice commands to Alexa! The photos you see here are for illustration purposes only, interior and exterior features, options, colors and selections will differ. Need specifics? Our he
Key facts
- Open concept design
- Large island
- Walk in closet
Tags
Property features AI
Finance
- Financial info: List price $247,490
Exterior
- Parking: 1 garage space (1 total parking space)
- Home design: Belmont plan; New construction
- Exterior features: Living area 1,167 (listed)
Interior
- Bedrooms: 3 bedrooms
- Bathrooms: 2 full bathrooms
- Interior features: Plan name: Belmont; Active new construction plan
Neighborhood map
What this means for you Summary
Snapshot
- This is a 3-bed/2.0-bath single-family listed at $247k.
Deal economics
- At list price, monthly cash flow is $-142 ($-2k/yr) — negative.
- To cash-flow at today's rent, offer at most $223k (9.8% below list).
- To meet the 1% rule (rent ≥ 1% of price), the offer needs to be $195k (21.1% below list).
- Recommended offer: $195k (21.1% below list) — sets the bar for 1% rule.
- Cap rate 5.6% vs local median 3.9% in Carolina Shores — top-decile yield for the area; either an underpriced asset or a hidden risk that comps aren't pricing in. Stress-test before assuming the spread holds.
Location & tenants
- Location reads 64/100 on livability (#352 in NC) — a middle-class / working-renter tenant base. Strengths: housing A+, crime A, cost of living B+; Watch: health & safety D, schools F, amenities F.
- Brunswick County Schools (rural): math 45% / reading 47% proficiency, ranked #82 of 178 in NC (top 46%) — families likely to look elsewhere, expect single-tenant / working-renter base with shorter leases.
- Market conditions: 150 active listings in the ZIP; 6,112 units permitted in Brunswick County in 2024 (990 in 5+ unit buildings).
Forward outlook
- In year one you build about $8k of equity ($2k loan paydown + $6k appreciation (2.6% local appreciation)).
- Brunswick County population projected at +36% by 2050 — long-run rental-demand tailwind backs the buy-and-hold thesis.
- By year 5, paydown + projected appreciation supports a ~$35k cash-out refi (75% LTV) — recoverable capital for the next deal without selling this one.
Negotiation context
- It's been on market 154 days — a 12% lower offer ($218k) is reasonable based on typical stale-listing flexibility.
Questions for the listing agent
- What do current leases actually rent for vs. the listed asking? Can we see a recent rent roll and the last 12 months of T-12 income?
- It's been on market 154 days. Have you received any prior offers? Is the seller open to a 21% concession, seller financing, or rate buy-down credit?
- Why hasn't it sold? Are there any deal-killer items the seller is aware of (foundation, flood, title, zoning, code violations)?
- Is there a deadline driving the sale (1031 exchange, divorce, estate, relocation)? That informs how much negotiation room exists.
- Schools are F-rated, which usually means shorter tenancies and higher turnover. Who's the typical renter profile here, and what's been the actual vacancy rate?
- The area grade is low — what's the realistic commute time and amenity access for the typical tenant pool here? Any planned neighborhood developments (good or bad) we should know about?
- What's the average days-on-market for RENTAL listings here right now (not sales)? A rising rental-DOM trend means longer vacancies and softer asking-rent achievability than the comps imply.
- What's the recent tenant-quality profile in this submarket — average credit score on applications, eviction rate, late-payment / NSF rate, and stable-employment percentage? A property-management company in the area should have these aggregated.
- How much new for-sale + rental construction is in the pipeline within 1–3 miles? Heavy new supply typically softens prices + rents 12–24 months out; constrained supply supports both.
Investment metrics
- 1% rule
- 0.80% ✗
- Cap rate
- 5.59%
- Cash-on-cash
- -2.50%
- DSCR
- 0.89
- GRM
- 10.4
CMA / ARV
- ARV (on-the-fly)
- $243,903
- Comps found
- 3
Show comp detail 3 sales within ~0.75 mi
| Address | Dist | Beds/Ba | Sqft | Sold | Price | $/sf | Match |
|---|---|---|---|---|---|---|---|
| 3596 Whaley Way NW | 0.10mi | 3/2.0 | 1,167 (0%) | 1mo | $244,190 | $209 | 94 |
| 3616 Whaley Way NW | 0.10mi | 2/2.0 (-1) | 1,167 (0%) | 1mo | $250,000 | $214 | 89 |
| 3630 Whaley Way NW | 0.11mi | 3/2.0 | 1,167 (0%) | 12mo | $240,000 | $206 | 85 |
Match score weights: distance 35% · size 25% · config 20% · recency 20%. Top-matched comps best support the ARV.
Projected returns pro-forma
2.65% appreciation · 3.0% rent growth · sell at horizon
- IRR
- 4.1%
- Equity multiple
- 1.23×
- Total profit
- $15,848
- Equity at exit
- $104,882
- IRR
- 7.5%
- Equity multiple
- 2.10×
- Total profit
- $74,872
- Equity at exit
- $158,007
Cash invested: $68,293 (down + closing). Projections, not guarantees.
Landlord ↔ Tenant lean methodology
- Overall (STATE)
- 85 Strongly Landlord-Friendly
- State North Carolina
- 85 Strongly Landlord-Friendly · R+3
- County
- — inherits STATE
- City
- — inherits STATE
ZIP-level market 28420
- Home prices YoY
- 1.7%
- Active inventory
- 150
- Price-to-rent
- 10.6×
Monthly cashflow live
- Estimated rent
- $1,954 medium interval (Pro) →
- Mortgage (P&I)
- −$1,279
- Tax est. 1.5%
- −$305 /mo · $3,659/yr
- Insurance
- −$102
- HOA
- −$0
- Vacancy / Maint / Mgmt
- −$410
- Net cashflow
- $-142
Break-even live
UW: 25.0% down · 7.5% · 30yr · 1.5% tax · 5.0% vac · 8.0% maint · 8.0% mgmt
Financing live
Cash to close
- Down payment
- $60,976
- Closing costs
- $7,317
- Reserves months
- —
- Total cash needed
- —
Loan-product check · same deal, 3 products live
Conventional
25% down · 7.5% · 30yr
- Down + closing
- —
- Monthly P&I
- —
- Monthly cashflow
- —
- DSCR
- —
- Eligible?
- —
Personal DTI + credit; lowest rate.
DSCR
20% down · 8.5% · 30yr
- Down + closing
- —
- Monthly P&I
- —
- Monthly cashflow
- —
- DSCR
- —
- Eligible?
- —
No personal income docs; deal must DSCR.
Hard money
10% down · 12.0% · 12mo
- Down + closing
- —
- Monthly P&I
- —
- Monthly cashflow
- —
- DSCR
- —
- Eligible?
- —
Short-term bridge; refi at stabilization.
Listing history 15 events
-
2026-06-18days on market $247,490 Active 154 DOM
-
2026-06-17days on market $247,490 Active 153 DOM
-
2026-06-16days on market $247,490 Active 152 DOM
-
2026-06-15days on market $247,490 Active 151 DOM
-
2026-06-14days on market $247,490 Active 149 DOM
-
2026-06-13days on market $247,490 Active 148 DOM
-
2026-06-10days on market $247,490 Active 146 DOM
-
2026-06-09days on market $247,490 Active 145 DOM
-
2026-06-08days on market $247,490 Active 144 DOM
-
2026-06-07days on market $247,490 Active 143 DOM
-
2026-06-05days on market $247,490 Active 140 DOM
-
2026-06-02days on market $247,490 Active 138 DOM
-
2026-06-01days on market $247,490 Active 137 DOM
-
2026-05-31days on market $247,490 Active 136 DOM
-
2026-05-30days on market $247,490 Active 135 DOM
ⓘ Source: listings_history table (triggers on properties + properties_extension) + one-shot
backfill from property_details.listing_events for pre-trigger history.
Nearby sold comps map
Loading sold comps map…
Walkable amenities ~0.75 mi
Loading nearby amenities…
Taxation est. · year 1
- Rental income
- $23,442
- − Mortgage interest
- −$13,662
- − Property taxes
- −$3,659
- − Insurance
- −$1,220
- − Repairs & maintenance
- −$1,875
- − Management
- −$1,875
- − Depreciation
- −$7,095
- Taxable loss
- −$5,945
- Est. tax savings @ 24.0%
- +$1,427
- After-tax cash flow
- $-281/yr
For passive investors: Depreciation is non-cash, so a rental often shows a tax loss while cash-flowing — sheltering income. Rental losses are passive: they offset passive income freely, and up to $25,000/yr can offset ordinary (W-2) income if you actively participate and your MAGI is under $100k (phasing out to $0 by $150k); unused losses carry forward. On sale, claimed depreciation is recaptured at up to 25%, and gains may owe capital-gains tax (a 1031 exchange can defer both). Figures are a year-1 estimate at your 24.0% rate — not tax advice; consult a CPA.
Schools (NCES district)
- District
- Brunswick County Schools
- NCES district ID
- 3700420
- Math proficiency
- 45% ▲ 4.00%
- Reading proficiency
- 47% ▲ 4.00%
- Median HH income
- $47,494
- Composite
- 39.23/100
- National rank
- #4011
- State rank
- #82 of 178 in NC
Livability — Carolina Shores
- Score
- 64/100
- State rank
- #352
- US rank
- #13907
Category grades
Schools grade is shown separately in the Schools card above.
Census & demographics
- City population
- 13,313
- Population (ZIP)
- 2,697
Population outlook (Brunswick County) Hauer SSP2
- Today (2025)
- 152,111 people
- By 2030
- 165,705 · +8.9%
- By 2040
- 188,494 · +23.9%
- By 2050
- 206,228 · +35.6%
- By 2075
- 237,876 · +56.4%
- By 2100
- 251,451 · +65.3%
Race, ethnicity, and origin ACS 2023
- Neighborhood character
- Predominantly White (81%)
- Race & ethnicity
- White 81% Black 10% Native American 3% Hispanic / Latino 3% Asian 2% Two or more races 1%
- Common ancestry
- Serbian 4% Slovak 1% Russian 1%
- Foreign-born
- 5%
- Languages at home
- 97% English-only · Arabic 2% Other Indo-European 1%
Political lean MEDSL · Brunswick
- 2024 margin
- Strong R (+24.9) · D 37.2% · R 62.0%
- 2008→2024 swing
- -6.9pp toward R · 2008: -17.9pp · 2024: -24.9pp
- All cycles
- 2024: R+24.9 2020: R+25.0 2016: R+28.7 2012: R+22.2 2008: R+17.9
Not yet ingested
- Civics
- —
Market trends
- HPI YoY
- ▲ 2.65%
- Current HPI
- 154.7713
- Rent YoY
- —
- Metro
- —
- State GDP YoY
- ▲ 3.28%
- F500 in state
- 26
Industry mix (Fortune 500 HQ in NC)
| Industry | F500 HQs | Revenue |
|---|---|---|
| Financial Services | 2 | $213B |
|
||
| Retail | 2 | $95B |
|
||
| Industrial Conglomerate | 1 | $38B |
|
||
| Metals / Steel | 1 | $35B |
|
||
| Utilities | 1 | $30B |
|
||
| Industrial Machinery | 1 | $19B |
|
||
Cash-flow waterfall
monthlySold comps — $/sqft
last 12 mo · ≤1 miLoading sold comps…