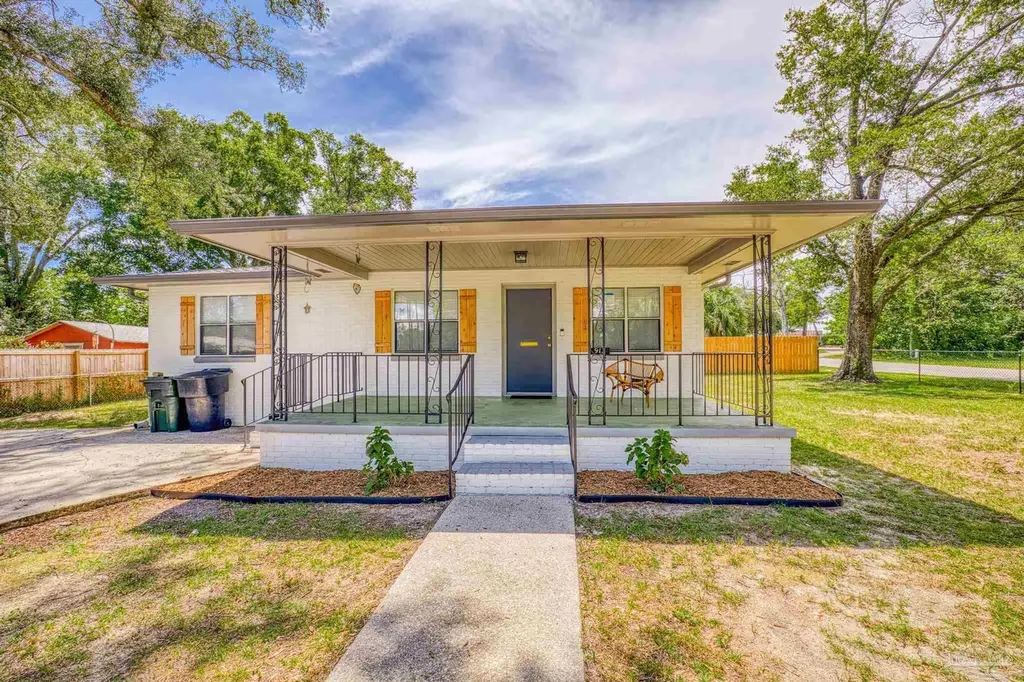
913 W Hernandez St · Pensacola, FL
Flood risk 3/10 · Minor
- FEMA flood zone
- X (unshaded)
- Chance of flooding over 30 yrs
- 0.1%
- Est. flood insurance / yr
- $507 – $1,088
Fire risk 1/10 · Minimal
- Est. fire insurance / yr
- $947 – $1,759
Heat risk 10/10 · Severe
- Hot days now (above 105°F)
- 7 days/yr
- Hot days in 30 yrs
- 21 days/yr
Wind risk 9/10 · Severe
- Chance of severe wind over 30 yrs
- 99.0%
Air-quality risk 2/10 · Minimal
- Unhealthy air days now
- 0 days/yr
- Unhealthy air days in 30 yrs
- 1 days/yr
Risk factors via First Street. Map © Google.
Why this score? — see what drove the D+ grade
The composite is a weighted blend of 9 inputs, each scored 0–100. Each bar is that input's sub-score; the figure is the points it added to the 100-point composite (weight × sub-score).
- Cash flow +13.6/30.0
- ARV discount +10.3/15.0
- Livability +4.2/5.0
- DSCR +4.1/10.0
- Rent growth +3.9/5.0
- Schools +3.6/10.0
- 1% rule +3.2/10.0
- Condition / age +2.5/5.0
- Appreciation +0.0/10.0
$259,999
🖨 Deal sheet (PDF) 📄 Offer letter ✓ Due diligence
Listing remarks
Freshly renovated and move-in ready, this beautifully updated 4-bedroom, 2-bathroom home is located just minutes from Downtown Pensacola. The flexible fourth bedroom offers the perfect space for a home office, gym, or guest room to fit your lifestyle needs. Inside, light neutral tones, new windows, baseboards, and sleek fixtures create a bright and welcoming atmosphere throughout. Major system upgrades include a new HVAC system, hot water heater, and updated appliances, providing modern comfort and peace of mind. The split floor plan offers added privacy for bedrooms, while the open-concept kitchen, dining, and living areas create a seamless flow ideal for everyday living and entertaining.
Key facts
- 0.3 acre lot
- Built 1962
- Listed 10 days
Property features AI
Finance
- HOA & community: No association
Exterior
- Parking: Driveway parking; Guest parking / open parking
- Security: Smoke detectors
- Utilities: Public water; Public sewer; Copper wiring; Cable available; Publicly maintained road
- Home design: Single-story detached home; Brick construction; Hip shingle roof; Off-grade foundation
- Construction: Brick exterior
- Exterior features: Rain gutters; Patio and porch; Corner lot
Interior
- Kitchen: Recently remodeled kitchen (within the last year) with new countertops, backsplash, flooring and appliances; Dishwasher; Refrigerator; Electric water heater
- Bedrooms: Primary bedroom on the first floor, approximately 12' x 12'
- Flooring: Tile; Laminate
- Bathrooms: Two full bathrooms; Recently updated — full remodel within the last year (new flooring, tile, vanity, fixtures)
- Heating & cooling: Central heat (heat pump and central system); Central air conditioning; Ceiling fans
- Interior features: Baseboards; Recessed lighting; Bonus room; Game room; Blinds and shutters on windows
- Laundry & utility: Washer/dryer hookups
Neighborhood map
What this means for you Summary
Snapshot
- This is a 4-bed/1.0-bath single-family listed at $260k.
Deal economics
- At list price, monthly cash flow is $13 ($151/yr) — positive.
- The deal already cash-flows at list — no discount required.
- To meet the 1% rule (rent ≥ 1% of price), the offer needs to be $214k (17.6% below list).
- Recommended offer: $214k (17.6% below list) — sets the bar for 1% rule.
- Cap rate 6.4% vs local median 3.6% in Pensacola — top-decile yield for the area; either an underpriced asset or a hidden risk that comps aren't pricing in. Stress-test before assuming the spread holds.
Location & tenants
- Location reads 83/100 on livability (#53 in FL, #924 nationally) — a professional / high-income tenant draw. Strengths: commute A+, cost of living A+, housing A+.
- Escambia (suburban): math 40% / reading 45% proficiency, ranked #56 of 73 in FL (top 77%) — families likely to look elsewhere, expect single-tenant / working-renter base with shorter leases.
- Zoned schools: C. A. Weis Elementary School (math 20% / reading 27%, grade F, #2,061 of 2,144 statewide, top 96%, 466 students, 93% FRL); Pensacola High School (math 29% / reading 50%, grade F, #304 of 667 statewide, top 47%, 1,229 students, 55% FRL) — zoned schools average 74% FRL vs 58% district-wide (16 pts higher); higher-poverty schools than district average — tighter screening recommended.
- Market conditions: Rents rising fast (+5.4%/yr); 130 active listings in the ZIP; 22 comparable units currently listed for rent nearby; rentals at typical pace (median 25d on market — plan ~3-4 weeks tenant-placement turnaround); lower-income renter base — watch delinquency; 1,479 units permitted in Escambia County in 2024 (0 in 5+ unit buildings).
- At $2,143/mo this rent would consume 58% of the median local household income ($44k/yr) (locally 816% of renters already pay >50% of income on rent) — very limited rent-growth headroom before tenants either downsize or default.
Forward outlook
- Local home prices are declining (-3.0%/yr); year-one equity from $2k of loan paydown is wiped out by about $8k of value loss. Plan a longer hold.
- Escambia County population projected at +13% by 2050 — modest demand growth; plan on rents tracking national, not racing it.
Negotiation context
- Only 10 days on market — expect competitive offers; lowballing is unlikely to land.
- 5 sale attempts since 4y ago with the ask held roughly flat each time — persistent listings suggest the price (not the market) is what's stuck; bring a comps-based counter.
- Current owner paid $132k; list at $260k implies a 96% gain — meaningful room to come down on a strong offer.
Risks & watch-outs
- Climate carrying-cost: severe wind risk, 99% chance of damaging wind over 30y; extreme-heat days projected 7→21/yr by 2055 (HVAC capex compounding) — expect insurance premiums to compound above CPI over the hold.
Questions for the listing agent
- Built in 1962 — when were the roof, HVAC, electrical panel, plumbing, and water heater last replaced?
- Is there a deadline driving the sale (1031 exchange, divorce, estate, relocation)? That informs how much negotiation room exists.
- The area grade is low — what's the realistic commute time and amenity access for the typical tenant pool here? Any planned neighborhood developments (good or bad) we should know about?
- What's the average days-on-market for RENTAL listings here right now (not sales)? A rising rental-DOM trend means longer vacancies and softer asking-rent achievability than the comps imply.
- What's the recent tenant-quality profile in this submarket — average credit score on applications, eviction rate, late-payment / NSF rate, and stable-employment percentage? A property-management company in the area should have these aggregated.
- How much new for-sale + rental construction is in the pipeline within 1–3 miles? Heavy new supply typically softens prices + rents 12–24 months out; constrained supply supports both.
Investment metrics
- 1% rule
- 0.82% ✗
- Cap rate
- 6.35%
- Cash-on-cash
- 0.21%
- DSCR
- 1.01
- GRM
- 10.1
CMA / ARV
- ARV (on-the-fly)
- $277,056
- Comps found
- 12
Show comp detail 12 sales within ~0.75 mi
| Address | Dist | Beds/Ba | Sqft | Sold | Price | $/sf | Match |
|---|---|---|---|---|---|---|---|
| 631 W Jordan St | 0.22mi | 3/2.0 (-1) | 1,408 (-2%) | 2mo | $170,500 | $121 | 75 |
| 1906 N Spring St | 0.47mi | 3/2.0 (-1) | 1,400 (-3%) | 5mo | $465,000 | $332 | 60 |
| 2607 N H St | 0.46mi | 3/2.0 (-1) | 1,356 (-6%) | 1mo | $255,000 | $188 | 59 |
| 120 W Lakeview Ave | 0.48mi | 3/1.0 (-1) | 1,330 (-8%) | 4mo | $290,000 | $218 | 56 |
| 412 W Brainerd St | 0.67mi | 3/1.0 (-1) | 1,519 (+5%) | 3mo | $315,000 | $207 | 52 |
| 110 E Bobe St | 0.74mi | 3/2.0 (-1) | 1,488 (+3%) | 1mo | $278,000 | $187 | 51 |
| 112 E Bobe St | 0.75mi | 3/2.0 (-1) | 1,488 (+3%) | 1mo | $280,000 | $188 | 50 |
| 1491 N E St | 0.35mi | 3/2.0 (-1) | 1,634 (+13%) | 2mo | $190,000 | $116 | 50 |
| 1502 N Baylen St | 0.68mi | 3/2.0 (-1) | 1,514 (+5%) | 3mo | $405,000 | $268 | 49 |
| 1105 W Gonzales St | 0.65mi | 4/2.0 | 1,294 (-10%) | 1mo | $180,000 | $139 | 48 |
| 1503 N K St | 0.47mi | 3/2.5 (-1) | 1,596 (+11%) | 4mo | $335,000 | $210 | 46 |
| 2419 N L St | 0.55mi | 3/2.0 (-1) | 1,285 (-11%) | 2mo | $247,000 | $192 | 45 |
Match score weights: distance 35% · size 25% · config 20% · recency 20%. Top-matched comps best support the ARV.
Projected returns pro-forma
-3.0% appreciation · 5.4% rent growth · sell at horizon
- IRR
- -13.5%
- Equity multiple
- 0.50×
- Total profit
- $-36,071
- Equity at exit
- $38,767
- IRR
- -1.4%
- Equity multiple
- 0.89×
- Total profit
- $-7,696
- Equity at exit
- $22,480
Cash invested: $72,800 (down + closing). Projections, not guarantees.
Landlord ↔ Tenant lean methodology
- Overall (STATE)
- 87 Strongly Landlord-Friendly
- State Florida
- 87 Strongly Landlord-Friendly · R+3
- County
- — inherits STATE
- City
- — inherits STATE
ZIP-level market 32501
- Rents YoY
- 5.4%
- Active inventory
- 130
- Price-to-rent
- 10.1×
Monthly cashflow live
- Estimated rent
- $2,143 high interval (Pro) →
- Mortgage (P&I)
- −$1,363
- Tax from tax record
- −$209 /mo · $2,506/yr
- Insurance
- −$108
- HOA
- −$0
- Vacancy / Maint / Mgmt
- −$450
- Net cashflow
- $13
Break-even live
Sensitivity live
| Price | -10% $160 | -5% $86 | +0% $13 | +5% $-61 | +10% $-135 |
|---|---|---|---|---|---|
| Rent | -10% $-157 | -5% $-72 | +0% $13 | +5% $97 | +10% $182 |
| Rate | -1.0pp $143 | -0.5pp $79 | base $13 | +0.5pp $-55 | +1.0pp $-123 |
UW: 25.0% down · 7.5% · 30yr · 1.5% tax · 5.0% vac · 8.0% maint · 8.0% mgmt
Financing live
Cash to close
- Down payment
- $65,000
- Closing costs
- $7,800
- Reserves months
- —
- Total cash needed
- —
Loan-product check · same deal, 3 products live
Conventional
25% down · 7.5% · 30yr
- Down + closing
- —
- Monthly P&I
- —
- Monthly cashflow
- —
- DSCR
- —
- Eligible?
- —
Personal DTI + credit; lowest rate.
DSCR
20% down · 8.5% · 30yr
- Down + closing
- —
- Monthly P&I
- —
- Monthly cashflow
- —
- DSCR
- —
- Eligible?
- —
No personal income docs; deal must DSCR.
Hard money
10% down · 12.0% · 12mo
- Down + closing
- —
- Monthly P&I
- —
- Monthly cashflow
- —
- DSCR
- —
- Eligible?
- —
Short-term bridge; refi at stabilization.
Rent comps 22 comps
| Address | Beds | Baths | Sqft | Rent | $/sqft | DOM | Units | Dist |
|---|---|---|---|---|---|---|---|---|
| 721 W Jordan St Pensacola, FL | 3.0 | 2.0 | 1030 | $1,895 | $1.84 | 25d | 1 | 0.18mi |
| 407 W Jordan St Unit NA Pensacola, FL | 3.0 | 2.0 | 1300 | $2,200 | $1.69 | 25d | 1 | 0.29mi |
| 1215 N C St Pensacola, FL | 3.0 | 1.0 | 1203 | $1,775 | $1.48 | 15d | 1 | 0.52mi |
| 2108 W Bobe St Pensacola, FL | 4.0 | 2.0 | 1752 | $2,100 | $1.20 | 25d | 1 | 0.74mi |
| 814 N E St Pensacola, FL | 3.0 | 2.0 | 1440 | $1,695 | $1.18 | 25d | 1 | 0.77mi |
| 615 N A St Pensacola, FL | 3.0 | 2.0 | 1122 | $1,900 | $1.69 | 15d | 1 | 0.95mi |
| 418 N C St Pensacola, FL | 3.0 | 2.0 | 1017 | $2,775 | $2.73 | 15d | 1 | 1.05mi |
| 411 N D St Pensacola, FL | 4.0 | 2.0 | 1511 | $2,175 | $1.44 | 25d | 1 | 1.06mi |
| 410 N C St Unit 1367374P Pensacola, FL | 3.0 | 2.0 | 1291 | $3,313 | $2.57 | 15d | 1 | 1.07mi |
| 504 N Spring St Unit B Pensacola, FL | 3.0 | 1.5 | 1485 | $1,995 | $1.34 | 25d | 1 | 1.15mi |
| 1804 W Belmont St Unit A Pensacola, FL | 3.0 | 1.0 | 925 | $995 | $1.08 | 23d | 1 | 1.16mi |
| 2008 N 8th Ave Pensacola, FL | 3.0 | 2.0 | 1058 | $1,250 | $1.18 | 15d | 1 | 1.19mi |
| 239 N K St Pensacola, FL | 3.0 | 2.0 | 1392 | $1,950 | $1.40 | 25d | 1 | 1.25mi |
| 2802 W Gonzalez St Pensacola, FL | 3.0 | 2.0 | 1824 | $1,600 | $0.88 | 25d | 1 | 1.27mi |
| 309 N Pace Blvd Unit B Pensacola, FL | 3.0 | 2.0 | 1342 | $1,650 | $1.23 | 25d | 1 | 1.30mi |
| 315 N Pace Blvd Unit A Pensacola, FL | 3.0 | 2.0 | 1342 | $1,850 | $1.38 | 25d | 1 | 1.31mi |
| 315 N Pace Blvd Unit b Pensacola, FL | 3.0 | 2.0 | 1342 | $1,650 | $1.23 | 25d | 1 | 1.31mi |
| 801 E Gonzalez St Pensacola, FL | 3.0 | 2.0 | 1200 | $2,200 | $1.83 | 15d | 1 | 1.35mi |
| 3131 N 10th Ave Pensacola, FL | 3.0 | 1.5 | 1085 | $1,700 | $1.57 | 25d | 1 | 1.46mi |
| 1121 E Maxwell St Pensacola, FL | 3.0 | 2.5 | 1716 | $3,550 | $2.07 | 25d | 1 | 1.48mi |
| 511 E La Rua St Pensacola, FL | 3.0 | 1.0 | 1128 | $1,475 | $1.31 | 15d | 1 | 1.49mi |
| 106 S G St Pensacola, FL | 3.0 | 2.0 | 1300 | $2,200 | $1.69 | 25d | 1 | 1.49mi |
Listing history 25 events
-
2026-06-21days on market $259,999 Active 10 DOM
-
2026-06-18days on market $259,999 Active 7 DOM
-
2026-06-17days on market $259,999 Active 6 DOM
-
2026-06-16days on market $259,999 Active 5 DOM
-
2026-06-15days on market $259,999 Active 4 DOM
-
2026-06-14pricestatusdays on market $259,999 Active 2 DOM
-
2026-06-10days on market $270,000 Coming Soon 19 DOM
-
2026-06-09days on market $270,000 Coming Soon 18 DOM
-
2026-06-08days on market $270,000 Coming Soon 17 DOM
-
2026-06-07days on market $270,000 Coming Soon 16 DOM
-
2026-06-03days on market $270,000 Coming Soon 12 DOM
-
2026-06-02days on market $270,000 Coming Soon 11 DOM
-
2026-06-01days on market $270,000 Coming Soon 10 DOM
-
2026-05-31days on market $270,000 Coming Soon 9 DOM
-
2026-05-31days on market $270,000 Coming Soon 8 DOM
-
2026-05-22historical $270,000
-
2026-03-12$1,995
-
2025-10-30historical
-
2025-08-25$280,000 Active
-
2024-09-18historical
-
2024-08-30$295,000 Active
-
2022-08-17soldstatus $132,500 Sold
-
2022-08-17soldstatus $132,500
-
2022-08-07status Pending
-
2022-08-03$143,000 Active
ⓘ Source: listings_history table (triggers on properties + properties_extension) + one-shot
backfill from property_details.listing_events for pre-trigger history.
Tax reassessment forecast FL · Resets to sale price
- Current annual tax
- $2,506 · $209/mo
- Projected year-2 tax
- $2,506 · $209/mo
- Expected delta
- $0/yr ($0/mo · 0.0%)
ⓘ Screening estimate from a state-policy table — verify with the county assessor before closing.
Climate risk First Street
- Flood 3/10 Moderate FEMA zone X (unshaded) · 10% chance over 30 yrs
- Wildfire 1/10 Low
- Heat 10/10 Extreme 7 d/yr ≥105°F today · 21 d/yr by 30 yrs out
- Wind 9/10 Extreme 99% chance of damaging wind over 30 yrs
- Air quality 2/10 Low 0 unhealthy d/yr today · 1 by 30 yrs out
Nearby sold comps map
Loading sold comps map…
Walkable amenities ~0.75 mi
Loading nearby amenities…
Taxation est. · year 1
- Rental income
- $25,720
- − Mortgage interest
- −$14,564
- − Property taxes
- −$2,506
- − Insurance
- −$1,300
- − Repairs & maintenance
- −$2,058
- − Management
- −$2,058
- − Depreciation
- −$7,564
- Taxable loss
- −$4,329
- Est. tax savings @ 24.0%
- +$1,039
- After-tax cash flow
- $1,190/yr
For passive investors: Depreciation is non-cash, so a rental often shows a tax loss while cash-flowing — sheltering income. Rental losses are passive: they offset passive income freely, and up to $25,000/yr can offset ordinary (W-2) income if you actively participate and your MAGI is under $100k (phasing out to $0 by $150k); unused losses carry forward. On sale, claimed depreciation is recaptured at up to 25%, and gains may owe capital-gains tax (a 1031 exchange can defer both). Figures are a year-1 estimate at your 24.0% rate — not tax advice; consult a CPA.
Schools (NCES district)
- District
- Escambia
- NCES district ID
- 1200510
- Math proficiency
- 40% ▼ -9.00%
- Reading proficiency
- 45% ▼ -4.00%
- Median HH income
- $44,649
- Composite
- 36.04/100
- National rank
- #4773
- State rank
- #56 of 73 in FL
Livability — Pensacola
- Score
- 83/100
- State rank
- #53
- US rank
- #924
Category grades
Schools grade is shown separately in the Schools card above.
Census & demographics
- Census place
- Pensacola, FL
- County
- Escambia County · 301,722 people
- City population
- 237,636
- Metro
- Pensacola-Ferry Pass-Brent, FL
- Population (ZIP)
- 11,036
- Household income
- $44,139
- Rent vs Own
- Severe rent burden
- 816.0
Population outlook (Escambia County) Hauer SSP2
- Today (2025)
- 334,637 people
- By 2030
- 345,779 · +3.3%
- By 2040
- 364,828 · +9.0%
- By 2050
- 378,514 · +13.1%
- By 2075
- 403,220 · +20.5%
- By 2100
- 386,125 · +15.4%
Race, ethnicity, and origin ACS 2023
- Neighborhood character
- Diverse neighborhood (Simpson 0.62)
- Race & ethnicity
- Black 45% White 42% Two or more races 8% Hispanic / Latino 5%
- Common ancestry
- Subsaharan African 2% Italian 2% Slovak 2%
- Foreign-born
- 2% · Canada, Vietnam
- Languages at home
- 97% English-only · Spanish 2%
Political lean MEDSL · Escambia
- 2024 margin
- R (+19.5) · D 39.7% · R 59.2% · Other 1.1%
- 2008→2024 swing
- -0.2pp no change · 2008: -19.3pp · 2024: -19.5pp
- All cycles
- 2024: R+19.5 2020: R+15.1 2016: R+20.6 2012: R+20.6 2008: R+19.3
Not yet ingested
- Civics
- —
Market trends
- HPI YoY
- ▼ -210.53%
- Current HPI
- 273.0151
- Rent YoY
- ▲ 5.40%
- Metro
- Pensacola-Ferry Pass-Brent, FL
- State GDP YoY
- ▲ 3.28%
- F500 in state
- 36
Industry mix (Fortune 500 HQ in FL)
| Industry | F500 HQs | Revenue |
|---|---|---|
| Industrial Technology | 2 | $29B |
|
||
| Insurance | 2 | $17B |
|
||
| Retail | 1 | $60B |
|
||
| Technology Distribution | 1 | $58B |
|
||
| Homebuilding | 1 | $35B |
|
||
| Technology Manufacturing | 1 | $35B |
|
||
Price history
-98.7% since first listed13 events — show timeline
- 2026-06-19 Price Changed $1,895 TENANTTURNER2
- 2026-06-11 Listed $259,999 PARMLS
- 2026-06-10 Price Changed $259,999 PARMLS
- 2026-05-22 Coming Soon $270,000 PARMLS
- 2026-03-12 Listed for Rent $1,995 TENANTTURNER2
- 2025-10-30 Listing Removed — PARMLS
- 2025-08-25 Listed $280,000 PARMLS
- 2024-09-18 Listing Removed — PARMLS
- 2024-08-30 Listed $295,000 PARMLS
- 2022-08-17 Sold (Public Records) $132,500 Public Records
- 2022-08-17 Sold (MLS) $132,500 PARMLS
- 2022-08-07 Pending — PARMLS
- 2022-08-03 Listed $143,000 PARMLS
Property tax history
+6.8%/yrLatest (2025): $2,506 · +4.9% YoY. Source: county tax records.
Cash-flow waterfall
monthlySold comps — $/sqft
last 12 mo · ≤1 miLoading sold comps…