 Fourplex
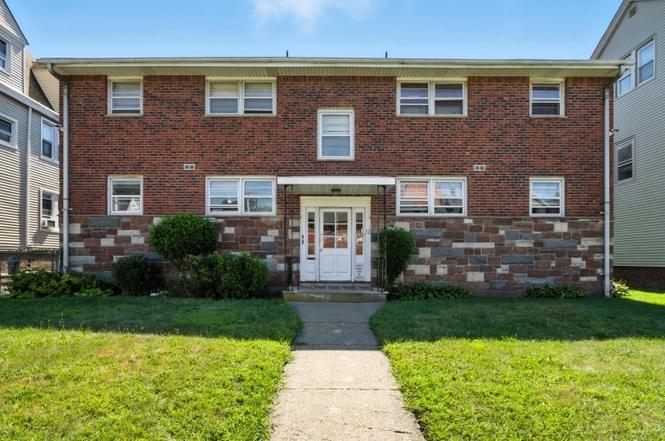
222 Park Ave · East Orange, NJ
Flood risk No data
- FEMA flood zone
- —
- Chance of flooding over 30 yrs
- —
- Est. flood insurance / yr
- —
Fire risk No data
- Est. fire insurance / yr
- —
Heat risk No data
- Hot days now (above threshold)
- —
- Hot days in 30 yrs
- —
Wind risk No data
- Chance of severe wind over 30 yrs
- —
Air-quality risk No data
- Unhealthy air days now
- —
- Unhealthy air days in 30 yrs
- —
Risk factors via First Street. Map © Google.
Why this score? — see what drove the D grade
The composite is a weighted blend of 9 inputs, each scored 0–100. Each bar is that input's sub-score; the figure is the points it added to the 100-point composite (weight × sub-score).
- Cash flow +12.9/30.0
- ARV discount +7.5/15.0
- Appreciation +5.0/10.0
- DSCR +3.9/10.0
- 1% rule +3.7/10.0
- Livability +3.7/5.0
- Rent growth +2.5/5.0
- Condition / age +2.5/5.0
- Schools +1.7/10.0
$999,000
🖨 Deal sheet (PDF) 📄 Offer letter ✓ Due diligence
Multi-family units
County records classify this as Multi-Family (2-4 Unit). Listing-text estimate: 4 units. confirmed
Listing remarks
This 4-family property, is perfect for investors or savvy buyers looking to live in one unit while generating rental income from the others. With strong rental potential, on-site dedicated parking and a prime location, this property is a smart addition to any portfolio.
Key facts
- Prime location
- 9,583 sq ft lot
- 8 parking spots
Tags
Neighborhood map
What this means for you Summary
Snapshot
- This is a 4 × 2-bed/1.0-bath units multifamily listed at $999k.
Deal economics
- At list price, monthly cash flow is $-72 ($-863/yr) — negative. Per door: $-18/mo.
- To cash-flow at today's rent, offer at most $989k (1.0% below list).
- To meet the 1% rule (rent ≥ 1% of price), the offer needs to be $865k (13.4% below list).
- Recommended offer: $865k (13.4% below list) — sets the bar for 1% rule.
- Cap rate 6.2% vs local median 3.0% in East Orange — top-decile yield for the area; either an underpriced asset or a hidden risk that comps aren't pricing in. Stress-test before assuming the spread holds.
Location & tenants
- Location reads 73/100 on livability (#189 in NJ) — a middle-class / working-renter tenant base. Strengths: commute A+, health & safety A, housing A-; Watch: crime D-, amenities F, cost of living D-.
- Orange Board Of Education School District (suburban): math 10% / reading 32% proficiency, ranked #432 of 472 in NJ (top 92%) — low school quality limits family demand, transient renter base, plan for 1-2y turnover; 72% free/reduced lunch — lower-income household profile, screen leases tightly.
- Zoned schools: Park Avenue Elementary School (math 7% / reading 23%, grade F, #1,116 of 1,303 statewide, top 86%, 387 students, 60% FRL); Orange High School (math 12% / reading 10%, grade F, #393 of 399 statewide, top 98%, 1,265 students, 70% FRL).
- Market conditions: 1 active listings in the ZIP; 3,364 units permitted in Essex County in 2024 (2,551 in 5+ unit buildings).
Forward outlook
- In year one you build about $37k of equity ($7k loan paydown + $30k appreciation (3.0% local appreciation)).
- Essex County population projected at +3% by 2050 — modest demand growth; plan on rents tracking national, not racing it.
- At projected returns (3.0% appreciation + 3.0% rent growth), your $280k cash investment doubles in ~7 years — after that, you're playing with house money.
- By year 2, paydown + projected appreciation supports a ~$60k cash-out refi (75% LTV) — recoverable capital for the next deal without selling this one.
Negotiation context
- It's been on market 90 days — a 6% lower offer ($939k) is reasonable based on typical stale-listing flexibility.
- 2 sale attempts with the ask held roughly flat each time — persistent listings suggest the price (not the market) is what's stuck; bring a comps-based counter.
Risks & watch-outs
- Watch-outs: built in 1905 — expect roof / HVAC / electrical / plumbing capex.
Questions for the listing agent
- What do current leases actually rent for vs. the listed asking? Can we see a recent rent roll and the last 12 months of T-12 income?
- It's been on market 90 days. Have you received any prior offers? Is the seller open to a 13% concession, seller financing, or rate buy-down credit?
- Can we see the unit-by-unit rent roll, current vacancy, and any below-market leases? What's the average tenancy length?
- What capital expenditures (roof, boiler, parking lot, exteriors) have been made in the last 5 years, and what's planned in the next 2?
- Built in 1905 — when were the roof, HVAC, electrical panel, plumbing, and water heater last replaced?
- Why hasn't it sold? Are there any deal-killer items the seller is aware of (foundation, flood, title, zoning, code violations)?
- Is there a deadline driving the sale (1031 exchange, divorce, estate, relocation)? That informs how much negotiation room exists.
- Crime grade is D in this area — have there been break-ins, vandalism, or insurance claims at this property in the last 3 years? What carrier currently insures it and at what premium?
- The area grade is low — what's the realistic commute time and amenity access for the typical tenant pool here? Any planned neighborhood developments (good or bad) we should know about?
- What's the average days-on-market for RENTAL listings here right now (not sales)? A rising rental-DOM trend means longer vacancies and softer asking-rent achievability than the comps imply.
- What's the recent tenant-quality profile in this submarket — average credit score on applications, eviction rate, late-payment / NSF rate, and stable-employment percentage? A property-management company in the area should have these aggregated.
- How much new apartment / multifamily construction is in the pipeline within 1–3 miles? Heavy new supply (>2% of stock underway) typically softens rents 12–24 months out; light construction supports rent growth.
Investment metrics
- 1% rule
- 0.87% ✗
- Cap rate
- 6.21%
- Cash-on-cash
- -0.31%
- DSCR
- 0.99
- GRM
- 9.6
CMA / ARV
- ARV (on-the-fly)
- $614,400
- Comps found
- 1
Show comp detail 1 sale within ~0.75 mi
| Address | Dist | Beds/Ba | Sqft | Sold | Price | $/sf | Match |
|---|---|---|---|---|---|---|---|
| 92 Cleveland St | 0.29mi | 7/4.0 (-1) | 3,117 (-3%) | 6mo | $599,000 | $192 | 72 |
Match score weights: distance 35% · size 25% · config 20% · recency 20%. Top-matched comps best support the ARV.
Projected returns pro-forma
3.0% appreciation · 3.0% rent growth · sell at horizon
- IRR
- 7.2%
- Equity multiple
- 1.41×
- Total profit
- $115,893
- Equity at exit
- $449,194
- IRR
- 10.0%
- Equity multiple
- 2.50×
- Total profit
- $419,323
- Equity at exit
- $692,261
Cash invested: $279,720 (down + closing). Projections, not guarantees.
Landlord ↔ Tenant lean methodology
- Overall (STATE)
- 21 Tenant-Leaning
- State New Jersey
- 21 Tenant-Leaning · D+6
- County
- — inherits STATE
- City
- — inherits STATE
ZIP-level market 07050-4146
- Active inventory
- 1
- Price-to-rent
- 38.5×
Monthly cashflow live
- Estimated rent
- $8,648 high interval (Pro) →
- Mortgage (P&I)
- −$5,239
- Tax est. 1.5%
- −$1,249 /mo · $14,985/yr
- Insurance
- −$416
- HOA
- −$0
- Vacancy / Maint / Mgmt
- −$1,816
- Net cashflow
- $-72
Break-even live
Sensitivity live
| Price | -10% $618 | -5% $273 | +0% $-72 | +5% $-417 | +10% $-762 |
|---|---|---|---|---|---|
| Rent | -10% $-755 | -5% $-414 | +0% $-72 | +5% $270 | +10% $611 |
| Rate | -1.0pp $431 | -0.5pp $182 | base $-72 | +0.5pp $-331 | +1.0pp $-594 |
4-unit breakdown (identical units grouped — click to expand)
| Units | Beds | Baths | Est. rent |
|---|---|---|---|
| 4× units | 2 | 1 | $8,648 |
| #1 | 2 | 1 | $2,162 |
| #2 | 2 | 1 | $2,162 |
| #3 | 2 | 1 | $2,162 |
| #4 | 2 | 1 | $2,162 |
| Total (4 units) | $8,648 | ||
UW: 25.0% down · 7.5% · 30yr · 1.5% tax · 5.0% vac · 8.0% maint · 8.0% mgmt
Financing live
Cash to close
- Down payment
- $249,750
- Closing costs
- $29,970
- Reserves months
- —
- Total cash needed
- —
Loan-product check · same deal, 3 products live
Conventional
25% down · 7.5% · 30yr
- Down + closing
- —
- Monthly P&I
- —
- Monthly cashflow
- —
- DSCR
- —
- Eligible?
- —
Personal DTI + credit; lowest rate.
DSCR
20% down · 8.5% · 30yr
- Down + closing
- —
- Monthly P&I
- —
- Monthly cashflow
- —
- DSCR
- —
- Eligible?
- —
No personal income docs; deal must DSCR.
Hard money
10% down · 12.0% · 12mo
- Down + closing
- —
- Monthly P&I
- —
- Monthly cashflow
- —
- DSCR
- —
- Eligible?
- —
Short-term bridge; refi at stabilization.
Listing history 4 events
-
2025-12-24status Under Contract
-
2025-10-30status Active
-
2025-10-17historical
-
2025-09-10$999,000 Active
ⓘ Source: listings_history table (triggers on properties + properties_extension) + one-shot
backfill from property_details.listing_events for pre-trigger history.
Nearby sold comps map
Loading sold comps map…
Walkable amenities ~0.75 mi
Loading nearby amenities…
Taxation est. · year 1
- Rental income
- $103,776
- − Mortgage interest
- −$55,960
- − Property taxes
- −$14,985
- − Insurance
- −$4,995
- − Repairs & maintenance
- −$8,302
- − Management
- −$8,302
- − Depreciation
- −$29,062
- Taxable loss
- −$17,830
- Est. tax savings @ 24.0%
- +$4,279
- After-tax cash flow
- $3,416/yr
For passive investors: Depreciation is non-cash, so a rental often shows a tax loss while cash-flowing — sheltering income. Rental losses are passive: they offset passive income freely, and up to $25,000/yr can offset ordinary (W-2) income if you actively participate and your MAGI is under $100k (phasing out to $0 by $150k); unused losses carry forward. On sale, claimed depreciation is recaptured at up to 25%, and gains may owe capital-gains tax (a 1031 exchange can defer both). Figures are a year-1 estimate at your 24.0% rate — not tax advice; consult a CPA.
Schools (NCES district)
- District
- Orange Board Of Education School District
- NCES district ID
- 3412270
- Math proficiency
- 10% ▼ -18.00%
- Reading proficiency
- 32% ▼ -7.00%
- Median HH income
- $37,178
- Composite
- 17.43/100
- National rank
- #9065
- State rank
- #432 of 472 in NJ
Livability — East Orange
- Score
- 73/100
- State rank
- #189
- US rank
- #5261
Category grades
Schools grade is shown separately in the Schools card above.
Census & demographics
No demographic data for this ZIP.
Market trends
- HPI YoY
- —
- Current HPI
- —
- Rent YoY
- —
- Metro
- —
- State GDP YoY
- ▲ 2.05%
- F500 in state
- 34
Industry mix (Fortune 500 HQ in NJ)
| Industry | F500 HQs | Revenue |
|---|---|---|
| Consumer Goods | 3 | $31B |
|
||
| Pharmaceuticals | 2 | $153B |
|
||
| Technology | 2 | $21B |
|
||
| Insurance | 2 | $20B |
|
||
| Healthcare | 2 | $19B |
|
||
| Financial Services | 1 | $70B |
|
||
Price history
4 events — show timeline
- 2025-12-24 Pending — GSMLS
- 2025-10-30 Relisted — GSMLS
- 2025-10-17 Delisted — GSMLS
- 2025-09-10 Listed $999,000 GSMLS
Cash-flow waterfall
monthlySold comps — $/sqft
last 12 mo · ≤1 miLoading sold comps…