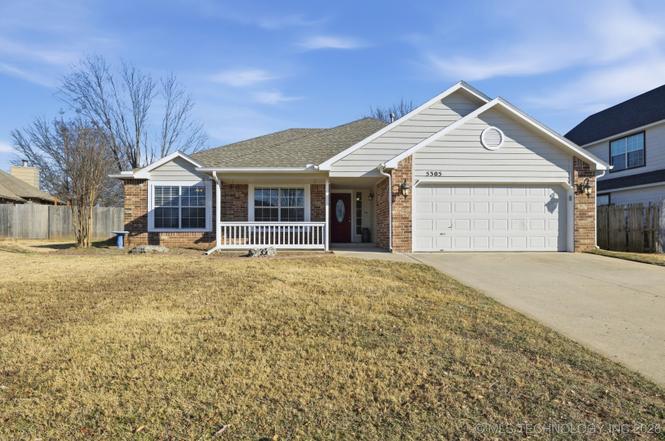
5305 S Maple Pl · Broken Arrow, OK
Flood risk 1/10 · Minimal
- FEMA flood zone
- X (unshaded)
- Chance of flooding over 30 yrs
- 0.0%
- Est. flood insurance / yr
- $473 – $860
Fire risk 4/10 · Minor
- Est. fire insurance / yr
- $2,463 – $4,575
Heat risk 7/10 · Major
- Hot days now (above 111°F)
- 7 days/yr
- Hot days in 30 yrs
- 18 days/yr
Wind risk 2/10 · Minimal
- Chance of severe wind over 30 yrs
- 4.0%
Air-quality risk 2/10 · Minimal
- Unhealthy air days now
- 1 days/yr
- Unhealthy air days in 30 yrs
- 1 days/yr
Risk factors via First Street. Map © Google.
Why this score? — see what drove the D- grade
The composite is a weighted blend of 9 inputs, each scored 0–100. Each bar is that input's sub-score; the figure is the points it added to the 100-point composite (weight × sub-score).
- Cash flow +11.7/30.0
- ARV discount +5.1/15.0
- Livability +3.9/5.0
- Rent growth +3.5/5.0
- DSCR +3.4/10.0
- 1% rule +2.8/10.0
- Condition / age +2.5/5.0
- Schools +2.4/10.0
- Appreciation +0.0/10.0
$275,000
🖨 Deal sheet 📄 Offer letter ✓ Due diligence
Listing remarks MLS
Fabulous home w/ tons of updates! Spectacular kitchen w/ georgous beamed ceiling, new ss appliances w/ 5 burner stove, new hardwoods thruout, professional landscaping, new roof, hw tank, light fixtures, and ceiling fans. Nice backyard w/ koi pond. Must see
Key facts
- Brand-new flooring
- Gorgeous kitchen
- Brick home
Tags
Neighborhood map
What this means for you Summary
Snapshot
- This is a 3-bed/2.0-bath single-family listed at $275k.
Deal economics
- At list price, monthly cash flow is $-80 ($-955/yr) — negative.
- To cash-flow at today's rent, offer at most $261k (5.1% below list).
- To meet the 1% rule (rent ≥ 1% of price), the offer needs to be $213k (22.5% below list).
- Recommended offer: $213k (22.5% below list) — sets the bar for 1% rule.
- Cap rate 5.9% vs local median 4.0% in Broken Arrow — top-decile yield for the area; either an underpriced asset or a hidden risk that comps aren't pricing in. Stress-test before assuming the spread holds.
Location & tenants
- Location reads 78/100 on livability (#7 in OK, #2,691 nationally) — a middle-class / working-renter tenant base. Strengths: commute A+, cost of living A+, housing A+; Watch: schools D+, amenities F.
- Broken Arrow (suburban): math 23% / reading 28% proficiency, ranked #79 of 270 in OK (top 29%) — low school quality limits family demand, transient renter base, plan for 1-2y turnover.
- Market conditions: Rents rising fast (+4.1%/yr); 381 active listings in the ZIP; 11 comparable units currently listed for rent nearby; rentals leasing fast (median 11d on market — plan ~1-2 weeks tenant-placement turnaround); solid renter incomes; 2,818 units permitted in Tulsa County in 2024 (518 in 5+ unit buildings).
Forward outlook
- Local home prices are declining (-3.0%/yr); year-one equity from $2k of loan paydown is wiped out by about $8k of value loss. Plan a longer hold.
- Tulsa County population projected at +30% by 2050 — long-run rental-demand tailwind backs the buy-and-hold thesis.
Negotiation context
- It's been on market 37 days — a 3% lower offer ($267k) is reasonable based on typical stale-listing flexibility.
- 3 sale attempts since 20y ago with the ask held roughly flat each time — persistent listings suggest the price (not the market) is what's stuck; bring a comps-based counter.
- Current owner paid $138k; list at $275k implies a 99% gain — meaningful room to come down on a strong offer.
Risks & watch-outs
- Climate carrying-cost: extreme-heat days projected 7→18/yr by 2055 (HVAC capex compounding) — expect insurance premiums to compound above CPI over the hold.
Questions for the listing agent
- What do current leases actually rent for vs. the listed asking? Can we see a recent rent roll and the last 12 months of T-12 income?
- It's been on market 37 days. Have you received any prior offers? Is the seller open to a 22% concession, seller financing, or rate buy-down credit?
- What does the HOA fee cover, when was the last increase, and are there any pending special assessments or reserve-fund shortfalls?
- Is there a deadline driving the sale (1031 exchange, divorce, estate, relocation)? That informs how much negotiation room exists.
- Schools are D-rated, which usually means shorter tenancies and higher turnover. Who's the typical renter profile here, and what's been the actual vacancy rate?
- The area grade is low — what's the realistic commute time and amenity access for the typical tenant pool here? Any planned neighborhood developments (good or bad) we should know about?
- What's the average days-on-market for RENTAL listings here right now (not sales)? A rising rental-DOM trend means longer vacancies and softer asking-rent achievability than the comps imply.
- What's the recent tenant-quality profile in this submarket — average credit score on applications, eviction rate, late-payment / NSF rate, and stable-employment percentage? A property-management company in the area should have these aggregated.
- How much new for-sale + rental construction is in the pipeline within 1–3 miles? Heavy new supply typically softens prices + rents 12–24 months out; constrained supply supports both.
Investment metrics
- 1% rule
- 0.78% ✗
- Cap rate
- 5.95%
- Cash-on-cash
- -1.24%
- DSCR
- 0.94
- GRM
- 10.8
CMA / ARV
- ARV (on-the-fly)
- $260,946
- Comps found
- 12
Show comp detail 12 sales within ~0.75 mi
| Address | Dist | Beds/Ba | Sqft | Sold | Price | $/sf | Match |
|---|---|---|---|---|---|---|---|
| 5305 S Maple Pl | 0.00mi | 3/2.0 | 1,526 (0%) | 1mo | $270,000 | $177 | 99 |
| 1305 E Durham St | 0.42mi | 3/2.0 | 1,532 (+0%) | 1mo | $265,000 | $173 | 79 |
| 5613 S Juniper Ave | 0.23mi | 3/2.5 | 1,652 (+8%) | 4mo | $191,051 | $116 | 70 |
| 1105 W Durham St | 0.57mi | 3/2.0 | 1,478 (-3%) | 1mo | $225,000 | $152 | 68 |
| 4511 S Narcissus Ave | 0.64mi | 3/2.0 | 1,485 (-3%) | 8mo | $254,000 | $171 | 59 |
| 5105 S Lions Ave | 0.28mi | 3/2.0 | 1,317 (-14%) | 6mo | $225,000 | $171 | 59 |
| 4508 S Ironwood Ave | 0.70mi | 3/2.0 | 1,449 (-5%) | 1mo | $245,000 | $169 | 58 |
| 4500 S Hickory Ave | 0.75mi | 3/2.0 | 1,557 (+2%) | 7mo | $245,000 | $157 | 56 |
| 4901 S Lions Ave | 0.36mi | 3/2.0 | 1,316 (-14%) | 8mo | $247,000 | $188 | 53 |
| 1113 W Durham St | 0.54mi | 3/2.0 | 1,320 (-14%) | 2mo | $225,000 | $170 | 50 |
| 1116 W Birmingham St | 0.63mi | 3/2.0 | 1,340 (-12%) | 1mo | $195,000 | $146 | 49 |
| 1706 W Austin Pl | 0.68mi | 3/2.0 | 1,716 (+12%) | 2mo | $299,900 | $175 | 46 |
Match score weights: distance 35% · size 25% · config 20% · recency 20%. Top-matched comps best support the ARV.
Projected returns pro-forma
-3.0% appreciation · 4.09% rent growth · sell at horizon
- IRR
- -17.2%
- Equity multiple
- 0.39×
- Total profit
- $-47,321
- Equity at exit
- $41,003
- IRR
- -7.5%
- Equity multiple
- 0.51×
- Total profit
- $-38,032
- Equity at exit
- $23,777
Cash invested: $77,000 (down + closing). Projections, not guarantees.
Landlord ↔ Tenant lean methodology
- Overall (STATE)
- 83 Strongly Landlord-Friendly
- State Oklahoma
- 83 Strongly Landlord-Friendly · R+20
- County
- — inherits STATE
- City
- — inherits STATE
ZIP-level market 74011
- Rents YoY
- 4.1%
- Active inventory
- 381
- Price-to-rent
- 10.8×
Monthly cashflow live
- Estimated rent
- $2,131 high interval (Pro) →
- Mortgage (P&I)
- −$1,442
- Tax from tax record
- −$190 /mo · $2,277/yr
- Insurance
- −$115
- HOA
- −$17
- Vacancy / Maint / Mgmt
- −$448
- Net cashflow
- $-80
Break-even live
UW: 25.0% down · 7.5% · 30yr · 1.5% tax · 5.0% vac · 8.0% maint · 8.0% mgmt
Financing live
Cash to close
- Down payment
- $68,750
- Closing costs
- $8,250
- Reserves months
- —
- Total cash needed
- —
Loan-product check · same deal, 3 products live
Conventional
25% down · 7.5% · 30yr
- Down + closing
- —
- Monthly P&I
- —
- Monthly cashflow
- —
- DSCR
- —
- Eligible?
- —
Personal DTI + credit; lowest rate.
DSCR
20% down · 8.5% · 30yr
- Down + closing
- —
- Monthly P&I
- —
- Monthly cashflow
- —
- DSCR
- —
- Eligible?
- —
No personal income docs; deal must DSCR.
Hard money
10% down · 12.0% · 12mo
- Down + closing
- —
- Monthly P&I
- —
- Monthly cashflow
- —
- DSCR
- —
- Eligible?
- —
Short-term bridge; refi at stabilization.
Rent comps 11 comps
| Address | Beds | Baths | Sqft | Rent | $/sqft | DOM | Units | Dist |
|---|---|---|---|---|---|---|---|---|
| 1110 W Birmingham Pl Broken Arrow, OK | 3.0 | 2.0 | 1282 | $1,750 | $1.37 | 3d | 1 | 0.61mi |
| 4623 S Chestnut Ave Broken Arrow, OK | 4.0 | 3.0 | 2023 | $3,800 | $1.88 | 19d | 1 | 0.76mi |
| 4610 S Aspen Ave Broken Arrow, OK | 1.0–2.0 | 1.0–2.0 | 980 | $1,781 | $1.82 | 1d | 36 | 0.77mi |
| 4801 S Elm Pl Broken Arrow, OK | 1.0–2.0 | 1.0–2.0 | 1028 | $1,729 | $1.68 | 1d | 8 | 0.79mi |
| 2602 W Tucson St Broken Arrow, OK | 1.0–2.0 | 1.0–2.5 | 1028 | $1,884 | $1.83 | 1d | 19 | 0.88mi |
| 6308 S 1st Pl Broken Arrow, OK | 3.0 | 2.0 | 1600 | $3,400 | $2.12 | 16d | 1 | 1.11mi |
| 7313 S Walnut Ave Broken Arrow, OK | 3.0 | 2.0 | 1600 | $1,990 | $1.24 | 10d | 1 | 1.25mi |
| 4325 S Ash Ave Broken Arrow, OK | 4.0 | 2.0 | 1400 | $1,578 | $1.13 | 21d | 1 | 1.29mi |
| 2242 W Quantico St Broken Arrow, OK | 3.0 | 2.5 | 1296 | $1,395 | $1.08 | 23d | 1 | 1.34mi |
| 304 W Quantico St Broken Arrow, OK | 2.0 | 2.0 | 1110 | $1,050 | $0.95 | 16d | 1 | 1.42mi |
| 2008 W Huntsville Pl Broken Arrow, OK | 3.0 | 2.0 | 1568 | $2,100 | $1.34 | 3d | 1 | 1.50mi |
HOA detail
- Monthly dues
- $17 · $204/yr
- Likely covers
- landscaping
Listing history 13 events
-
2026-02-09status Pending
-
2026-01-03$275,000 Active
-
2010-08-31soldstatus $138,000
-
2010-08-27soldstatus $138,000 257-char remark
Show marketing remark (257 chars)
Fabulous home w/ tons of updates! Spectacular kitchen w/ georgous beamed ceiling, new ss appliances w/ 5 burner stove, new hardwoods thruout, professional landscaping, new roof, hw tank, light fixtures, and ceiling fans. Nice backyard w/ koi pond. Must see
-
2010-07-23historical 257-char remark
Show marketing remark (257 chars)
Fabulous home w/ tons of updates! Spectacular kitchen w/ georgous beamed ceiling, new ss appliances w/ 5 burner stove, new hardwoods thruout, professional landscaping, new roof, hw tank, light fixtures, and ceiling fans. Nice backyard w/ koi pond. Must see
-
2010-05-24$142,900 257-char remark
Show marketing remark (257 chars)
Fabulous home w/ tons of updates! Spectacular kitchen w/ georgous beamed ceiling, new ss appliances w/ 5 burner stove, new hardwoods thruout, professional landscaping, new roof, hw tank, light fixtures, and ceiling fans. Nice backyard w/ koi pond. Must see
-
2006-05-08soldstatus $125,000
-
2006-04-28soldstatus $125,000 287-char remark
Show marketing remark (287 chars)
Picture perfect!Large, open liv; vltd cross-beam kit open to liv & din; eating bar & pantry; huge mstr w/ bay window; mstr bath w/ whirlpool, sep shower, his & her closests, dbl sinks & skylight; walk-ins in all br's; ceramic tile; goldfish pond; immaculate cond!
-
2006-03-31historical 287-char remark
Show marketing remark (287 chars)
Picture perfect!Large, open liv; vltd cross-beam kit open to liv & din; eating bar & pantry; huge mstr w/ bay window; mstr bath w/ whirlpool, sep shower, his & her closests, dbl sinks & skylight; walk-ins in all br's; ceramic tile; goldfish pond; immaculate cond!
-
2006-03-12$129,900 287-char remark
Show marketing remark (287 chars)
Picture perfect!Large, open liv; vltd cross-beam kit open to liv & din; eating bar & pantry; huge mstr w/ bay window; mstr bath w/ whirlpool, sep shower, his & her closests, dbl sinks & skylight; walk-ins in all br's; ceramic tile; goldfish pond; immaculate cond!
-
2004-11-09soldstatus $123,500
-
1999-03-22soldstatus $106,000
-
1998-03-20soldstatus $420,000
ⓘ Source: listings_history table (triggers on properties + properties_extension) + one-shot
backfill from property_details.listing_events for pre-trigger history.
Tax reassessment forecast OK · Resets to sale price
- Current annual tax
- $2,277 · $190/mo
- Projected year-2 tax
- $2,475 · $206/mo
- Expected delta
- +$198/yr (+$16/mo · 8.7%)
ⓘ Screening estimate from a state-policy table — verify with the county assessor before closing.
Climate risk First Street
- Flood 1/10 Low FEMA zone X (unshaded) · 0% chance over 30 yrs
- Wildfire 4/10 Moderate
- Heat 7/10 Severe 7 d/yr ≥111°F today · 18 d/yr by 30 yrs out
- Wind 2/10 Low 4% chance of damaging wind over 30 yrs
- Air quality 2/10 Low 1 unhealthy d/yr today · 1 by 30 yrs out
Nearby sold comps map
Loading sold comps map…
Walkable amenities ~0.75 mi
Loading nearby amenities…
Taxation est. · year 1
- Rental income
- $25,578
- − Mortgage interest
- −$15,404
- − Property taxes
- −$2,277
- − Insurance
- −$1,375
- − Repairs & maintenance
- −$2,046
- − Management
- −$2,046
- − HOA
- −$204
- − Depreciation
- −$8,000
- Taxable loss
- −$5,775
- Est. tax savings @ 24.0%
- +$1,386
- After-tax cash flow
- $431/yr
For passive investors: Depreciation is non-cash, so a rental often shows a tax loss while cash-flowing — sheltering income. Rental losses are passive: they offset passive income freely, and up to $25,000/yr can offset ordinary (W-2) income if you actively participate and your MAGI is under $100k (phasing out to $0 by $150k); unused losses carry forward. On sale, claimed depreciation is recaptured at up to 25%, and gains may owe capital-gains tax (a 1031 exchange can defer both). Figures are a year-1 estimate at your 24.0% rate — not tax advice; consult a CPA.
Schools (NCES district)
- District
- Broken Arrow
- NCES district ID
- 4005490
- Math proficiency
- 23% ▼ -9.00%
- Reading proficiency
- 28% ▼ -9.00%
- Median HH income
- $64,646
- Composite
- 23.86/100
- National rank
- #7801
- State rank
- #79 of 270 in OK
Livability — Broken Arrow
- Score
- 78/100
- State rank
- #7
- US rank
- #2691
Category grades
Schools grade is shown separately in the Schools card above.
Census & demographics
- Census place
- Broken Arrow, OK
- County
- Tulsa County · 640,811 people
- City population
- 144,172
- Metro
- Tulsa, OK
- Population (ZIP)
- 33,900
- Household income
- $99,157
- Rent vs Own
- Severe rent burden
- 389.0
Population outlook (Tulsa County) Hauer SSP2
- Today (2025)
- 723,846 people
- By 2030
- 766,033 · +5.8%
- By 2040
- 851,386 · +17.6%
- By 2050
- 938,389 · +29.6%
- By 2075
- 1,166,011 · +61.1%
- By 2100
- 1,350,277 · +86.5%
Race, ethnicity, and origin ACS 2023
- Neighborhood character
- Predominantly White (68%)
- Race & ethnicity
- White 68% Two or more races 15% Hispanic / Latino 10% Native American 4% Black 4% Asian 3%
- Hispanic origin (detail)
- Mexican 7%
- Common ancestry
- Lithuanian 3% Serbian 2% Slovak 2%
- Foreign-born
- 5% · Canada
- Languages at home
- 93% English-only · Spanish 5% Other Asian/Pacific 1%
Political lean MEDSL · Tulsa
- 2024 margin
- R (+15.2) · D 41.3% · R 56.5% · Other 2.2%
- 2008→2024 swing
- +9.2pp toward D · 2008: -24.5pp · 2024: -15.2pp
- All cycles
- 2024: R+15.2 2020: R+15.6 2016: R+22.9 2012: R+27.4 2008: R+24.5
Not yet ingested
- Civics
- —
Market trends
- HPI YoY
- ▼ -180.15%
- Current HPI
- 210.8302
- Rent YoY
- ▲ 4.09%
- Metro
- Tulsa, OK
- State GDP YoY
- ▲ 1.55%
- F500 in state
- 6
Industry mix (Fortune 500 HQ in OK)
| Industry | F500 HQs | Revenue |
|---|---|---|
| Energy | 3 | $48B |
|
||
Price history
-34.5% since first listed13 events — show timeline
- 2026-02-09 Pending — MLS Technology, Inc.
- 2026-01-03 Listed $275,000 MLS Technology, Inc.
- 2010-08-31 Sold (Public Records) $138,000 Public Records
- 2010-08-27 Sold (MLS) $138,000 MLS Technology, Inc.
- 2010-07-23 Listing Removed — MLS Technology, Inc.
- 2010-05-24 Listed $142,900 MLS Technology, Inc.
- 2006-05-08 Sold (Public Records) $125,000 Public Records
- 2006-04-28 Sold (MLS) $125,000 MLS Technology, Inc.
- 2006-03-31 Listing Removed — MLS Technology, Inc.
- 2006-03-12 Listed $129,900 MLS Technology, Inc.
- 2004-11-09 Sold (Public Records) $123,500 Public Records
- 1999-03-22 Sold (Public Records) $106,000 Public Records
- 1998-03-20 Sold (Public Records) $420,000 Public Records
Property tax history
+1.9%/yrLatest (2025): $2,277 · +11.5% YoY. Source: county tax records.
Cash-flow waterfall
monthlySold comps — $/sqft
last 12 mo · ≤1 miLoading sold comps…