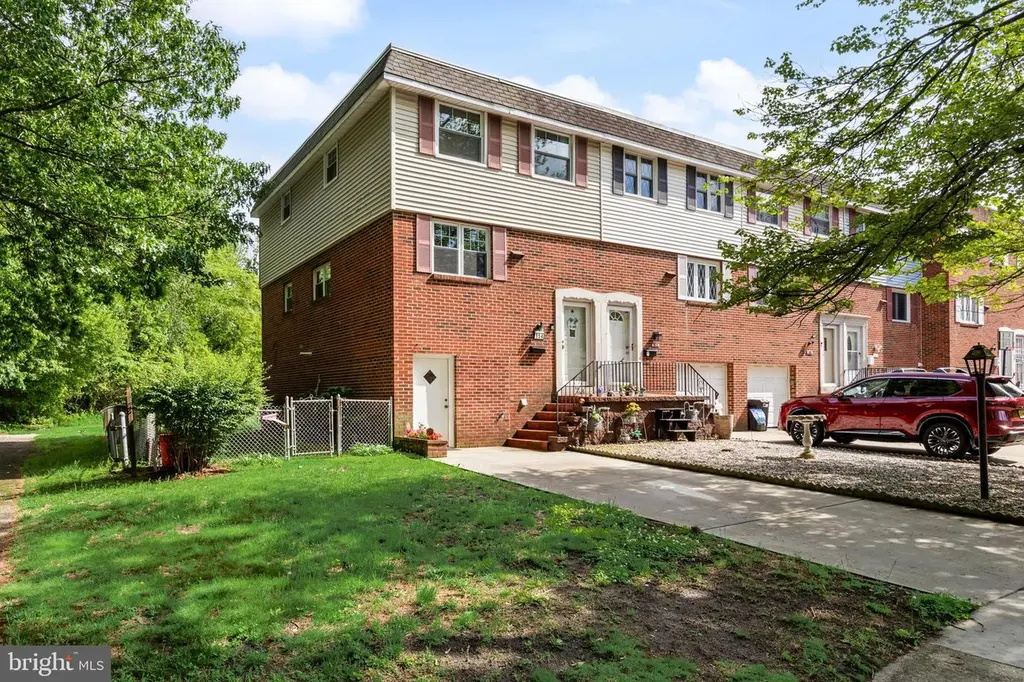
154 Laureba Ave · Stratford, NJ
Flood risk 1/10 · Minimal
- FEMA flood zone
- X (unshaded)
- Chance of flooding over 30 yrs
- 0.0%
- Est. flood insurance / yr
- $507 – $1,088
Fire risk 1/10 · Minimal
- Est. fire insurance / yr
- $526 – $976
Heat risk 6/10 · Moderate
- Hot days now (above 103°F)
- 7 days/yr
- Hot days in 30 yrs
- 15 days/yr
Wind risk 6/10 · Moderate
- Chance of severe wind over 30 yrs
- 56.0%
Air-quality risk 3/10 · Minor
- Unhealthy air days now
- 3 days/yr
- Unhealthy air days in 30 yrs
- 3 days/yr
Risk factors via First Street. Map © Google.
Why this score? — see what drove the C grade
The composite is a weighted blend of 9 inputs, each scored 0–100. Each bar is that input's sub-score; the figure is the points it added to the 100-point composite (weight × sub-score).
- Cash flow +19.8/30.0
- ARV discount +15.0/15.0
- DSCR +6.3/10.0
- 1% rule +5.8/10.0
- Livability +3.8/5.0
- Schools +2.9/10.0
- Rent growth +2.5/5.0
- Condition / age +2.5/5.0
- Appreciation +0.0/10.0
$275,000
🖨 Deal sheet 📄 Offer letter ✓ Due diligence
Listing remarks
Welcome home to this beautifully maintained 3 bed, 1.5 bath townhome in Stratford! This spacious home offers 3 levels of living space and sits on a desirable corner lot in one of the best locations in the neighborhood, backing directly to the park for added privacy and peaceful views. Inside, you’ll find an updated kitchen and baths, newer flooring, and pride of long-term ownership throughout. The layout offers plenty of space to spread out, with comfortable living areas and generously sized bedrooms. Conveniently located near shopping, dining, schools, and major roadways, this move-in ready home is one you won’t want to miss!
Key facts
- Updated baths
- Newer flooring
- Updated kitchen
Tags
Property features AI
Finance
- Financial info: Ownership is fee simple; Improvement and land assessed values recorded (assessor)
Exterior
- Parking: Driveway parking
- Utilities: Public water; Public sewer; Natural gas hot water; Natural gas heating
- Home design: Detached property; Above-grade finished area 1,836 (assessor)
- Construction: Frame construction; Slab foundation; Above-grade and below-grade structures present; Year built recorded by assessor
- Exterior features: Lot dimensions approximately 32 x 120; Tidal water not present
Interior
- Bedrooms: Three bedrooms on the upper level
- Bathrooms: One full bathroom; One half bathroom
- Heating & cooling: Forced air heating; Central air conditioning
- Interior features: Living area measured by assessor; No basement
Neighborhood map
What this means for you Summary
Snapshot
- This is a 3-bed/1.5-bath single-family listed at $275k.
Deal economics
- At list price, monthly cash flow is $328 ($4k/yr) — positive.
- The deal already cash-flows at list — no discount required.
- Meets the 1% rule at list price ($3k rent vs $275k).
- Cap rate 7.7% vs local median 3.5% in Stratford — top-decile yield for the area; either an underpriced asset or a hidden risk that comps aren't pricing in. Stress-test before assuming the spread holds.
Location & tenants
- Location reads 76/100 on livability (#131 in NJ, #3,497 nationally) — a middle-class / working-renter tenant base. Strengths: crime A+, employment A+, housing A+; Watch: amenities F, commute F.
- Stratford School District (suburban): math 21% / reading 42% proficiency, ranked #317 of 472 in NJ (top 67%) — families likely to look elsewhere, expect single-tenant / working-renter base with shorter leases.
- Market conditions: 27 active listings in the ZIP; 10 comparable units currently listed for rent nearby; rentals leasing fast (median 10d on market — plan ~1-2 weeks tenant-placement turnaround); 1,018 units permitted in Camden County in 2024 (509 in 5+ unit buildings).
Forward outlook
- Local home prices are declining (-3.0%/yr); year-one equity from $2k of loan paydown is wiped out by about $8k of value loss. Plan a longer hold.
- Camden County population projected to shrink 8% by 2050 — rents likely to lag national; underwrite the cash flow, not the appreciation.
Negotiation context
- Only 14 days on market — expect competitive offers; lowballing is unlikely to land.
- Current owner paid $35k; list at $275k implies a 690% gain — meaningful room to come down on a strong offer.
Risks & watch-outs
- Climate carrying-cost: major wind risk, 56% chance of damaging wind over 30y; extreme-heat days projected 7→15/yr by 2055 (HVAC capex compounding) — expect insurance premiums to compound above CPI over the hold.
Questions for the listing agent
- Built in 1965 — when were the roof, HVAC, electrical panel, plumbing, and water heater last replaced?
- Is there a deadline driving the sale (1031 exchange, divorce, estate, relocation)? That informs how much negotiation room exists.
- Schools are B-rated — typically a magnet for longer-tenancy family renters. What's the average tenant stay here, and is there a school-zone premium baked into asking?
- What's the average days-on-market for RENTAL listings here right now (not sales)? A rising rental-DOM trend means longer vacancies and softer asking-rent achievability than the comps imply.
- What's the recent tenant-quality profile in this submarket — average credit score on applications, eviction rate, late-payment / NSF rate, and stable-employment percentage? A property-management company in the area should have these aggregated.
- How much new for-sale + rental construction is in the pipeline within 1–3 miles? Heavy new supply typically softens prices + rents 12–24 months out; constrained supply supports both.
Investment metrics
- 1% rule
- 1.08% ✓
- Cap rate
- 7.72%
- Cash-on-cash
- 5.11%
- DSCR
- 1.23
- GRM
- 7.7
CMA / ARV
- ARV (on-the-fly)
- $356,184
- Comps found
- 12
Show comp detail 12 sales within ~0.75 mi
| Address | Dist | Beds/Ba | Sqft | Sold | Price | $/sf | Match |
|---|---|---|---|---|---|---|---|
| 140 Laureba Ave | 0.02mi | 3/1.5 | 1,836 (0%) | 4mo | $275,000 | $150 | 96 |
| 124 Stratford Ave | 0.17mi | 4/1.5 (+1) | 1,660 (-10%) | 1mo | $330,000 | $199 | 70 |
| 202 Broadway | 0.45mi | 3/1.5 | 1,764 (-4%) | 6mo | $355,000 | $201 | 67 |
| 326 Chestnut Ave | 0.58mi | 4/2.5 (+1) | 1,870 (+2%) | 7mo | $330,000 | $176 | 55 |
| 1006 Chestnut Ave | 0.61mi | 3/1.0 | 1,689 (-8%) | 2mo | $325,000 | $192 | 55 |
| 105 Summit Ave | 0.38mi | 3/1.0 | 1,600 (-13%) | 7mo | $310,000 | $194 | 53 |
| 316 E Stafford Ave | 0.53mi | 4/2.0 (+1) | 1,732 (-6%) | 7mo | $340,000 | $196 | 53 |
| 137 E Elm Ave | 0.49mi | 3/2.0 | 1,653 (-10%) | 7mo | $359,000 | $217 | 53 |
| 126 E Linden Ave | 0.43mi | 4/2.5 (+1) | 1,703 (-7%) | 8mo | $325,000 | $191 | 52 |
| 1256 Kirkwood-gibbsboro R | 0.71mi | 2/1.5 (-1) | 1,738 (-5%) | 3mo | $390,000 | $224 | 51 |
| 413 Myrtle Ave | 0.47mi | 2/2.0 (-1) | 1,650 (-10%) | 5mo | $240,000 | $145 | 50 |
| 101 Hemlock Ave | 0.34mi | 4/1.5 (+1) | 1,579 (-14%) | 9mo | $307,000 | $194 | 48 |
Match score weights: distance 35% · size 25% · config 20% · recency 20%. Top-matched comps best support the ARV.
Projected returns pro-forma
-3.0% appreciation · 3.0% rent growth · sell at horizon
- IRR
- -8.3%
- Equity multiple
- 0.69×
- Total profit
- $-23,563
- Equity at exit
- $41,003
- IRR
- 1.3%
- Equity multiple
- 1.09×
- Total profit
- $6,858
- Equity at exit
- $23,777
Cash invested: $77,000 (down + closing). Projections, not guarantees.
Landlord ↔ Tenant lean methodology
- Overall (STATE)
- 21 Tenant-Leaning
- State New Jersey
- 21 Tenant-Leaning · D+6
- County
- — inherits STATE
- City
- — inherits STATE
ZIP-level market 08084
- Home prices YoY
- -17.5%
- Active inventory
- 27
- Price-to-rent
- 7.7×
Monthly cashflow live
- Estimated rent
- $2,977 high interval (Pro) →
- Mortgage (P&I)
- −$1,442
- Tax from tax record
- −$468 /mo · $5,611/yr
- Insurance
- −$115
- HOA
- −$0
- Vacancy / Maint / Mgmt
- −$625
- Net cashflow
- $328
Break-even live
UW: 25.0% down · 7.5% · 30yr · 1.5% tax · 5.0% vac · 8.0% maint · 8.0% mgmt
Financing live
Cash to close
- Down payment
- $68,750
- Closing costs
- $8,250
- Reserves months
- —
- Total cash needed
- —
Loan-product check · same deal, 3 products live
Conventional
25% down · 7.5% · 30yr
- Down + closing
- —
- Monthly P&I
- —
- Monthly cashflow
- —
- DSCR
- —
- Eligible?
- —
Personal DTI + credit; lowest rate.
DSCR
20% down · 8.5% · 30yr
- Down + closing
- —
- Monthly P&I
- —
- Monthly cashflow
- —
- DSCR
- —
- Eligible?
- —
No personal income docs; deal must DSCR.
Hard money
10% down · 12.0% · 12mo
- Down + closing
- —
- Monthly P&I
- —
- Monthly cashflow
- —
- DSCR
- —
- Eligible?
- —
Short-term bridge; refi at stabilization.
Rent comps 10 comps
| Address | Beds | Baths | Sqft | Rent | $/sqft | DOM | Units | Dist |
|---|---|---|---|---|---|---|---|---|
| 222 Berlin Rd N Lindenwold, NJ | 3.0 | 1.5 | 1925 | $3,300 | $1.71 | 1d | 1 | 0.18mi |
| 5 Sidney Ln Stratford, NJ | 2.0 | 2.5 | 1548 | $2,800 | $1.81 | 1d | 1 | 0.44mi |
| 126 Washington Ave Unit 1B Laurel Springs, NJ | 2.0 | 1.0 | 2309 | $1,950 | $0.84 | 17d | 1 | 0.45mi |
| 16 W Linden Ave Lindenwold, NJ | 4.0 | 1.0 | 1560 | $2,950 | $1.89 | 1d | 1 | 0.55mi |
| 1256 Kirkwood-gibbsboro R Voorhees, NJ | 2.0 | 2.0 | 1738 | $1,050 | $0.60 | 22d | 1 | 0.72mi |
| 98 Oak St Clementon, NJ | 1.0–2.0 | 1.0–2.0 | 1027 | $2,040 | $1.99 | 1d | 44 | 0.76mi |
| 215 S Atlantic Ave E Stratford, NJ | 3.0 | 1.0 | 1460 | $2,445 | $1.67 | 10d | 1 | 0.87mi |
| 8 Cornell Ave Somerdale, NJ | 4.0 | 2.0 | 1546 | $3,200 | $2.07 | 24d | 1 | 1.19mi |
| 4 Millbank Ct Voorhees, NJ | 3.0 | 2.5 | 1470 | $3,400 | $2.31 | 1d | 1 | 1.25mi |
| 136 Colonial Sq Lindenwold, NJ | 3.0 | 1.5 | 1380 | $1,950 | $1.41 | 24d | 1 | 1.30mi |
Listing history 12 events
-
2026-06-17status $275,000 Pending 14 DOM
-
2026-06-13statusdays on market $275,000 Active Under Contract 14 DOM
-
2026-06-09days on market $275,000 Active 12 DOM
-
2026-06-08days on market $275,000 Active 11 DOM
-
2026-06-07days on market $275,000 Active 10 DOM
-
2026-06-04days on market $275,000 Active 7 DOM
-
2026-06-03days on market $275,000 Active 6 DOM
-
2026-06-02days on market $275,000 Active 5 DOM
-
2026-06-01days on market $275,000 Active 4 DOM
-
2026-05-31days on market $275,000 Active 3 DOM
-
2026-05-28$275,000 Active
-
1979-01-01soldstatus $34,800
ⓘ Source: listings_history table (triggers on properties + properties_extension) + one-shot
backfill from property_details.listing_events for pre-trigger history.
Tax reassessment forecast NJ · Partial reset (capped growth)
- Current annual tax
- $5,611 · $468/mo
- Projected year-2 tax
- $6,229 · $519/mo
- Expected delta
- +$618/yr (+$52/mo · 11.0%)
ⓘ Screening estimate from a state-policy table — verify with the county assessor before closing.
Climate risk First Street
- Flood 1/10 Low FEMA zone X (unshaded) · 0% chance over 30 yrs
- Wildfire 1/10 Low
- Heat 6/10 Major 7 d/yr ≥103°F today · 15 d/yr by 30 yrs out
- Wind 6/10 Major 56% chance of damaging wind over 30 yrs
- Air quality 3/10 Moderate 3 unhealthy d/yr today · 3 by 30 yrs out
Nearby sold comps map
Loading sold comps map…
Walkable amenities ~0.75 mi
Loading nearby amenities…
Taxation est. · year 1
- Rental income
- $35,728
- − Mortgage interest
- −$15,404
- − Property taxes
- −$5,611
- − Insurance
- −$1,375
- − Repairs & maintenance
- −$2,858
- − Management
- −$2,858
- − Depreciation
- −$8,000
- Taxable loss
- −$379
- Est. tax savings @ 24.0%
- +$91
- After-tax cash flow
- $4,025/yr
For passive investors: Depreciation is non-cash, so a rental often shows a tax loss while cash-flowing — sheltering income. Rental losses are passive: they offset passive income freely, and up to $25,000/yr can offset ordinary (W-2) income if you actively participate and your MAGI is under $100k (phasing out to $0 by $150k); unused losses carry forward. On sale, claimed depreciation is recaptured at up to 25%, and gains may owe capital-gains tax (a 1031 exchange can defer both). Figures are a year-1 estimate at your 24.0% rate — not tax advice; consult a CPA.
Schools (NCES district)
- District
- Stratford School District
- NCES district ID
- 3415870
- Math proficiency
- 21% ▼ -28.00%
- Reading proficiency
- 42% ▼ -22.00%
- Median HH income
- $66,959
- Composite
- 28.99/100
- National rank
- #6621
- State rank
- #317 of 472 in NJ
Livability — Stratford
- Score
- 76/100
- State rank
- #131
- US rank
- #3497
Category grades
Schools grade is shown separately in the Schools card above.
Census & demographics
- Census place
- Stratford, NJ
- City population
- 6,965
- Population (ZIP)
- 6,965
Population outlook (Camden County) Hauer SSP2
- Today (2025)
- 507,964 people
- By 2030
- 502,182 · -1.1%
- By 2040
- 485,602 · -4.4%
- By 2050
- 465,630 · -8.3%
- By 2075
- 419,986 · -17.3%
- By 2100
- 369,492 · -27.3%
Race, ethnicity, and origin ACS 2023
- Neighborhood character
- Predominantly White (71%)
- Race & ethnicity
- White 71% Hispanic / Latino 13% Black 8% Two or more races 8% Asian 3%
- Hispanic origin (detail)
- Mexican 2% Puerto Rican 4%
- Common ancestry
- Romanian 5% Portuguese 2% Slovak 1%
- Foreign-born
- 10% · Canada, Philippines, Vietnam
- Languages at home
- 85% English-only · Spanish 9% Other Indo-European 2% Other Asian/Pacific 1%
Political lean MEDSL · Camden
- 2024 margin
- Strong D (+27.4) · D 63.0% · R 35.5% · Other 1.5%
- 2008→2024 swing
- -8.8pp toward R · 2008: 36.2pp · 2024: 27.4pp
- All cycles
- 2024: D+27.4 2020: D+33.5 2016: D+32.4 2012: D+36.6 2008: D+36.2
Not yet ingested
- Civics
- —
Market trends
- HPI YoY
- ▼ -75.77%
- Current HPI
- 357.8554
- Rent YoY
- —
- Metro
- —
- State GDP YoY
- ▲ 2.05%
- F500 in state
- 34
Industry mix (Fortune 500 HQ in NJ)
| Industry | F500 HQs | Revenue |
|---|---|---|
| Consumer Goods | 3 | $31B |
|
||
| Pharmaceuticals | 2 | $153B |
|
||
| Technology | 2 | $21B |
|
||
| Insurance | 2 | $20B |
|
||
| Healthcare | 2 | $19B |
|
||
| Financial Services | 1 | $70B |
|
||
Price history
+690.2% since first listed2 events — show timeline
- 2026-05-28 Listed $275,000 BRIGHT MLS
- 1979-01-01 Sold (Public Records) $34,800 Public Records
Property tax history
+1.5%/yrLatest (2025): $5,611 · +3.0% YoY. Source: county tax records.
Cash-flow waterfall
monthlySold comps — $/sqft
last 12 mo · ≤1 miLoading sold comps…