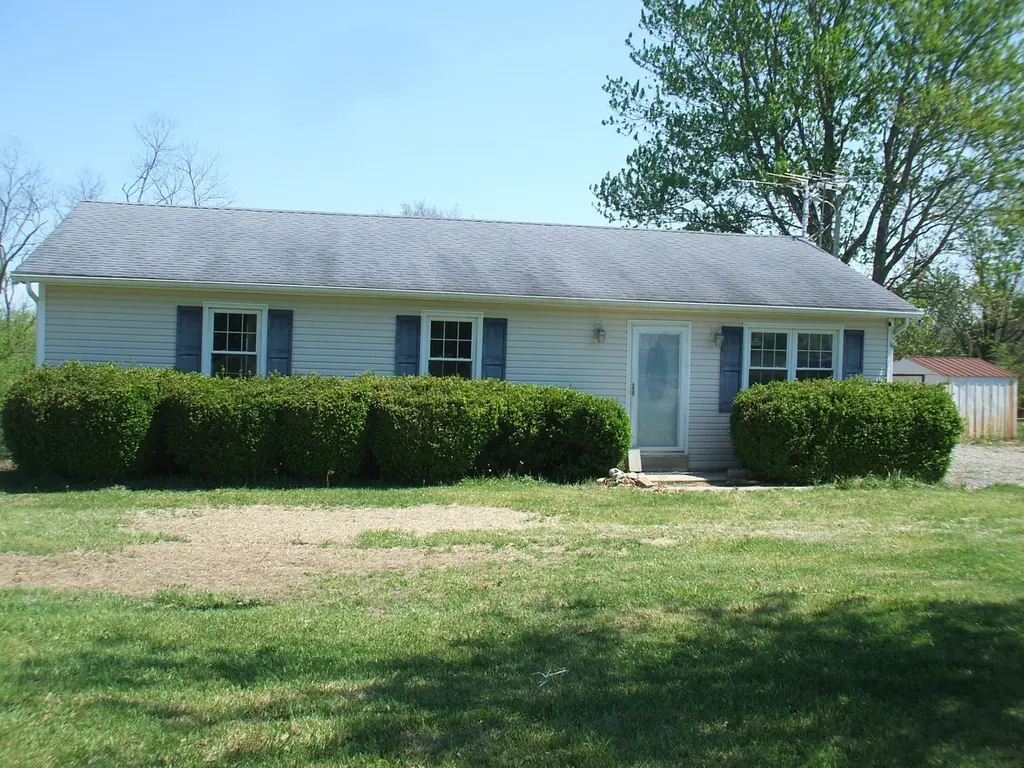
354 Maupin Rd · Lancaster, KY
Flood risk 1/10 · Minimal
- FEMA flood zone
- X (unshaded)
- Chance of flooding over 30 yrs
- 0.0%
- Est. flood insurance / yr
- $507 – $1,088
Fire risk 6/10 · Moderate
- Est. fire insurance / yr
- $839 – $1,559
Heat risk 4/10 · Minor
- Hot days now (above 102°F)
- 7 days/yr
- Hot days in 30 yrs
- 20 days/yr
Wind risk 2/10 · Minimal
- Chance of severe wind over 30 yrs
- 4.0%
Air-quality risk 1/10 · Minimal
- Unhealthy air days now
- 0 days/yr
- Unhealthy air days in 30 yrs
- 0 days/yr
Risk factors via First Street. Map © Google.
Why this score? — see what drove the B- grade
The composite is a weighted blend of 9 inputs, each scored 0–100. Each bar is that input's sub-score; the figure is the points it added to the 100-point composite (weight × sub-score).
- Cash flow +30.0/30.0
- 1% rule +10.0/10.0
- DSCR +10.0/10.0
- ARV discount +7.5/15.0
- Livability +3.2/5.0
- Schools +3.0/10.0
- Rent growth +2.5/5.0
- Condition / age +2.5/5.0
- Appreciation +1.0/10.0
$119,000
🖨 Deal sheet (PDF) 📄 Offer letter ✓ Due diligence
Listing remarks MLS
Very attractive country home with lots of privacy. Home has 3 bedrooms and one full bath. Open kitchen/living area. This property is being sold AS IS since it does need some interior finishes and remodeling. The roof is approximately 10 years old and the HVAC system is also 10 years old. Beautiful location for country living. Additionally, baseboard heaters are present and work well if Buyer/s would like separate heating for individual rooms. Inspections are welcomed. Perfect home for investors.
Key facts
- Baseboard heaters
- 1.23 acre lot
- Built 1983
Tags
Neighborhood map
What this means for you Summary
Snapshot
- This is a 3-bed/1.0-bath other listed at $119k.
Deal economics
- At list price, monthly cash flow is $727 ($9k/yr) — positive.
- The deal already cash-flows at list — no discount required.
- Meets the 1% rule at list price ($2k rent vs $119k).
- Recommended offer: $115k (3.0% below list) — sets the bar for market timing.
Location & tenants
- Location reads 63/100 on livability (#314 in KY) — a middle-class / working-renter tenant base. Strengths: crime A+, cost of living A+, housing A-; Watch: health & safety D+, amenities F, commute F.
- Garrard County (rural): math 28% / reading 42% proficiency, ranked #63 of 165 in KY (top 38%) — families likely to look elsewhere, expect single-tenant / working-renter base with shorter leases.
- Zoned schools: Paint Lick Elementary School (math 22% / reading 47%, grade F, #301 of 676 statewide, top 48%, 309 students, 70% FRL); Garrard Middle School (math 21% / reading 42%, grade F, #125 of 217 statewide, top 63%, 563 students, 64% FRL); Garrard County High School (math 27% / reading 37%, grade F, #97 of 254 statewide, top 46%, 801 students, 59% FRL).
- Market conditions: 168 active listings in the ZIP.
Forward outlook
- Local home prices are declining (-3.0%/yr); year-one equity from $823 of loan paydown is wiped out by about $4k of value loss. Plan a longer hold.
- At projected returns (-3.0% appreciation + 3.0% rent growth), your $33k cash investment doubles in ~5 years — after that, you're playing with house money.
Negotiation context
- It's been on market 55 days — a 3% lower offer ($115k) is reasonable based on typical stale-listing flexibility.
Risks & watch-outs
- Climate carrying-cost: major wildfire risk — expect insurance premiums to compound above CPI over the hold.
Questions for the listing agent
- It's been on market 55 days. Have you received any prior offers? Is the seller open to a 3% concession, seller financing, or rate buy-down credit?
- Is there a deadline driving the sale (1031 exchange, divorce, estate, relocation)? That informs how much negotiation room exists.
- Schools are D-rated, which usually means shorter tenancies and higher turnover. Who's the typical renter profile here, and what's been the actual vacancy rate?
- What's the average days-on-market for RENTAL listings here right now (not sales)? A rising rental-DOM trend means longer vacancies and softer asking-rent achievability than the comps imply.
- What's the recent tenant-quality profile in this submarket — average credit score on applications, eviction rate, late-payment / NSF rate, and stable-employment percentage? A property-management company in the area should have these aggregated.
- How much new for-sale + rental construction is in the pipeline within 1–3 miles? Heavy new supply typically softens prices + rents 12–24 months out; constrained supply supports both.
Investment metrics
- 1% rule
- 1.57% ✓
- Cap rate
- 13.63%
- Cash-on-cash
- 26.19%
- DSCR
- 2.17
- GRM
- 5.3
CMA / ARV
No comps found within radius.
Projected returns pro-forma
-3.0% appreciation · 3.0% rent growth · sell at horizon
- IRR
- 19.9%
- Equity multiple
- 1.81×
- Total profit
- $27,014
- Equity at exit
- $17,743
- IRR
- 28.2%
- Equity multiple
- 3.49×
- Total profit
- $83,091
- Equity at exit
- $10,289
Cash invested: $33,320 (down + closing). Projections, not guarantees.
Landlord ↔ Tenant lean methodology
- Overall (STATE)
- 83 Strongly Landlord-Friendly
- State Kentucky
- 83 Strongly Landlord-Friendly · R+16
- County
- — inherits STATE
- City
- — inherits STATE
ZIP-level market 40444
- Home prices YoY
- -2.6%
- Active inventory
- 168
- Price-to-rent
- 5.3×
Monthly cashflow live
- Estimated rent
- $1,868 medium interval (Pro) →
- Mortgage (P&I)
- −$624
- Tax from tax record
- −$75 /mo · $900/yr
- Insurance
- −$50
- HOA
- −$0
- Lot rent
- −$0
- Vacancy / Maint / Mgmt
- −$392
- Net cashflow
- $727
Break-even live
Sensitivity live
| Price | -10% $795 | -5% $761 | +0% $727 | +5% $693 | +10% $660 |
|---|---|---|---|---|---|
| Rent | -10% $580 | -5% $653 | +0% $727 | +5% $801 | +10% $875 |
| Rate | -1.0pp $787 | -0.5pp $757 | base $727 | +0.5pp $696 | +1.0pp $665 |
UW: 25.0% down · 7.5% · 30yr · 1.5% tax · 5.0% vac · 8.0% maint · 8.0% mgmt
Financing live
Cash to close
- Down payment
- $29,750
- Closing costs
- $3,570
- Reserves months
- —
- Total cash needed
- —
Loan-product check · same deal, 3 products live
Conventional
25% down · 7.5% · 30yr
- Down + closing
- —
- Monthly P&I
- —
- Monthly cashflow
- —
- DSCR
- —
- Eligible?
- —
Personal DTI + credit; lowest rate.
DSCR
20% down · 8.5% · 30yr
- Down + closing
- —
- Monthly P&I
- —
- Monthly cashflow
- —
- DSCR
- —
- Eligible?
- —
No personal income docs; deal must DSCR.
Hard money
10% down · 12.0% · 12mo
- Down + closing
- —
- Monthly P&I
- —
- Monthly cashflow
- —
- DSCR
- —
- Eligible?
- —
Short-term bridge; refi at stabilization.
Listing history 7 events
-
2026-06-03status $119,000 Pending 55 DOM
-
2026-06-02days on market $119,000 Active 55 DOM
-
2026-06-01days on market $119,000 Active 54 DOM
-
2026-05-31days on market $119,000 Active 53 DOM
-
2026-05-30days on market $119,000 Active 52 DOM
-
2026-05-18price $119,000 509-char remark
Show marketing remark (509 chars)
Very attractive country home with lots of privacy. Home has 3 bedrooms and one full bath. Open kitchen/living area. This property is being sold AS IS since it does need some interior finishes and remodeling. The roof is approximately 10 years old and the HVAC system is also 10 years old. Beautiful location for country living. Additionally, baseboard heaters are present and work well if Buyer/s would like separate heating for individual rooms. Inspections are welcomed. Perfect home for investors.
-
2026-04-05$149,900 Active 509-char remark
Show marketing remark (509 chars)
Very attractive country home with lots of privacy. Home has 3 bedrooms and one full bath. Open kitchen/living area. This property is being sold AS IS since it does need some interior finishes and remodeling. The roof is approximately 10 years old and the HVAC system is also 10 years old. Beautiful location for country living. Additionally, baseboard heaters are present and work well if Buyer/s would like separate heating for individual rooms. Inspections are welcomed. Perfect home for investors.
ⓘ Source: listings_history table (triggers on properties + properties_extension) + one-shot
backfill from property_details.listing_events for pre-trigger history.
Tax reassessment forecast KY · Resets to sale price
- Current annual tax
- $900 · $75/mo
- Projected year-2 tax
- $1,023 · $85/mo
- Expected delta
- +$123/yr (+$10/mo · 13.7%)
ⓘ Screening estimate from a state-policy table — verify with the county assessor before closing.
Climate risk First Street
- Flood 1/10 Low FEMA zone X (unshaded) · 0% chance over 30 yrs
- Wildfire 6/10 Major
- Heat 4/10 Moderate 7 d/yr ≥102°F today · 20 d/yr by 30 yrs out
- Wind 2/10 Low 4% chance of damaging wind over 30 yrs
- Air quality 1/10 Low 0 unhealthy d/yr today · 0 by 30 yrs out
Nearby sold comps map
Loading sold comps map…
Walkable amenities ~0.75 mi
Loading nearby amenities…
Taxation est. · year 1
- Rental income
- $22,418
- − Mortgage interest
- −$6,666
- − Property taxes
- −$900
- − Insurance
- −$595
- − Repairs & maintenance
- −$1,793
- − Management
- −$1,793
- − Depreciation
- −$3,462
- Taxable income
- $7,208
- Est. tax owed @ 24.0%
- −$1,730
- After-tax cash flow
- $6,996/yr
For passive investors: Depreciation is non-cash, so a rental often shows a tax loss while cash-flowing — sheltering income. Rental losses are passive: they offset passive income freely, and up to $25,000/yr can offset ordinary (W-2) income if you actively participate and your MAGI is under $100k (phasing out to $0 by $150k); unused losses carry forward. On sale, claimed depreciation is recaptured at up to 25%, and gains may owe capital-gains tax (a 1031 exchange can defer both). Figures are a year-1 estimate at your 24.0% rate — not tax advice; consult a CPA.
Schools (NCES district)
- District
- Garrard County
- NCES district ID
- 2102160
- Math proficiency
- 28% ▼ -12.00%
- Reading proficiency
- 42% ▼ -11.00%
- Median HH income
- $43,411
- Composite
- 29.67/100
- National rank
- #6462
- State rank
- #63 of 165 in KY
Livability — Lancaster
- Score
- 63/100
- State rank
- #314
- US rank
- #15040
Category grades
Schools grade is shown separately in the Schools card above.
Census & demographics
- Population (ZIP)
- 14,207
Population outlook (Garrard County) Hauer SSP2
- Today (2025)
- 17,852 people
- By 2030
- 18,018 · +0.9%
- By 2040
- 18,076 · +1.3%
- By 2050
- 17,592 · -1.5%
- By 2075
- 16,128 · -9.7%
- By 2100
- 13,489 · -24.4%
Race, ethnicity, and origin ACS 2023
- Neighborhood character
- Predominantly White (91%)
- Race & ethnicity
- White 91% Two or more races 4% Hispanic / Latino 3% Black 3%
- Common ancestry
- Italian 1% Subsaharan African 1% Slovak 1%
- Foreign-born
- 3% · Canada, Dominican Republic
- Languages at home
- 97% English-only · Spanish 1% Russian/Polish/Slavic 1%
Political lean MEDSL · Garrard
- 2024 margin
- Solid R (+60.2) · D 19.3% · R 79.5% · Other 1.3%
- 2008→2024 swing
- -17.1pp toward R · 2008: -43.1pp · 2024: -60.2pp
- All cycles
- 2024: R+60.2 2020: R+56.6 2016: R+58.5 2012: R+51.6 2008: R+43.1
Not yet ingested
- Civics
- —
Market trends
- HPI YoY
- ▼ -8.08%
- Current HPI
- 297.6233
- Rent YoY
- —
- Metro
- —
- State GDP YoY
- ▲ 1.81%
- F500 in state
- 4
Industry mix (Fortune 500 HQ in KY)
| Industry | F500 HQs | Revenue |
|---|---|---|
| Healthcare | 1 | $118B |
|
||
| Food / Beverage | 1 | $7B |
|
||
Price history
-20.6% since first listed2 events — show timeline
- 2026-05-18 Price Changed $119,000 ImagineMLS
- 2026-04-05 Listed $149,900 ImagineMLS
Property tax history
+1.0%/yrLatest (2025): $900 · +5.8% YoY. Source: county tax records.
Cash-flow waterfall
monthlySold comps — $/sqft
last 12 mo · ≤1 miLoading sold comps…