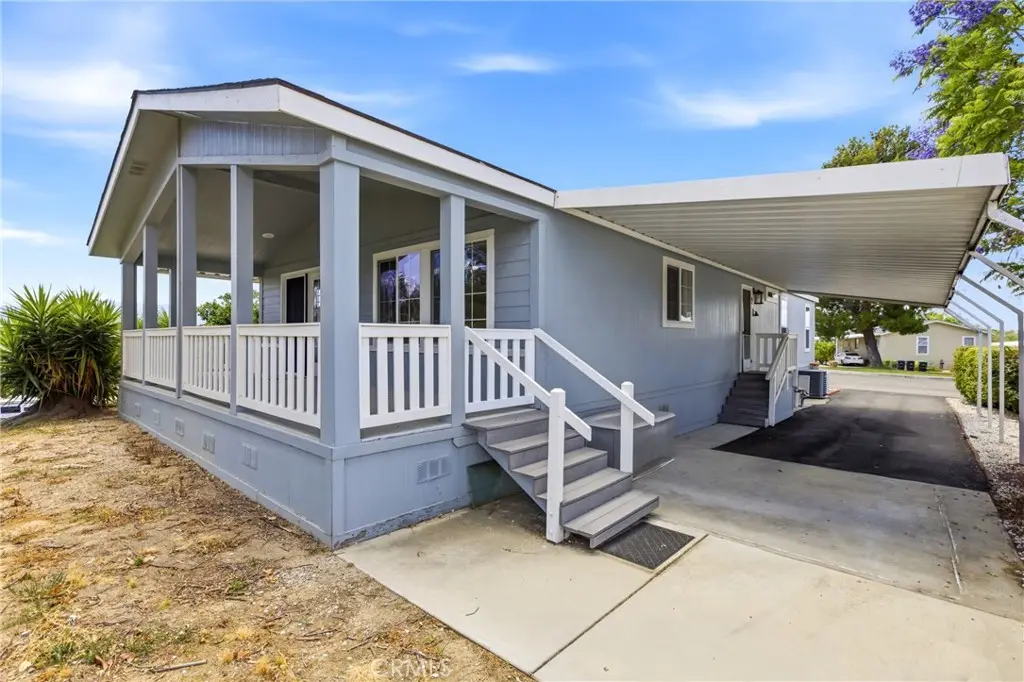
31330 S General Kearny · Temecula, CA
Flood risk 1/10 · Minimal
- FEMA flood zone
- X (unshaded)
- Chance of flooding over 30 yrs
- 0.0%
- Est. flood insurance / yr
- $507 – $1,088
Fire risk 6/10 · Moderate
- Est. fire insurance / yr
- $659 – $1,223
Heat risk 7/10 · Major
- Hot days now (above 100°F)
- 7 days/yr
- Hot days in 30 yrs
- 21 days/yr
Wind risk 1/10 · Minimal
- Chance of severe wind over 30 yrs
- —
Air-quality risk 6/10 · Moderate
- Unhealthy air days now
- 10 days/yr
- Unhealthy air days in 30 yrs
- 12 days/yr
Risk factors via First Street. Map © Google.
Why this score? — see what drove the C grade
The composite is a weighted blend of 9 inputs, each scored 0–100. Each bar is that input's sub-score; the figure is the points it added to the 100-point composite (weight × sub-score).
- Cash flow +27.3/30.0
- DSCR +9.5/10.0
- 1% rule +6.1/10.0
- Schools +5.7/10.0
- Livability +3.6/5.0
- Rent growth +2.9/5.0
- Condition / age +2.5/5.0
- ARV discount +0.0/15.0
- Appreciation +0.0/10.0
$289,900
🖨 Deal sheet 📄 Offer letter ✓ Due diligence
Listing remarks
Move-in ready 3-bedroom, 2-bath home located in Temecula’s desirable 55+ Heritage Estates community. Built in 2008, this 1,728 sq. ft. home sits on an oversized pie-shaped lot near the back of the park, offering added privacy and beautiful sunset views of Temecula Valley wine country and the nearby golf course. Open floor plan with spacious primary suite featuring soaking tub, walk-in shower, and ample closet space. Third bedroom currently used as a den/office. Enjoy abundant storage, a custom 10’x12’ shed, two mature orange trees, and a newer energy-efficient tankless water heater. Relax on the full-length back porch and enjoy resort-style amenities including clubhouse, p
Key facts
- Mature orange trees
- Sunset views
- Custom shed
Tags
Property features AI
Finance
- Other: Pets allowed with number limits
- Financial info: Land lease amount applies
- HOA & community: Senior community; Association amenities include pool, spa, clubhouse, common RV parking, pet rules and pets permitted; Street lighting in the community; Park name: Heritage Estates; Manager approval required for occupancy; Land lease applies
Exterior
- Parking: Covered parking; Driveway-level parking; Two parking spaces; Two carport spaces
- Utilities: Public sewer; District/public water; Natural gas connected; Sewer connected; Electricity connected; Water connected
- Home design: Single-story property; Mobile home remains on site (24 x 72); Has a view
- Construction: Composition roof; Pier jacks foundation
- Exterior features: Covered rear porch; Covered porch; Patio; Wood fencing; Shed on the property; Pool available through the association; Cul-de-sac location; Greenbelt view/adjacent greenbelt
Interior
- Kitchen: Microwave; Gas range and gas oven; Tankless water heater
- Bedrooms: All bedrooms located on the main level
- Bathrooms: Two full bathrooms; Separate tub and shower in at least one bath; Shower
- Heating & cooling: Central cooling; Central furnace heating
- Interior features: One-level home; All bedrooms on the same level; Association spa
- Laundry & utility: Inside laundry in a dedicated room; Washer included; Dryer included
Neighborhood map
What this means for you Summary
Snapshot
- This is a 3-bed/2.0-bath manufactured listed at $290k.
Deal economics
- At list price, monthly cash flow is $837 ($10k/yr) — positive.
- The deal already cash-flows at list — no discount required.
- Meets the 1% rule at list price ($3k rent vs $290k).
- Recommended offer: $286k (1.5% below list) — sets the bar for market timing.
- Cap rate 9.8% vs local median 2.6% in Temecula — top-decile yield for the area; either an underpriced asset or a hidden risk that comps aren't pricing in. Stress-test before assuming the spread holds.
Location & tenants
- Location reads 71/100 on livability (#225 in CA) — a middle-class / working-renter tenant base. Strengths: employment A+, housing A+, crime B+; Watch: cost of living F, health & safety F.
- Temecula Valley Unified (urban): math 55% / reading 69% proficiency, ranked #173 of 1,400 in CA (top 12%) — acceptable for families but not a draw, mixed tenant base, ~2y average lease; only 17% free/reduced lunch — higher-income household profile.
- Market conditions: Rents rising (+1.6%/yr); 218 active listings in the ZIP; 12 comparable units currently listed for rent nearby; rentals at typical pace (median 25d on market — plan ~3-4 weeks tenant-placement turnaround); high-income renter base; 9,195 units permitted in Riverside County in 2024 (1,512 in 5+ unit buildings).
- This rent runs 34% of the median local income ($114k/yr) — at the standard rent-burdened threshold; future hikes will face affordability resistance.
Forward outlook
- Local home prices are declining (-3.0%/yr); year-one equity from $2k of loan paydown is wiped out by about $9k of value loss. Plan a longer hold.
- Riverside County population projected at +22% by 2050 — long-run rental-demand tailwind backs the buy-and-hold thesis.
Negotiation context
- It's been on market 20 days — a 2% lower offer ($286k) is reasonable based on typical stale-listing flexibility.
Risks & watch-outs
- Climate carrying-cost: major wildfire risk; extreme-heat days projected 7→21/yr by 2055 (HVAC capex compounding) — expect insurance premiums to compound above CPI over the hold.
Questions for the listing agent
- Is there a deadline driving the sale (1031 exchange, divorce, estate, relocation)? That informs how much negotiation room exists.
- Schools are B-rated — typically a magnet for longer-tenancy family renters. What's the average tenant stay here, and is there a school-zone premium baked into asking?
- What's the average days-on-market for RENTAL listings here right now (not sales)? A rising rental-DOM trend means longer vacancies and softer asking-rent achievability than the comps imply.
- What's the recent tenant-quality profile in this submarket — average credit score on applications, eviction rate, late-payment / NSF rate, and stable-employment percentage? A property-management company in the area should have these aggregated.
- How much new for-sale + rental construction is in the pipeline within 1–3 miles? Heavy new supply typically softens prices + rents 12–24 months out; constrained supply supports both.
Investment metrics
- 1% rule
- 1.11% ✓
- Cap rate
- 9.76%
- Cash-on-cash
- 12.37%
- DSCR
- 1.55
- GRM
- 7.5
CMA / ARV
- ARV (on-the-fly)
- $224,640
- Comps found
- 3
Show comp detail 3 sales within ~0.75 mi
| Address | Dist | Beds/Ba | Sqft | Sold | Price | $/sf | Match |
|---|---|---|---|---|---|---|---|
| 31130 S General Kearny Rd #37 | 0.09mi | 3/2.0 | 1,728 (0%) | 11mo | $360,000 | $208 | 86 |
| 31130 South General Kearny Rd #49 | 0.09mi | 2/2.0 (-1) | 1,920 (+11%) | 22mo | $249,900 | $130 | 54 |
| 31130 S General Kearny Rd #144 | 0.09mi | 2/2.0 (-1) | 1,488 (-14%) | 20mo | $132,500 | $89 | 51 |
Match score weights: distance 35% · size 25% · config 20% · recency 20%. Top-matched comps best support the ARV.
Projected returns pro-forma
-3.0% appreciation · 1.57% rent growth · sell at horizon
- IRR
- 0.5%
- Equity multiple
- 1.02×
- Total profit
- $1,599
- Equity at exit
- $43,225
- IRR
- 8.8%
- Equity multiple
- 1.63×
- Total profit
- $51,214
- Equity at exit
- $25,065
Cash invested: $81,172 (down + closing). Projections, not guarantees.
Landlord ↔ Tenant lean methodology
- Overall (STATE)
- 18 Strongly Tenant-Friendly
- State California
- 18 Strongly Tenant-Friendly · D+13
- County
- — inherits STATE
- City
- — inherits STATE
ZIP-level market 92591
- Home prices YoY
- -24.8%
- Rents YoY
- 1.6%
- Active inventory
- 218
- Price-to-rent
- 7.5×
Monthly cashflow live
- Estimated rent
- $3,230 high interval (Pro) →
- Mortgage (P&I)
- −$1,520
- Tax from tax record
- −$74 /mo · $890/yr
- Insurance
- −$121
- HOA
- −$0
- Vacancy / Maint / Mgmt
- −$678
- Net cashflow
- $837
Break-even live
UW: 25.0% down · 7.5% · 30yr · 1.5% tax · 5.0% vac · 8.0% maint · 8.0% mgmt
Financing live
Cash to close
- Down payment
- $72,475
- Closing costs
- $8,697
- Reserves months
- —
- Total cash needed
- —
Loan-product check · same deal, 3 products live
Conventional
25% down · 7.5% · 30yr
- Down + closing
- —
- Monthly P&I
- —
- Monthly cashflow
- —
- DSCR
- —
- Eligible?
- —
Personal DTI + credit; lowest rate.
DSCR
20% down · 8.5% · 30yr
- Down + closing
- —
- Monthly P&I
- —
- Monthly cashflow
- —
- DSCR
- —
- Eligible?
- —
No personal income docs; deal must DSCR.
Hard money
10% down · 12.0% · 12mo
- Down + closing
- —
- Monthly P&I
- —
- Monthly cashflow
- —
- DSCR
- —
- Eligible?
- —
Short-term bridge; refi at stabilization.
Rent comps 12 comps
| Address | Beds | Baths | Sqft | Rent | $/sqft | DOM | Units | Dist |
|---|---|---|---|---|---|---|---|---|
| 30900 Branford Dr Temecula, CA | 3.0 | 2.0 | 1689 | $3,000 | $1.78 | 43d | 1 | 0.17mi |
| 41929 Humber Dr Temecula, CA | 4.0 | 2.5 | 1697 | $3,075 | $1.81 | 11d | 1 | 0.51mi |
| 42093 Acacia Way Temecula, CA | 3.0 | 2.5 | 1442 | $2,750 | $1.91 | 24d | 1 | 0.93mi |
| 30000 Rancho California Rd Temecula, CA | 1.0–3.0 | 1.0–2.0 | 1002 | $2,870 | $2.86 | 43d | 1 | 0.99mi |
| 42180 Calabria Dr Temecula, CA | 3.0 | 2.5 | 2060 | $3,200 | $1.55 | 4d | 1 | 0.99mi |
| 31989 Corte Soledad Temecula, CA | 4.0 | 2.5 | 1825 | $3,650 | $2.00 | 24d | 1 | 1.10mi |
| 30135 Rancho California Rd Temecula, CA | 1.0–3.0 | 1.0–2.0 | 962 | $3,600 | $3.74 | 43d | 1 | 1.11mi |
| 41955 Margarita Rd Temecula, CA | 1.0–2.0 | 1.0–2.0 | 930 | $2,664 | $2.86 | 2d | 14 | 1.12mi |
| 42720 Azure St Temecula, CA | 3.0 | 2.5 | 1974 | $5,500 | $2.79 | 24d | 1 | 1.41mi |
| 42752 Azure St Temecula, CA | 3.0 | 2.5 | 1564 | $3,095 | $1.98 | 43d | 1 | 1.41mi |
| 42744 Azure St Temecula, CA | 4.0 | 3.0 | 2014 | $3,250 | $1.61 | 12d | 1 | 1.41mi |
| 43097 Corte Cabrera Temecula, CA | 3.0 | 2.0 | 1069 | $2,925 | $2.74 | 15d | 1 | 1.41mi |
Listing history 13 events
-
2026-06-18days on market $289,900 Active 20 DOM
-
2026-06-17days on market $289,900 Active 19 DOM
-
2026-06-16days on market $289,900 Active 18 DOM
-
2026-06-15days on market $289,900 Active 17 DOM
-
2026-06-13days on market $289,900 Active 15 DOM
-
2026-06-09days on market $289,900 Active 11 DOM
-
2026-06-08days on market $289,900 Active 10 DOM
-
2026-06-07days on market $289,900 Active 9 DOM
-
2026-06-04days on market $289,900 Active 6 DOM
-
2026-06-03days on market $289,900 Active 5 DOM
-
2026-06-02days on market $289,900 Active 4 DOM
-
2026-06-01days on market $289,900 Active 3 DOM
-
2026-05-31days on market $289,900 Active 2 DOM
ⓘ Source: listings_history table (triggers on properties + properties_extension) + one-shot
backfill from property_details.listing_events for pre-trigger history.
Tax reassessment forecast CA · Resets to sale price
- Current annual tax
- $890 · $74/mo
- Projected year-2 tax
- $2,203 · $184/mo
- Expected delta
- +$1,313/yr (+$109/mo · 147.5%)
ⓘ Screening estimate from a state-policy table — verify with the county assessor before closing.
Climate risk First Street
- Flood 1/10 Low FEMA zone X (unshaded) · 0% chance over 30 yrs
- Wildfire 6/10 Major
- Heat 7/10 Severe 7 d/yr ≥100°F today · 21 d/yr by 30 yrs out
- Wind 1/10 Low
- Air quality 6/10 Major 10 unhealthy d/yr today · 12 by 30 yrs out
Nearby sold comps map
Loading sold comps map…
Walkable amenities ~0.75 mi
Loading nearby amenities…
Taxation est. · year 1
- Rental income
- $38,763
- − Mortgage interest
- −$16,239
- − Property taxes
- −$890
- − Insurance
- −$1,450
- − Repairs & maintenance
- −$3,101
- − Management
- −$3,101
- − Depreciation
- −$8,433
- Taxable income
- $5,549
- Est. tax owed @ 24.0%
- −$1,332
- After-tax cash flow
- $8,708/yr
For passive investors: Depreciation is non-cash, so a rental often shows a tax loss while cash-flowing — sheltering income. Rental losses are passive: they offset passive income freely, and up to $25,000/yr can offset ordinary (W-2) income if you actively participate and your MAGI is under $100k (phasing out to $0 by $150k); unused losses carry forward. On sale, claimed depreciation is recaptured at up to 25%, and gains may owe capital-gains tax (a 1031 exchange can defer both). Figures are a year-1 estimate at your 24.0% rate — not tax advice; consult a CPA.
Schools (NCES district)
- District
- Temecula Valley Unified
- NCES district ID
- 0600028
- Math proficiency
- 55% ▲ 1.00%
- Reading proficiency
- 69% ▲ 1.00%
- Median HH income
- $84,032
- Composite
- 57.48/100
- National rank
- #2264
- State rank
- #173 of 1400 in CA
Livability — Temecula
- Score
- 71/100
- State rank
- #225
- US rank
- #7291
Category grades
Schools grade is shown separately in the Schools card above.
Census & demographics
- Census place
- Temecula, CA
- County
- Riverside County · 2,287,001 people
- City population
- 127,079
- Metro
- Riverside-San Bernardino-Ontario, CA
- Population (ZIP)
- 41,955
- Household income
- $114,160
- Rent vs Own
- Severe rent burden
- 1497.0
Population outlook (Riverside County) Hauer SSP2
- Today (2025)
- 2,664,475 people
- By 2030
- 2,802,692 · +5.2%
- By 2040
- 3,050,904 · +14.5%
- By 2050
- 3,256,783 · +22.2%
- By 2075
- 3,655,058 · +37.2%
- By 2100
- 3,766,594 · +41.4%
Race, ethnicity, and origin ACS 2023
- Neighborhood character
- Diverse neighborhood (Simpson 0.66)
- Race & ethnicity
- White 50% Hispanic / Latino 30% Two or more races 17% Asian 10% Black 4%
- Hispanic origin (detail)
- Mexican 21%
- Common ancestry
- Italian 3% Slovak 3% Scotch-Irish 2%
- Foreign-born
- 19% · Canada, China, Vietnam
- Languages at home
- 71% English-only · Spanish 17% Tagalog/Filipino 3% Other Indo-European 2%
Political lean MEDSL · Riverside
- 2024 margin
- Toss-up / Even · D 48.0% · R 49.3% · Other 2.6%
- 2008→2024 swing
- -3.6pp toward R · 2008: 2.3pp · 2024: -1.3pp
- All cycles
- 2024: R+1.3 2020: D+8.0 2016: D+4.3 2012: R+0.4 2008: D+2.3
Not yet ingested
- Civics
- —
Market trends
- HPI YoY
- ▼ -115.45%
- Current HPI
- 350.5314
- Rent YoY
- ▲ 1.57%
- Metro
- Riverside-San Bernardino-Ontario, CA
- State GDP YoY
- ▲ 3.21%
- F500 in state
- 116
Industry mix (Fortune 500 HQ in CA)
| Industry | F500 HQs | Revenue |
|---|---|---|
| Technology | 27 | $1,492B |
|
||
| Financial Services | 3 | $174B |
|
||
| Retail | 3 | $44B |
|
||
| Insurance | 3 | $26B |
|
||
| Media / Entertainment | 2 | $115B |
|
||
| Pharmaceuticals / Biotech | 2 | $62B |
|
||
Price history
1 event — show timeline
- 2026-05-29 Listed $289,900 CRMLS
Property tax history
+0.5%/yrLatest (2025): $890 · +1.6% YoY. Source: county tax records.
Cash-flow waterfall
monthlySold comps — $/sqft
last 12 mo · ≤1 miLoading sold comps…