 Multi-family
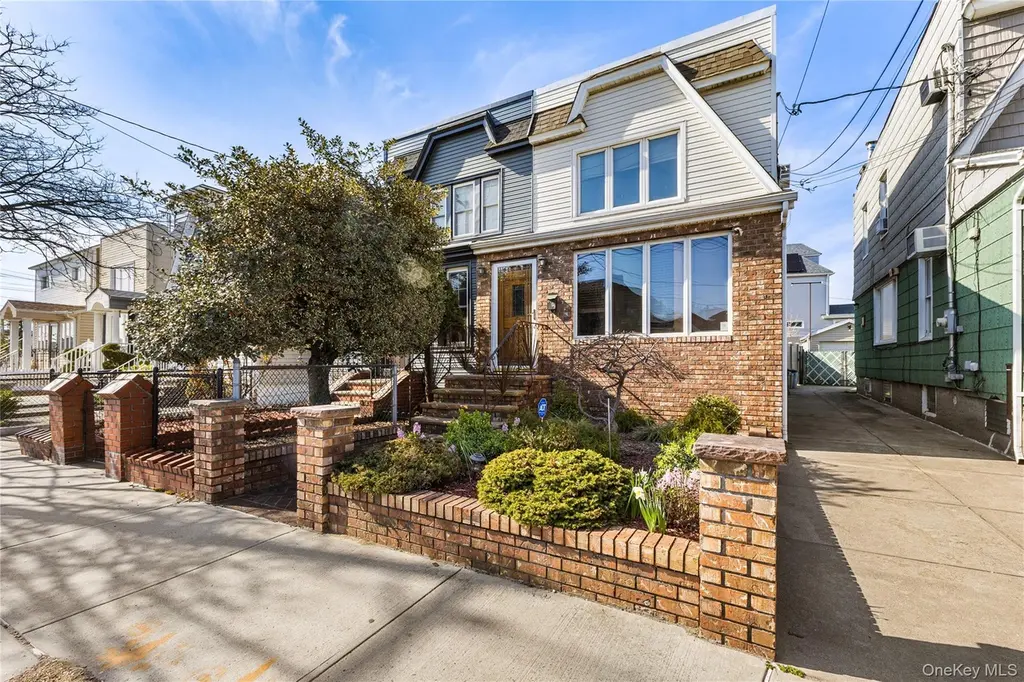
9409 Linden Blvd · New York, NY
Flood risk 1/10 · Minimal
- FEMA flood zone
- X (unshaded)
- Chance of flooding over 30 yrs
- 0.0%
- Est. flood insurance / yr
- $507 – $1,088
Fire risk 1/10 · Minimal
- Est. fire insurance / yr
- $691 – $1,283
Heat risk 7/10 · Major
- Hot days now (above 98°F)
- 7 days/yr
- Hot days in 30 yrs
- 15 days/yr
Wind risk 6/10 · Moderate
- Chance of severe wind over 30 yrs
- 65.0%
Air-quality risk 4/10 · Minor
- Unhealthy air days now
- 6 days/yr
- Unhealthy air days in 30 yrs
- 6 days/yr
Risk factors via First Street. Map © Google.
Why this score? — see what drove the D- grade
The composite is a weighted blend of 9 inputs, each scored 0–100. Each bar is that input's sub-score; the figure is the points it added to the 100-point composite (weight × sub-score).
- ARV discount +15.0/15.0
- Cash flow +6.1/30.0
- Schools +5.0/10.0
- Livability +3.8/5.0
- Rent growth +2.5/5.0
- Condition / age +2.5/5.0
- 1% rule +0.8/10.0
- DSCR +0.4/10.0
- Appreciation +0.0/10.0
$600,000
🖨 Deal sheet (PDF) 📄 Offer letter ✓ Due diligence
Multi-family units
County records classify this as Multi-Family (2-4 Unit). Listing-text estimate: 1 unit. estimate disagrees with records
Listing remarks
Legal two-family home situated on Linden Boulevard in Ozone Park. Built in 1925 on a 0.05-acre lot with approximately 1,183 square feet of living space. The property features 3 bedrooms and 3 bathrooms across two floors, with a basement and backyard. Currently configured and occupied as a single-family residence. Property is being sold as-is. Subject to bank approval of short sale. Buyer to verify all information independently. Proof of funds or pre-approval required with all offers.
Key facts
- 1,980 sq ft lot
- Built 1925
- Listed 68 days
Property features AI
Exterior
- Parking: Shared driveway
- Utilities: Public sewer; Cable connected; Electricity connected; Natural gas connected
- Home design: Duplex; Total building area approximately 1183
- Construction: Frame construction
- Exterior features: Frame construction; Not waterfront
Interior
- Bedrooms: One 3-bedroom unit
- Bathrooms: 3 full bathrooms
- Heating & cooling: Natural gas heating; Wall/window air conditioning units
- Interior features: Entrance foyer; Finished basement
Neighborhood map
What this means for you Summary
Snapshot
- This is a 3-bed/3.0-bath multifamily listed at $600k.
Deal economics
- At list price, monthly cash flow is $-1k ($-13k/yr) — negative.
- To cash-flow at today's rent, offer at most $402k (33.0% below list).
- To meet the 1% rule (rent ≥ 1% of price), the offer needs to be $348k (42.0% below list).
- Recommended offer: $348k (42.0% below list) — sets the bar for 1% rule.
- Cap rate 4.1% vs local median 2.6% in New York — top-decile yield for the area; either an underpriced asset or a hidden risk that comps aren't pricing in. Stress-test before assuming the spread holds.
Location & tenants
- Location reads 75/100 on livability (#268 in NY, #4,188 nationally) — a middle-class / working-renter tenant base. Strengths: amenities A+, commute A+, health & safety A; Watch: crime F, cost of living F.
- Zoned schools: Ps 63 Old South (math 47% / reading 62%, grade C, #908 of 2,108 statewide, top 46%, 1,016 students, 79% FRL); Is 227 Louis Armstrong (math 52% / reading 69%, grade B+, #153 of 729 statewide, top 21%, 1,528 students, 68% FRL); Midwood High School (math 94% / reading 96%, grade A+, #83 of 1,100 statewide, top 8%, 4,062 students, 73% FRL).
- Market conditions: 116 active listings in the ZIP; 15 comparable units currently listed for rent nearby; rentals at typical pace (median 26d on market — plan ~3-4 weeks tenant-placement turnaround); solid renter incomes; 5,302 units permitted in Queens County in 2024 (4,918 in 5+ unit buildings).
- At $3,481/mo this rent would consume 48% of the median local household income ($87k/yr) (locally 1206% of renters already pay >50% of income on rent) — very limited rent-growth headroom before tenants either downsize or default.
Forward outlook
- Local home prices are declining (-3.0%/yr); year-one equity from $4k of loan paydown is wiped out by about $18k of value loss. Plan a longer hold.
- Queens County population projected at +16% by 2050 — long-run rental-demand tailwind backs the buy-and-hold thesis.
Negotiation context
- It's been on market 68 days — a 6% lower offer ($564k) is reasonable based on typical stale-listing flexibility.
- Current owner paid $165k; list at $600k implies a 264% gain — meaningful room to come down on a strong offer.
Risks & watch-outs
- Watch-outs: built in 1925 — expect roof / HVAC / electrical / plumbing capex.
- Climate carrying-cost: major wind risk, 65% chance of damaging wind over 30y; extreme-heat days projected 7→15/yr by 2055 (HVAC capex compounding) — expect insurance premiums to compound above CPI over the hold.
Questions for the listing agent
- What do current leases actually rent for vs. the listed asking? Can we see a recent rent roll and the last 12 months of T-12 income?
- It's been on market 68 days. Have you received any prior offers? Is the seller open to a 42% concession, seller financing, or rate buy-down credit?
- Built in 1925 — when were the roof, HVAC, electrical panel, plumbing, and water heater last replaced?
- Why hasn't it sold? Are there any deal-killer items the seller is aware of (foundation, flood, title, zoning, code violations)?
- Is there a deadline driving the sale (1031 exchange, divorce, estate, relocation)? That informs how much negotiation room exists.
- Schools are B-rated — typically a magnet for longer-tenancy family renters. What's the average tenant stay here, and is there a school-zone premium baked into asking?
- Crime grade is F in this area — have there been break-ins, vandalism, or insurance claims at this property in the last 3 years? What carrier currently insures it and at what premium?
- The area grade is low — what's the realistic commute time and amenity access for the typical tenant pool here? Any planned neighborhood developments (good or bad) we should know about?
- What's the average days-on-market for RENTAL listings here right now (not sales)? A rising rental-DOM trend means longer vacancies and softer asking-rent achievability than the comps imply.
- What's the recent tenant-quality profile in this submarket — average credit score on applications, eviction rate, late-payment / NSF rate, and stable-employment percentage? A property-management company in the area should have these aggregated.
- How much new apartment / multifamily construction is in the pipeline within 1–3 miles? Heavy new supply (>2% of stock underway) typically softens rents 12–24 months out; light construction supports rent growth.
Investment metrics
- 1% rule
- 0.58% ✗
- Cap rate
- 4.05%
- Cash-on-cash
- -8.00%
- DSCR
- 0.64
- GRM
- 14.4
CMA / ARV
- ARV (on-the-fly)
- $860,041
- Comps found
- 3
Show comp detail 3 sales within ~0.75 mi
| Address | Dist | Beds/Ba | Sqft | Sold | Price | $/sf | Match |
|---|---|---|---|---|---|---|---|
| 91-25 Gold Rd | 0.13mi | 2/— (-1) | 1,184 (+0%) | 2mo | $845,000 | $714 | 87 |
| 107-62 93rd St | 0.24mi | 3/2.0 | 1,059 (-10%) | 2mo | $770,000 | $727 | 66 |
| 10808 86 St | 0.52mi | 3/2.0 | 1,056 (-11%) | 9mo | $830,000 | $786 | 46 |
Match score weights: distance 35% · size 25% · config 20% · recency 20%. Top-matched comps best support the ARV.
Projected returns pro-forma
-3.0% appreciation · 3.0% rent growth · sell at horizon
- IRR
- -30.4%
- Equity multiple
- -0.00×
- Total profit
- $-168,648
- Equity at exit
- $89,462
- IRR
- -32.5%
- Equity multiple
- -0.42×
- Total profit
- $-239,151
- Equity at exit
- $51,877
Cash invested: $168,000 (down + closing). Projections, not guarantees.
Landlord ↔ Tenant lean methodology
- Overall (CITY)
- 0 Strongly Tenant-Friendly
- State New York
- 15 Strongly Tenant-Friendly · D+10
- County
- — inherits STATE
- City New York
- 0 Strongly Tenant-Friendly · D+34
ZIP-level market 11417
- Active inventory
- 116
- Price-to-rent
- 14.4×
Monthly cashflow live
- Estimated rent
- $3,481 high interval (Pro) →
- Mortgage (P&I)
- −$3,146
- Tax from tax record
- −$473 /mo · $5,672/yr
- Insurance
- −$250
- HOA
- −$0
- Vacancy / Maint / Mgmt
- −$731
- Net cashflow
- $-1,120
Break-even live
Sensitivity live
| Price | -10% $-780 | -5% $-950 | +0% $-1,120 | +5% $-1,289 | +10% $-1,459 |
|---|---|---|---|---|---|
| Rent | -10% $-1,395 | -5% $-1,257 | +0% $-1,120 | +5% $-982 | +10% $-845 |
| Rate | -1.0pp $-817 | -0.5pp $-967 | base $-1,120 | +0.5pp $-1,275 | +1.0pp $-1,433 |
UW: 25.0% down · 7.5% · 30yr · 1.5% tax · 5.0% vac · 8.0% maint · 8.0% mgmt
Financing live
Cash to close
- Down payment
- $150,000
- Closing costs
- $18,000
- Reserves months
- —
- Total cash needed
- —
Loan-product check · same deal, 3 products live
Conventional
25% down · 7.5% · 30yr
- Down + closing
- —
- Monthly P&I
- —
- Monthly cashflow
- —
- DSCR
- —
- Eligible?
- —
Personal DTI + credit; lowest rate.
DSCR
20% down · 8.5% · 30yr
- Down + closing
- —
- Monthly P&I
- —
- Monthly cashflow
- —
- DSCR
- —
- Eligible?
- —
No personal income docs; deal must DSCR.
Hard money
10% down · 12.0% · 12mo
- Down + closing
- —
- Monthly P&I
- —
- Monthly cashflow
- —
- DSCR
- —
- Eligible?
- —
Short-term bridge; refi at stabilization.
Rent comps 15 comps
| Address | Beds | Baths | Sqft | Rent | $/sqft | DOM | Units | Dist |
|---|---|---|---|---|---|---|---|---|
| 9512 108th Ave Ozone Park, NY | 2.0 | 1.0 | 1000 | $2,800 | $2.80 | 13d | 1 | 0.30mi |
| 10929 103rd St Ozone Park, NY | 3.0 | 2.0 | 1200 | $3,400 | $2.83 | 22d | 1 | 0.43mi |
| 10541 90th St Ozone Park, NY | 3.0 | 2.0 | 1264 | $4,111 | $3.25 | 26d | 1 | 0.46mi |
| 149-09 84th St Unit 2 Howard Beach, NY | 3.0 | 1.5 | 750 | $3,200 | $4.27 | 26d | 1 | 0.57mi |
| 14912 83rd St Howard Beach, NY | 3.0 | 2.0 | 1250 | $3,200 | $2.56 | 26d | 1 | 0.65mi |
| 132-13 81st St #1 Jamaica, NY | 3.0 | 1.0 | 1280 | $4,100 | $3.20 | 4d | 1 | 0.69mi |
| 13214 81st St Ozone Park, NY | 3.0 | 1.0 | 1280 | $4,100 | $3.20 | 13d | 1 | 0.72mi |
| 155-69 99th St Unit 2nd Floor Jamaica, NY | 3.0 | 1.5 | 1500 | $3,200 | $2.13 | 22d | 1 | 0.78mi |
| 97-56 105th St #2 Ozone Park, NY | 3.0 | 2.0 | 1000 | $3,811 | $3.81 | 26d | 1 | 0.89mi |
| 156-49 76th St Unit 2 Jamaica, NY | 3.0 | 2.0 | 1250 | $3,300 | $2.64 | 18d | 1 | 1.20mi |
| 94-17 90th Ave Unit 2nd Floor Jamaica, NY | 3.0 | 2.0 | 1040 | $3,000 | $2.88 | 9d | 1 | 1.24mi |
| 88-23 85th St Unit 1L Jamaica, NY | 3.0 | 1.0 | 1000 | $3,300 | $3.30 | 26d | 1 | 1.39mi |
| 90-18 77th St Unit 2 Jamaica, NY | 3.0 | 1.0 | 913 | $3,295 | $3.61 | 26d | 1 | 1.46mi |
| 91-04 75th St Unit 2 Jamaica, NY | 3.0 | 1.0 | 800 | $3,700 | $4.62 | 26d | 1 | 1.47mi |
| 10215 Dunton Ct Howard Beach, NY | 3.0 | 2.0 | 1100 | $3,500 | $3.18 | 26d | 1 | 1.49mi |
Listing history 14 events
-
2026-06-21days on market $600,000 Active 68 DOM
-
2026-06-18days on market $600,000 Active 65 DOM
-
2026-06-17days on market $600,000 Active 64 DOM
-
2026-06-15days on market $600,000 Active 62 DOM
-
2026-06-13days on market $600,000 Active 60 DOM
-
2026-06-10days on market $600,000 Active 56 DOM
-
2026-06-08days on market $600,000 Active 55 DOM
-
2026-06-08days on market $600,000 Active 54 DOM
-
2026-06-04days on market $600,000 Active 51 DOM
-
2026-06-03days on market $600,000 Active 50 DOM
-
2026-06-01days on market $600,000 Active 48 DOM
-
2026-05-31days on market $600,000 Active 47 DOM
-
2026-04-11$600,000 Active
-
1988-05-23soldstatus $165,000
ⓘ Source: listings_history table (triggers on properties + properties_extension) + one-shot
backfill from property_details.listing_events for pre-trigger history.
Tax reassessment forecast NY · Partial reset (capped growth)
- Current annual tax
- $5,672 · $473/mo
- Projected year-2 tax
- $7,906 · $659/mo
- Expected delta
- +$2,234/yr (+$186/mo · 39.4%)
ⓘ Screening estimate from a state-policy table — verify with the county assessor before closing.
Climate risk First Street
- Flood 1/10 Low FEMA zone X (unshaded) · 0% chance over 30 yrs
- Wildfire 1/10 Low
- Heat 7/10 Severe 7 d/yr ≥98°F today · 15 d/yr by 30 yrs out
- Wind 6/10 Major 65% chance of damaging wind over 30 yrs
- Air quality 4/10 Moderate 6 unhealthy d/yr today · 6 by 30 yrs out
Nearby sold comps map
Loading sold comps map…
Walkable amenities ~0.75 mi
Loading nearby amenities…
Taxation est. · year 1
- Rental income
- $41,766
- − Mortgage interest
- −$33,609
- − Property taxes
- −$5,672
- − Insurance
- −$3,000
- − Repairs & maintenance
- −$3,341
- − Management
- −$3,341
- − Depreciation
- −$17,455
- Taxable loss
- −$24,653
- Est. tax savings @ 24.0%
- +$5,917
- After-tax cash flow
- $-7,518/yr
For passive investors: Depreciation is non-cash, so a rental often shows a tax loss while cash-flowing — sheltering income. Rental losses are passive: they offset passive income freely, and up to $25,000/yr can offset ordinary (W-2) income if you actively participate and your MAGI is under $100k (phasing out to $0 by $150k); unused losses carry forward. On sale, claimed depreciation is recaptured at up to 25%, and gains may owe capital-gains tax (a 1031 exchange can defer both). Figures are a year-1 estimate at your 24.0% rate — not tax advice; consult a CPA.
Schools (NCES district)
No district data.
Livability — New York
- Score
- 75/100
- State rank
- #268
- US rank
- #4188
Category grades
Schools grade is shown separately in the Schools card above.
Census & demographics
- Census place
- New York, NY
- County
- Queens County · 1,914,869 people
- City population
- 7,731,280
- Metro
- New York-Newark-Jersey City, NY-NJ-PA
- Population (ZIP)
- 30,578
- Household income
- $87,006
- Rent vs Own
- Severe rent burden
- 1206.0
Population outlook (Queens County) Hauer SSP2
- Today (2025)
- 2,546,320 people
- By 2030
- 2,643,059 · +3.8%
- By 2040
- 2,815,563 · +10.6%
- By 2050
- 2,944,423 · +15.6%
- By 2075
- 3,123,338 · +22.7%
- By 2100
- 3,098,688 · +21.7%
Race, ethnicity, and origin ACS 2023
- Neighborhood character
- Highly diverse neighborhood (Simpson 0.74)
- Race & ethnicity
- Hispanic / Latino 37% Asian 29% White 17% Two or more races 16% Black 6% Native American 2%
- Hispanic origin (detail)
- Mexican 4% Puerto Rican 10% Dominican 10%
- Common ancestry
- Romanian 1%
- Foreign-born
- 44% · Canada, China, Jamaica
- Languages at home
- 46% English-only · Spanish 28% Other Indo-European 16% Chinese 4%
Political lean MEDSL · Queens
- 2024 margin
- Strong D (+24.6) · D 62.3% · R 37.7%
- 2008→2024 swing
- -26.2pp toward R · 2008: 50.8pp · 2024: 24.6pp
- All cycles
- 2024: D+24.6 2020: D+45.2 2016: D+53.4 2012: D+58.5 2008: D+50.8
Not yet ingested
- Civics
- —
Market trends
- HPI YoY
- ▼ -407.81%
- Current HPI
- 307.7585
- Rent YoY
- —
- Metro
- New York-Newark-Jersey City, NY-NJ-PA
- State GDP YoY
- ▲ 2.60%
- F500 in state
- 92
Industry mix (Fortune 500 HQ in NY)
| Industry | F500 HQs | Revenue |
|---|---|---|
| Financial Services | 10 | $950B |
|
||
| Consumer Goods | 9 | $162B |
|
||
| Insurance | 4 | $225B |
|
||
| Telecommunications | 2 | $144B |
|
||
| Pharmaceuticals | 2 | $112B |
|
||
| Media / Entertainment | 2 | $69B |
|
||
Price history
+263.6% since first listed2 events — show timeline
- 2026-04-11 Listed $600,000 OneKey® MLS as Distributed by MLS Grid
- 1988-05-23 Sold (Public Records) $165,000 Public Records
Property tax history
+6.1%/yrLatest (2025): $5,672 · +3.4% YoY. Source: county tax records.
Cash-flow waterfall
monthlySold comps — $/sqft
last 12 mo · ≤1 miLoading sold comps…