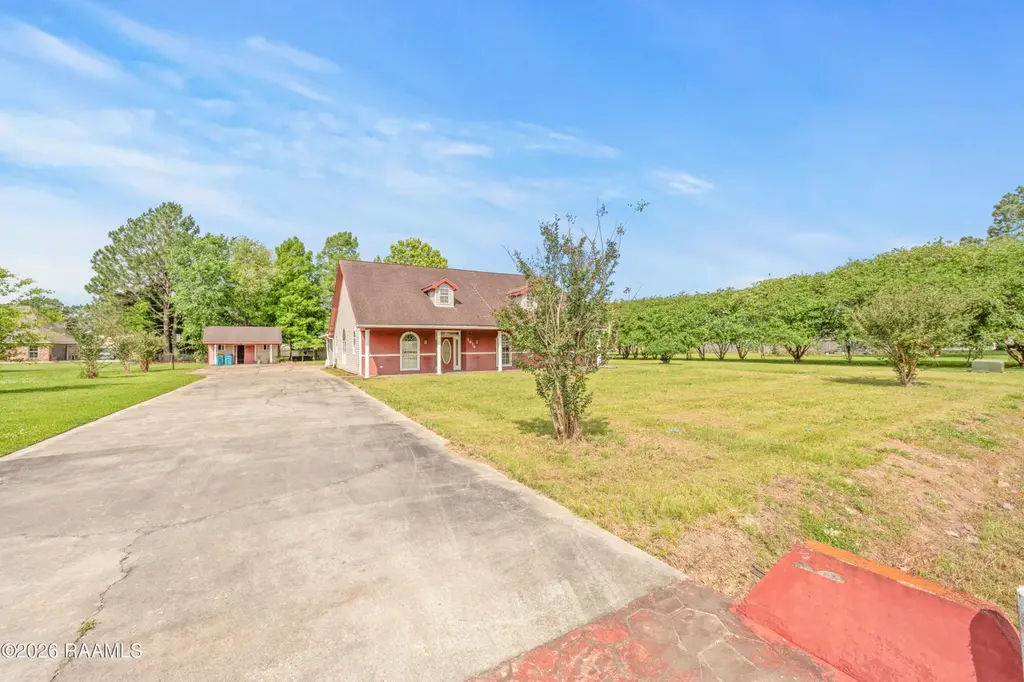
1014 Sugarland Dr · Breaux Bridge, LA
Flood risk 1/10 · Minimal
- FEMA flood zone
- X
- Chance of flooding over 30 yrs
- 0.0%
- Est. flood insurance / yr
- $507 – $1,088
Fire risk 1/10 · Minimal
- Est. fire insurance / yr
- $1,269 – $2,357
Heat risk 8/10 · Major
- Hot days now (above 109°F)
- 7 days/yr
- Hot days in 30 yrs
- 20 days/yr
Wind risk 9/10 · Severe
- Chance of severe wind over 30 yrs
- 99.0%
Air-quality risk 2/10 · Minimal
- Unhealthy air days now
- 1 days/yr
- Unhealthy air days in 30 yrs
- 1 days/yr
Risk factors via First Street. Map © Google.
Why this score? — see what drove the B- grade
The composite is a weighted blend of 9 inputs, each scored 0–100. Each bar is that input's sub-score; the figure is the points it added to the 100-point composite (weight × sub-score).
- Cash flow +25.1/30.0
- ARV discount +15.0/15.0
- DSCR +8.2/10.0
- 1% rule +6.8/10.0
- Livability +3.1/5.0
- Rent growth +2.5/5.0
- Condition / age +2.5/5.0
- Schools +2.3/10.0
- Appreciation +0.0/10.0
$120,000
🖨 Deal sheet 📄 Offer letter ✓ Due diligence
Listing remarks
Fixer upper on over half an acre in Breaux Bridge! No flood insurance required. This home is in need of some TLC but has a ton of potential. Real wood floors and vaulted tongue and groove ceilings in the living room. There is also an attached MIL suite with a full bathroom not included in the square footage. Don't wait, make your appointment today!
Key facts
- Over half an acre
- Attached mil suite
- Full bathroom
Tags
Property features AI
Exterior
- Parking: Carport for 2 vehicles; 2 covered parking spaces (total 2 spaces)
- Utilities: Septic tank; Electric service: SLEMCO
- Home design: Single family residence; Fixer
- Construction: Stucco, vinyl siding and frame construction
- Exterior features: Covered porch; Guest house; Shed(s); Acreage
Interior
- Kitchen: Dishwasher; Electric cooktop; Electric stove
- Flooring: Wood
- Bathrooms: 2 full bathrooms
- Heating & cooling: Central heating; Central air conditioning
- Interior features: Formica counters; Wood flooring
- Laundry & utility: Washer hookup; Electric dryer hookup
Neighborhood map
What this means for you Summary
Snapshot
- This is a 3-bed/2.0-bath single-family listed at $120k.
Deal economics
- At list price, monthly cash flow is $265 ($3k/yr) — positive.
- The deal already cash-flows at list — no discount required.
- Meets the 1% rule at list price ($1k rent vs $120k).
- Cap rate 8.9% vs local median 3.4% in Breaux Bridge — top-decile yield for the area; either an underpriced asset or a hidden risk that comps aren't pricing in. Stress-test before assuming the spread holds.
Location & tenants
- Location reads 62/100 on livability (#210 in LA) — a middle-class / working-renter tenant base. Strengths: cost of living A+, health & safety B+; Watch: crime F, amenities F, commute F.
- St. Martin Parish (rural): math 23% / reading 32% proficiency, ranked #49 of 98 in LA (top 50%) — low school quality limits family demand, transient renter base, plan for 1-2y turnover; 68% free/reduced lunch — lower-income household profile, screen leases tightly.
- Zoned schools: Breaux Bridge Primary School (571 students, 80% FRL); Breaux Bridge Junior High School (math 12% / reading 22%, grade F, #174 of 218 statewide, top 81%, 397 students, 76% FRL); Breaux Bridge High School (math 22% / reading 27%, grade F, #153 of 265 statewide, top 62%, 851 students, 62% FRL) — zoned schools at 73% FRL track the district average.
- Market conditions: 276 active listings in the ZIP; 54 units permitted in St. Martin Parish in 2024 (0 in 5+ unit buildings).
Forward outlook
- Local home prices are declining (-3.0%/yr); year-one equity from $830 of loan paydown is wiped out by about $4k of value loss. Plan a longer hold.
- St. Martin County population projected at +7% by 2050 — modest demand growth; plan on rents tracking national, not racing it.
Negotiation context
- Only 3 days on market — expect competitive offers; lowballing is unlikely to land.
Risks & watch-outs
- Climate carrying-cost: severe wind risk, 99% chance of damaging wind over 30y; extreme-heat days projected 7→20/yr by 2055 (HVAC capex compounding) — expect insurance premiums to compound above CPI over the hold.
Questions for the listing agent
- Is there a deadline driving the sale (1031 exchange, divorce, estate, relocation)? That informs how much negotiation room exists.
- Crime grade is F in this area — have there been break-ins, vandalism, or insurance claims at this property in the last 3 years? What carrier currently insures it and at what premium?
- What's the average days-on-market for RENTAL listings here right now (not sales)? A rising rental-DOM trend means longer vacancies and softer asking-rent achievability than the comps imply.
- What's the recent tenant-quality profile in this submarket — average credit score on applications, eviction rate, late-payment / NSF rate, and stable-employment percentage? A property-management company in the area should have these aggregated.
- How much new for-sale + rental construction is in the pipeline within 1–3 miles? Heavy new supply typically softens prices + rents 12–24 months out; constrained supply supports both.
Investment metrics
- 1% rule
- 1.18% ✓
- Cap rate
- 8.94%
- Cash-on-cash
- 9.46%
- DSCR
- 1.42
- GRM
- 7.1
CMA / ARV
- ARV (on-the-fly)
- $227,216
- Comps found
- 1
Show comp detail 1 sale within ~0.75 mi
| Address | Dist | Beds/Ba | Sqft | Sold | Price | $/sf | Match |
|---|---|---|---|---|---|---|---|
| 3640 Main Hwy Lot 81 | 0.41mi | 4/2.0 (+1) | 2,432 (-6%) | 12mo | $215,000 | $88 | 57 |
Match score weights: distance 35% · size 25% · config 20% · recency 20%. Top-matched comps best support the ARV.
Projected returns pro-forma
-3.0% appreciation · 3.0% rent growth · sell at horizon
- IRR
- -2.0%
- Equity multiple
- 0.92×
- Total profit
- $-2,546
- Equity at exit
- $17,892
- IRR
- 7.7%
- Equity multiple
- 1.58×
- Total profit
- $19,645
- Equity at exit
- $10,375
Cash invested: $33,600 (down + closing). Projections, not guarantees.
Landlord ↔ Tenant lean methodology
- Overall (STATE)
- 90 Strongly Landlord-Friendly
- State Louisiana
- 90 Strongly Landlord-Friendly · R+12
- County
- — inherits STATE
- City
- — inherits STATE
ZIP-level market 70517
- Home prices YoY
- -33.7%
- Active inventory
- 276
- Price-to-rent
- 7.1×
Monthly cashflow live
- Estimated rent
- $1,416 medium interval (Pro) →
- Mortgage (P&I)
- −$629
- Tax from tax record
- −$175 /mo · $2,099/yr
- Insurance
- −$50
- HOA
- −$0
- Vacancy / Maint / Mgmt
- −$297
- Net cashflow
- $265
Break-even live
UW: 25.0% down · 7.5% · 30yr · 1.5% tax · 5.0% vac · 8.0% maint · 8.0% mgmt
Financing live
Cash to close
- Down payment
- $30,000
- Closing costs
- $3,600
- Reserves months
- —
- Total cash needed
- —
Loan-product check · same deal, 3 products live
Conventional
25% down · 7.5% · 30yr
- Down + closing
- —
- Monthly P&I
- —
- Monthly cashflow
- —
- DSCR
- —
- Eligible?
- —
Personal DTI + credit; lowest rate.
DSCR
20% down · 8.5% · 30yr
- Down + closing
- —
- Monthly P&I
- —
- Monthly cashflow
- —
- DSCR
- —
- Eligible?
- —
No personal income docs; deal must DSCR.
Hard money
10% down · 12.0% · 12mo
- Down + closing
- —
- Monthly P&I
- —
- Monthly cashflow
- —
- DSCR
- —
- Eligible?
- —
Short-term bridge; refi at stabilization.
Listing history 2 events
-
2026-05-23status Pending
-
2026-05-19$120,000 Active
ⓘ Source: listings_history table (triggers on properties + properties_extension) + one-shot
backfill from property_details.listing_events for pre-trigger history.
Tax reassessment forecast LA · Resets to sale price
- Current annual tax
- $2,099 · $175/mo
- Projected year-2 tax
- $2,099 · $175/mo
- Expected delta
- $0/yr ($0/mo · 0.0%)
ⓘ Screening estimate from a state-policy table — verify with the county assessor before closing.
Climate risk First Street
- Flood 1/10 Low FEMA zone X · 0% chance over 30 yrs
- Wildfire 1/10 Low
- Heat 8/10 Severe 7 d/yr ≥109°F today · 20 d/yr by 30 yrs out
- Wind 9/10 Extreme 99% chance of damaging wind over 30 yrs
- Air quality 2/10 Low 1 unhealthy d/yr today · 1 by 30 yrs out
Nearby sold comps map
Loading sold comps map…
Walkable amenities ~0.75 mi
Loading nearby amenities…
Taxation est. · year 1
- Rental income
- $16,997
- − Mortgage interest
- −$6,722
- − Property taxes
- −$2,099
- − Insurance
- −$600
- − Repairs & maintenance
- −$1,360
- − Management
- −$1,360
- − Depreciation
- −$3,491
- Taxable income
- $1,366
- Est. tax owed @ 24.0%
- −$328
- After-tax cash flow
- $2,849/yr
For passive investors: Depreciation is non-cash, so a rental often shows a tax loss while cash-flowing — sheltering income. Rental losses are passive: they offset passive income freely, and up to $25,000/yr can offset ordinary (W-2) income if you actively participate and your MAGI is under $100k (phasing out to $0 by $150k); unused losses carry forward. On sale, claimed depreciation is recaptured at up to 25%, and gains may owe capital-gains tax (a 1031 exchange can defer both). Figures are a year-1 estimate at your 24.0% rate — not tax advice; consult a CPA.
Schools (NCES district)
- District
- St. Martin Parish
- NCES district ID
- 2201590
- Math proficiency
- 23% ▼ -44.00%
- Reading proficiency
- 32% ▼ -36.00%
- Median HH income
- $42,813
- Composite
- 23.41/100
- National rank
- #7897
- State rank
- #49 of 98 in LA
Livability — Breaux Bridge
- Score
- 62/100
- State rank
- #210
- US rank
- #16362
Category grades
Schools grade is shown separately in the Schools card above.
Census & demographics
- Population (ZIP)
- 26,570
Population outlook (St. Martin County) Hauer SSP2
- Today (2025)
- 57,446 people
- By 2030
- 58,857 · +2.5%
- By 2040
- 60,859 · +5.9%
- By 2050
- 61,419 · +6.9%
- By 2075
- 61,574 · +7.2%
- By 2100
- 57,253 · -0.3%
Race, ethnicity, and origin ACS 2023
- Neighborhood character
- Majority White (62%)
- Race & ethnicity
- White 62% Black 30% Two or more races 5% Hispanic / Latino 4% Asian 1%
- Common ancestry
- Lithuanian 18% Slovak 1% Romanian 1%
- Foreign-born
- 3% · Canada, Vietnam, China
- Languages at home
- 87% English-only · French/Haitian/Cajun 9% Spanish 3% Vietnamese 1%
Political lean MEDSL · St. Martin
- 2024 margin
- Solid R (+40.7) · D 29.1% · R 69.8% · Other 1.0%
- 2008→2024 swing
- -20.0pp toward R · 2008: -20.7pp · 2024: -40.7pp
- All cycles
- 2024: R+40.7 2020: R+36.1 2016: R+33.4 2012: R+24.5 2008: R+20.7
Not yet ingested
- Civics
- —
Market trends
- HPI YoY
- ▼ -73.00%
- Current HPI
- 143.4293
- Rent YoY
- —
- Metro
- —
- State GDP YoY
- ▲ 3.29%
- F500 in state
- 10
Industry mix (Fortune 500 HQ in LA)
| Industry | F500 HQs | Revenue |
|---|---|---|
| Telecommunications | 2 | $23B |
|
||
| Utilities | 1 | $12B |
|
||
| Wholesale / Distribution | 1 | $5B |
|
||
| Advertising | 1 | $2B |
|
||
Price history
2 events — show timeline
- 2026-05-23 Pending — AcadianaMLS
- 2026-05-19 Listed $120,000 AcadianaMLS
Property tax history
+3.2%/yrLatest (2025): $2,099 · -0.7% YoY. Source: county tax records.
Cash-flow waterfall
monthlySold comps — $/sqft
last 12 mo · ≤1 miLoading sold comps…