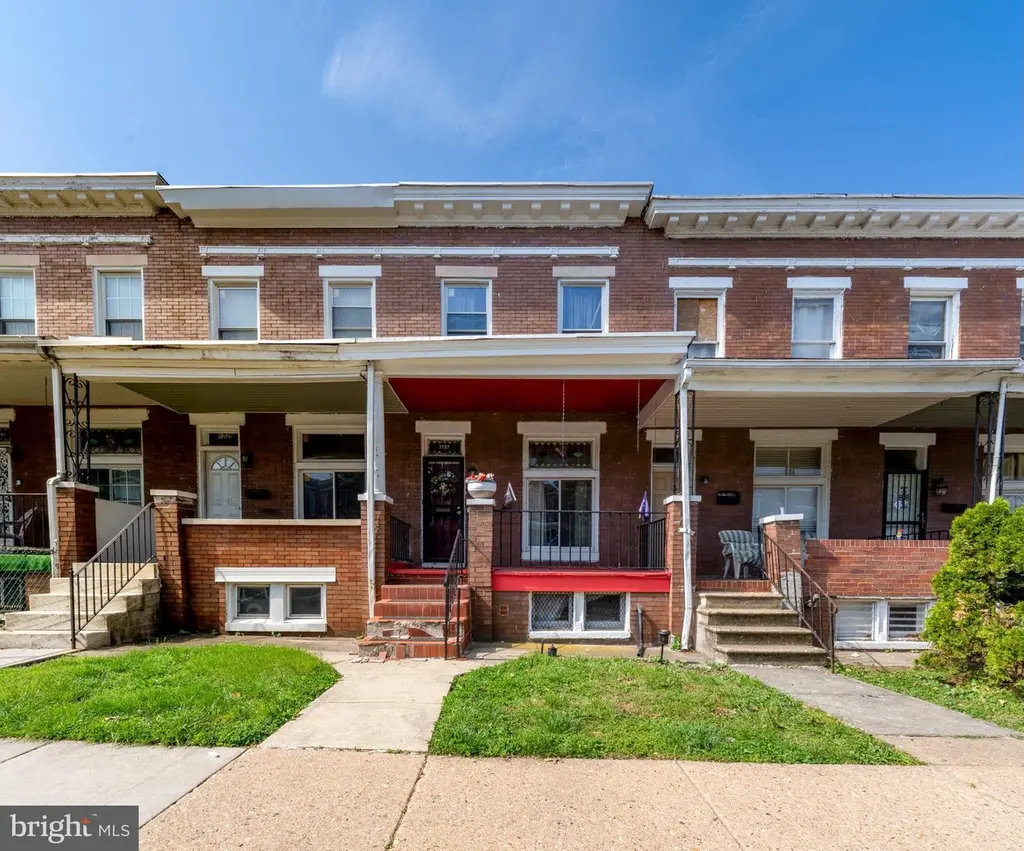
1737 Homestead St · Baltimore, MD
Flood risk 1/10 · Minimal
- FEMA flood zone
- X (unshaded)
- Chance of flooding over 30 yrs
- 0.0%
- Est. flood insurance / yr
- $473 – $860
Fire risk 1/10 · Minimal
- Est. fire insurance / yr
- $755 – $1,403
Heat risk 8/10 · Major
- Hot days now (above 103°F)
- 7 days/yr
- Hot days in 30 yrs
- 15 days/yr
Wind risk 6/10 · Moderate
- Chance of severe wind over 30 yrs
- 27.0%
Air-quality risk 4/10 · Minor
- Unhealthy air days now
- 6 days/yr
- Unhealthy air days in 30 yrs
- 7 days/yr
Risk factors via First Street. Map © Google.
Why this score? — see what drove the B+ grade
The composite is a weighted blend of 9 inputs, each scored 0–100. Each bar is that input's sub-score; the figure is the points it added to the 100-point composite (weight × sub-score).
- Cash flow +30.0/30.0
- ARV discount +15.0/15.0
- 1% rule +10.0/10.0
- DSCR +10.0/10.0
- Livability +3.8/5.0
- Rent growth +2.9/5.0
- Condition / age +2.5/5.0
- Schools +1.0/10.0
- Appreciation +0.0/10.0
$80,000
🖨 Deal sheet (PDF) 📄 Offer letter ✓ Due diligence
Listing remarks
Prime investment opportunity in a desirable Baltimore location near Lake Montebello and Clifton Park Golf Course. Ideal for investors seeking a quick flip or a buy-and-hold with immediate rental income potential. Situated in a strong market with consistent demand and long-term upside. There is multiple projects happening in the area. 2 on the same street and several on neighboring streets. Not to mention Lake Clifton is officially under construction! Don’t miss your opportunity to invest in this rapidly evolving neighborhood.
Key facts
- Built 1940
- Listed 38 days
Property features AI
Finance
- Financial info: Ground rent $96 annually
Exterior
- Parking: On-street parking
- Utilities: Public water; Public sewer; Electric hot water
- Home design: Interior townhouse/rowhouse; Brick front
- Construction: Concrete perimeter foundation and slab; Above-grade structure
- Exterior features: Not in a federal flood zone; Ground rent exists (paid annually)
Interior
- Bedrooms: 3 bedrooms on main level
- Bathrooms: 1 full bathroom on main level; 1 full bathroom total
- Heating & cooling: Space heater; Window air conditioning units
- Interior features: Estimated living area; Full basement
Neighborhood map
What this means for you Summary
Snapshot
- This is a 3-bed/1.0-bath townhouse listed at $80k.
Deal economics
- At list price, monthly cash flow is $832 ($10k/yr) — positive.
- The deal already cash-flows at list — no discount required.
- Meets the 1% rule at list price ($2k rent vs $80k).
- Recommended offer: $78k (3.0% below list) — sets the bar for market timing.
- Cap rate 18.8% vs local median 6.0% in Baltimore — top-decile yield for the area; either an underpriced asset or a hidden risk that comps aren't pricing in. Stress-test before assuming the spread holds.
Location & tenants
- Location reads 76/100 on livability (#90 in MD, #3,396 nationally) — a middle-class / working-renter tenant base. Strengths: amenities A+, commute A+, housing A+; Watch: schools D, crime F.
- Baltimore City Public Schools (urban): math 7% / reading 16% proficiency, ranked #24 of 24 in MD (top 100%) — low school quality limits family demand, transient renter base, plan for 1-2y turnover; 79% free/reduced lunch — lower-income household profile, screen leases tightly.
- Market conditions: Rents rising (+1.6%/yr); 325 active listings in the ZIP; 40 comparable units currently listed for rent nearby; rentals at typical pace (median 25d on market — plan ~3-4 weeks tenant-placement turnaround); 40% of comp listings sitting > 30 days — soft ceiling on asking rent; 1,273 units permitted in Baltimore city in 2024 (1,104 in 5+ unit buildings).
- This rent runs 34% of the median local income ($62k/yr) — at the standard rent-burdened threshold; future hikes will face affordability resistance.
Forward outlook
- Local home prices are declining (-3.0%/yr); year-one equity from $553 of loan paydown is wiped out by about $2k of value loss. Plan a longer hold.
- Baltimore County population projected to shrink 4% by 2050 — rents likely to lag national; underwrite the cash flow, not the appreciation.
- At projected returns (-3.0% appreciation + 1.6% rent growth), your $22k cash investment doubles in ~3 years — after that, you're playing with house money.
Negotiation context
- It's been on market 38 days — a 3% lower offer ($78k) is reasonable based on typical stale-listing flexibility.
- 2 sale attempts; this cycle's ask has dropped $10k (11%) from the opening price — seller is motivated, your offer sets the floor, not the list.
- Current owner paid $49k; list at $80k implies a 64% gain — meaningful room to come down on a strong offer.
Risks & watch-outs
- Watch-outs: built in 1940 — expect roof / HVAC / electrical / plumbing capex.
- Climate carrying-cost: major wind risk, 27% chance of damaging wind over 30y; extreme-heat days projected 7→15/yr by 2055 (HVAC capex compounding) — expect insurance premiums to compound above CPI over the hold.
Questions for the listing agent
- It's been on market 38 days. Have you received any prior offers? Is the seller open to a 3% concession, seller financing, or rate buy-down credit?
- Built in 1940 — when were the roof, HVAC, electrical panel, plumbing, and water heater last replaced?
- Is there a deadline driving the sale (1031 exchange, divorce, estate, relocation)? That informs how much negotiation room exists.
- Schools are D-rated, which usually means shorter tenancies and higher turnover. Who's the typical renter profile here, and what's been the actual vacancy rate?
- Crime grade is F in this area — have there been break-ins, vandalism, or insurance claims at this property in the last 3 years? What carrier currently insures it and at what premium?
- What's the average days-on-market for RENTAL listings here right now (not sales)? A rising rental-DOM trend means longer vacancies and softer asking-rent achievability than the comps imply.
- What's the recent tenant-quality profile in this submarket — average credit score on applications, eviction rate, late-payment / NSF rate, and stable-employment percentage? A property-management company in the area should have these aggregated.
- How much new for-sale + rental construction is in the pipeline within 1–3 miles? Heavy new supply typically softens prices + rents 12–24 months out; constrained supply supports both.
Investment metrics
- 1% rule
- 2.19% ✓
- Cap rate
- 18.77%
- Cash-on-cash
- 44.57%
- DSCR
- 2.98
- GRM
- 3.8
CMA / ARV
- ARV (median comp)
- $130,748
- List price
- $80,000
- Delta
- -31.17%
- Verdict
- UNDERPRICED
- Comps
- 20 within 1.0 mi
Show comp detail 12 sales within ~0.75 mi
| Address | Dist | Beds/Ba | Sqft | Sold | Price | $/sf | Match |
|---|---|---|---|---|---|---|---|
| 1652 Darley Ave | 0.35mi | 3/1.0 | 1,100 (+2%) | 0mo | $52,500 | $48 | 80 |
| 1658 E 25th St | 0.25mi | 3/1.0 | 1,040 (-4%) | 4mo | $70,000 | $67 | 79 |
| 1601 E 28th St | 0.28mi | 3/2.0 | 1,100 (+2%) | 3mo | $120,000 | $109 | 77 |
| 728 Bartlett Ave | 0.67mi | 3/1.0 | 1,100 (+2%) | 2mo | $40,000 | $36 | 64 |
| 2559 Garrett Ave | 0.19mi | 3/3.0 | 1,202 (+11%) | 2mo | $205,000 | $171 | 62 |
| 1822 Aiken St | 0.70mi | 3/1.0 | 1,050 (-3%) | 3mo | $49,000 | $47 | 61 |
| 1017 Darley Ave | 0.38mi | 3/1.5 | 1,200 (+11%) | 6mo | $175,000 | $146 | 57 |
| 2030 E Lafayette Ave | 0.65mi | 2/2.5 (-1) | 1,100 (+2%) | 5mo | $182,000 | $165 | 51 |
| 1722 E Lanvale St | 0.69mi | 3/1.0 | 1,200 (+11%) | 0mo | $125,000 | $104 | 49 |
| 3103 Independence St | 0.58mi | 2/1.0 (-1) | 930 (-14%) | 5mo | $145,000 | $156 | 41 |
| 1626 N Wolfe St | 0.74mi | 2/1.0 (-1) | 1,200 (+11%) | 6mo | $45,000 | $38 | 37 |
| 1234 E Lafayette Ave E | 0.74mi | 3/2.5 | 1,225 (+13%) | 2mo | $219,000 | $179 | 36 |
Match score weights: distance 35% · size 25% · config 20% · recency 20%. Top-matched comps best support the ARV.
Projected returns pro-forma
-3.0% appreciation · 1.63% rent growth · sell at horizon
- IRR
- 40.0%
- Equity multiple
- 2.68×
- Total profit
- $37,668
- Equity at exit
- $11,928
- IRR
- 45.7%
- Equity multiple
- 5.09×
- Total profit
- $91,629
- Equity at exit
- $6,917
Cash invested: $22,400 (down + closing). Projections, not guarantees.
Landlord ↔ Tenant lean methodology
- Overall (CITY)
- 12 Strongly Tenant-Friendly
- State Maryland
- 27 Tenant-Leaning · D+14
- County
- — inherits STATE
- City Baltimore
- 12 Strongly Tenant-Friendly · D+58
ZIP-level market 21218
- Rents YoY
- 1.6%
- Active inventory
- 325
- Price-to-rent
- 3.8×
Monthly cashflow live
- Estimated rent
- $1,750 high interval (Pro) →
- Mortgage (P&I)
- −$420
- Tax from tax record
- −$98 /mo · $1,177/yr
- Insurance
- −$33
- HOA
- −$0
- Vacancy / Maint / Mgmt
- −$368
- Net cashflow
- $832
Break-even live
Sensitivity live
| Price | -10% $877 | -5% $855 | +0% $832 | +5% $809 | +10% $787 |
|---|---|---|---|---|---|
| Rent | -10% $694 | -5% $763 | +0% $832 | +5% $901 | +10% $970 |
| Rate | -1.0pp $872 | -0.5pp $852 | base $832 | +0.5pp $811 | +1.0pp $790 |
UW: 25.0% down · 7.5% · 30yr · 1.5% tax · 5.0% vac · 8.0% maint · 8.0% mgmt
Financing live
Cash to close
- Down payment
- $20,000
- Closing costs
- $2,400
- Reserves months
- —
- Total cash needed
- —
Loan-product check · same deal, 3 products live
Conventional
25% down · 7.5% · 30yr
- Down + closing
- —
- Monthly P&I
- —
- Monthly cashflow
- —
- DSCR
- —
- Eligible?
- —
Personal DTI + credit; lowest rate.
DSCR
20% down · 8.5% · 30yr
- Down + closing
- —
- Monthly P&I
- —
- Monthly cashflow
- —
- DSCR
- —
- Eligible?
- —
No personal income docs; deal must DSCR.
Hard money
10% down · 12.0% · 12mo
- Down + closing
- —
- Monthly P&I
- —
- Monthly cashflow
- —
- DSCR
- —
- Eligible?
- —
Short-term bridge; refi at stabilization.
Rent comps 40 comps
| Address | Beds | Baths | Sqft | Rent | $/sqft | DOM | Units | Dist |
|---|---|---|---|---|---|---|---|---|
| 2606 Cecil Ave Baltimore, MD | 2.0 | 1.5 | 1200 | $1,500 | $1.25 | 44d | 1 | 0.25mi |
| 1519 E 28th St Baltimore, MD | 3.0 | 2.0 | 1100 | $1,350 | $1.23 | 44d | 1 | 0.26mi |
| 1802 E 28th St Baltimore, MD | 3.0 | 1.0 | 1300 | $1,600 | $1.23 | 24d | 1 | 0.34mi |
| 1607 Cliftview Ave Baltimore, MD | 3.0 | 1.0 | 1200 | $1,475 | $1.23 | 44d | 1 | 0.35mi |
| 1832 E 28th St Baltimore, MD | 3.0 | 1.0 | 1066 | $1,495 | $1.40 | 24d | 1 | 0.36mi |
| 2310 Aisquith St Baltimore, MD | 4.0 | 3.0 | 900 | $2,000 | $2.22 | 5d | 1 | 0.41mi |
| 1702 E 32nd St Baltimore, MD | 3.0 | 2.0 | 1344 | $2,300 | $1.71 | 44d | 1 | 0.49mi |
| 3221 The Alameda Unit 2 Baltimore, MD | 2.0 | 1.0 | 750 | $1,200 | $1.60 | 24d | 1 | 0.54mi |
| 936 Montpelier St Baltimore, MD | 2.0 | 1.0 | 1260 | $1,450 | $1.15 | 24d | 1 | 0.62mi |
| 1814 E Lafayette Ave Baltimore, MD | 4.0 | 2.0 | 1200 | $1,995 | $1.66 | 24d | 1 | 0.63mi |
| 1803 N Dallas St Baltimore, MD | 2.0 | 2.5 | 1250 | $2,100 | $1.68 | 24d | 1 | 0.65mi |
| 1514 E Lafayette Ave Baltimore, MD | 3.0 | 1.5 | 1215 | $2,000 | $1.65 | 24d | 1 | 0.67mi |
| 1512 E Lafayette Ave Baltimore, MD | 3.0 | 2.5 | 1476 | $1,950 | $1.32 | 44d | 1 | 0.67mi |
| 1627 Rutland Ave Unit 1 Baltimore, MD | 3.0 | 2.0 | 1200 | $2,350 | $1.96 | 44d | 1 | 0.73mi |
| 1627 Rutland Ave Baltimore, MD | 3.0 | 2.0 | 1100 | $1,950 | $1.77 | 24d | 1 | 0.73mi |
| 2821 Mathews St Unit 27-668 Baltimore, MD | 2.0 | 1.0 | 730 | $1,050 | $1.44 | 24d | 1 | 0.74mi |
| 646 Cokesbury Ave Baltimore, MD | 2.0 | 1.5 | 1200 | $1,299 | $1.08 | 44d | 1 | 0.76mi |
| 519 E 28th St Baltimore, MD | 3.0 | 2.0 | 1500 | $2,000 | $1.33 | 5d | 1 | 0.76mi |
| 3012 Mathews St Baltimore, MD | 2.0 | 1.0 | 996 | $1,100 | $1.10 | 18d | 1 | 0.78mi |
| 3026 Mathews St Baltimore, MD | 2.0 | 1.0 | 996 | $1,350 | $1.36 | 15d | 1 | 0.79mi |
| 2311 E Lafayette Ave Baltimore, MD | 3.0 | 1.0 | 1000 | $1,400 | $1.40 | 44d | 1 | 0.79mi |
| 1040 E 33rd St Baltimore, MD | 1.0–2.0 | 1.0–2.0 | 775 | $1,525 | $1.97 | 3d | 10 | 0.81mi |
| 1502 Fernley Rd Baltimore, MD | 3.0 | 2.0 | 1350 | $2,800 | $2.07 | 44d | 1 | 0.82mi |
| 2113 Belair Rd Baltimore, MD | 3.0 | 1.0 | 1344 | $1,795 | $1.34 | 44d | 1 | 0.82mi |
| 2535 Greenmount Ave Unit 2 Baltimore, MD | 2.0 | 1.0 | 800 | $1,195 | $1.49 | 44d | 1 | 0.82mi |
| 1243 E Lanvale St Baltimore, MD | 3.0 | 1.5 | 1281 | $1,750 | $1.37 | 17d | 1 | 0.83mi |
| 1243 E Lanvale St Baltimore, MD | 3.0 | 1.5 | 1281 | $1,750 | $1.37 | 3d | 1 | 0.83mi |
| 450 E Lorraine Ave Baltimore, MD | 3.0 | 1.0 | 1344 | $1,695 | $1.26 | 44d | 1 | 0.84mi |
| 616 Montpelier St Baltimore, MD | 3.0 | 1.0 | 1150 | $1,750 | $1.52 | 11d | 1 | 0.85mi |
| 428 E Lorraine Ave Baltimore, MD | 3.0 | 2.0 | 1344 | $1,875 | $1.40 | 24d | 1 | 0.87mi |
| 428 E Lorraine Ave Unit 1 Baltimore, MD | 3.0 | 1.5 | 1344 | $1,875 | $1.40 | 44d | 1 | 0.87mi |
| 3213 Elmley Ave Baltimore, MD | 2.0 | 1.0 | 1188 | $1,395 | $1.17 | 44d | 1 | 0.88mi |
| 436 Ilchester Ave Unit 1 Baltimore, MD | 2.0 | 2.0 | 1002 | $1,350 | $1.35 | 44d | 1 | 0.89mi |
| 411 E Lorraine Ave Baltimore, MD | 3.0 | 1.5 | 1344 | $2,200 | $1.64 | 24d | 1 | 0.90mi |
| 3218 Lyndale Ave Baltimore, MD | 3.0 | 1.5 | 1020 | $1,500 | $1.47 | 24d | 1 | 0.90mi |
| 3222 Lyndale Ave Unit 1 Baltimore, MD | 3.0 | 1.5 | 1500 | $2,200 | $1.47 | 13d | 1 | 0.91mi |
| 3221 Lyndale Ave Baltimore, MD | 2.0 | 2.0 | 1020 | $1,700 | $1.67 | 24d | 1 | 0.91mi |
| 400 E Lorraine Ave Baltimore, MD | 3.0 | 1.0 | 1500 | $1,800 | $1.20 | 21d | 1 | 0.91mi |
| 402 E 28th St Baltimore, MD | 3.0 | 1.0 | 1436 | $2,200 | $1.53 | 44d | 1 | 0.92mi |
| 2410 E Federal St Baltimore, MD | 4.0 | 2.0 | 720 | $2,200 | $3.06 | 24d | 1 | 0.92mi |
Listing history 9 events
-
2026-06-18days on market $80,000 Active 38 DOM
-
2026-06-17pricedays on market $80,000 Active 37 DOM
-
2026-06-04days on market $90,000 Active 35 DOM
-
2026-06-03days on market $90,000 Active 34 DOM
-
2026-06-02days on market $90,000 Active 33 DOM
-
2026-06-01days on market $90,000 Active 32 DOM
-
2026-05-31days on market $90,000 Active 31 DOM
-
2026-05-01$90,000 Active 538-char remark
-
1998-08-21soldstatus $48,900
ⓘ Source: listings_history table (triggers on properties + properties_extension) + one-shot
backfill from property_details.listing_events for pre-trigger history.
Tax reassessment forecast MD · Partial reset (capped growth)
- Current annual tax
- $1,177 · $98/mo
- Projected year-2 tax
- $1,177 · $98/mo
- Expected delta
- $0/yr ($0/mo · 0.0%)
ⓘ Screening estimate from a state-policy table — verify with the county assessor before closing.
Climate risk First Street
- Flood 1/10 Low FEMA zone X (unshaded) · 0% chance over 30 yrs
- Wildfire 1/10 Low
- Heat 8/10 Severe 7 d/yr ≥103°F today · 15 d/yr by 30 yrs out
- Wind 6/10 Major 27% chance of damaging wind over 30 yrs
- Air quality 4/10 Moderate 6 unhealthy d/yr today · 7 by 30 yrs out
Nearby sold comps map
Loading sold comps map…
Walkable amenities ~0.75 mi
Loading nearby amenities…
Taxation est. · year 1
- Rental income
- $21,006
- − Mortgage interest
- −$4,481
- − Property taxes
- −$1,177
- − Insurance
- −$400
- − Repairs & maintenance
- −$1,680
- − Management
- −$1,680
- − Depreciation
- −$2,327
- Taxable income
- $9,259
- Est. tax owed @ 24.0%
- −$2,222
- After-tax cash flow
- $7,761/yr
For passive investors: Depreciation is non-cash, so a rental often shows a tax loss while cash-flowing — sheltering income. Rental losses are passive: they offset passive income freely, and up to $25,000/yr can offset ordinary (W-2) income if you actively participate and your MAGI is under $100k (phasing out to $0 by $150k); unused losses carry forward. On sale, claimed depreciation is recaptured at up to 25%, and gains may owe capital-gains tax (a 1031 exchange can defer both). Figures are a year-1 estimate at your 24.0% rate — not tax advice; consult a CPA.
Schools (NCES district)
- District
- Baltimore City Public Schools
- NCES district ID
- 2400090
- Math proficiency
- 7% ▼ -9.00%
- Reading proficiency
- 16% ▼ -5.00%
- Median HH income
- $42,108
- Composite
- 10.08/100
- National rank
- #9805
- State rank
- #24 of 24 in MD
Livability — Baltimore
- Score
- 76/100
- State rank
- #90
- US rank
- #3396
Category grades
Schools grade is shown separately in the Schools card above.
Census & demographics
- Census place
- Baltimore, MD
- County
- Baltimore City · 558,601 people
- City population
- 588,727
- Metro
- Baltimore-Columbia-Towson, MD
- Population (ZIP)
- 44,014
- Household income
- $62,488
- Rent vs Own
- Severe rent burden
- 2564.0
Population outlook (Baltimore County) Hauer SSP2
- Today (2025)
- 624,249 people
- By 2030
- 621,541 · -0.4%
- By 2040
- 609,756 · -2.3%
- By 2050
- 597,249 · -4.3%
- By 2075
- 552,236 · -11.5%
- By 2100
- 513,934 · -17.7%
Race, ethnicity, and origin ACS 2023
- Neighborhood character
- Diverse neighborhood (Simpson 0.58)
- Race & ethnicity
- Black 60% White 26% Two or more races 6% Hispanic / Latino 5% Asian 5%
- Hispanic origin (detail)
- Common ancestry
- Romanian 2% Italian 1% Scotch-Irish 1%
- Foreign-born
- 10% · Canada, China, South Korea
- Languages at home
- 87% English-only · Spanish 4% French/Haitian/Cajun 2% Chinese 2%
Political lean MEDSL · Baltimore
- 2024 margin
- Solid D (+73.0) · D 85.2% · R 12.2% · Other 2.6%
- 2008→2024 swing
- -2.5pp toward R · 2008: 75.5pp · 2024: 73.0pp
- All cycles
- 2024: D+73.0 2020: D+76.6 2016: D+74.6 2012: D+76.4 2008: D+75.5
Not yet ingested
- Civics
- —
Market trends
- HPI YoY
- ▼ -463.14%
- Current HPI
- 292.3986
- Rent YoY
- ▲ 1.63%
- Metro
- Baltimore-Columbia-Towson, MD
- State GDP YoY
- ▲ 2.97%
- F500 in state
- 12
Industry mix (Fortune 500 HQ in MD)
| Industry | F500 HQs | Revenue |
|---|---|---|
| Aerospace / Defense | 1 | $71B |
|
||
| Utilities | 1 | $25B |
|
||
| Hotels | 1 | $24B |
|
||
| Consumer Goods | 1 | $7B |
|
||
| Real Estate | 1 | $6B |
|
||
| Chemicals | 1 | $2B |
|
||
Price history
+63.6% since first listed5 events — show timeline
- 2026-06-17 Price Changed $80,000 BRIGHT MLS
- 2026-06-17 Relisted — BRIGHT MLS
- 2026-06-06 Listing Removed — BRIGHT MLS
- 2026-05-01 Listed $90,000 BRIGHT MLS
- 1998-08-21 Sold (Public Records) $48,900 Public Records
Property tax history
+3.5%/yrLatest (2025): $1,177 · +15.4% YoY. Source: county tax records.
Cash-flow waterfall
monthlySold comps — $/sqft
last 12 mo · ≤1 miLoading sold comps…