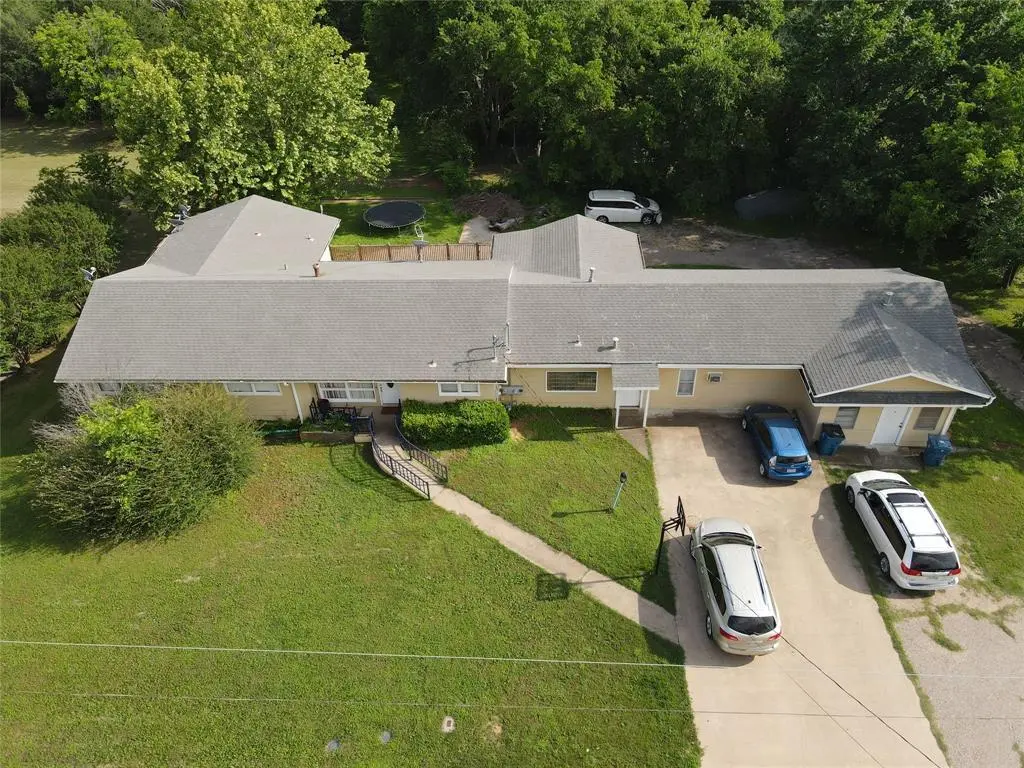
 Fourplex
109 E 4th St · Keene, TX
Flood risk 1/10 · Minimal
- FEMA flood zone
- X (unshaded)
- Chance of flooding over 30 yrs
- 0.0%
- Est. flood insurance / yr
- $507 – $1,088
Fire risk 5/10 · Moderate
- Est. fire insurance / yr
- $1,222 – $2,270
Heat risk 6/10 · Moderate
- Hot days now (above 109°F)
- 7 days/yr
- Hot days in 30 yrs
- 23 days/yr
Wind risk 6/10 · Moderate
- Chance of severe wind over 30 yrs
- 27.0%
Air-quality risk 2/10 · Minimal
- Unhealthy air days now
- 2 days/yr
- Unhealthy air days in 30 yrs
- 2 days/yr
Risk factors via First Street. Map © Google.
Why this score? — see what drove the B grade
The composite is a weighted blend of 9 inputs, each scored 0–100. Each bar is that input's sub-score; the figure is the points it added to the 100-point composite (weight × sub-score).
- Cash flow +30.0/30.0
- ARV discount +12.0/15.0
- 1% rule +10.0/10.0
- DSCR +10.0/10.0
- Livability +3.6/5.0
- Schools +3.3/10.0
- Rent growth +2.5/5.0
- Condition / age +2.5/5.0
- Appreciation +0.0/10.0
$350,000
🖨 Deal sheet (PDF) 📄 Offer letter ✓ Due diligence
Multi-family units
County records classify this as Multi-Family (2-4 Unit). Listing-text estimate: 4 units. confirmed
Listing remarks MLS
BRING YOUR INVESTORS FOR THIS GREAT FOURPLEX CASH FLOW PROPERTY. ALL UNITS FULLY LEASED CLOSE TO SWAU AND INCLUDES A FIFTH UNIT USED FOR STORAGE WHICH COULD BE CONVERTED TO ANOTHER LEASEABLE UNIT. EACH FEATURES LARGE LIVING WITH CARPET AND TILE FLOORING AND NEW ROOF IN 2011. MUST SEE!! PLEASE DO NOT APPROACH TENANTS. LARGE LOT ON ALMOST 1 ACRE, MINERALS NEGOTIABLE.
Key facts
- 0.85 acre lot
- 4 parking spots
- Built 1970
Property features AI
Finance
- Other: Will not subdivide; Parcel number 126011400280
- Financial info: Gross annual income: $42,000; Gross annual expenses: $3,500; Insurance expense: $2,000; Net operating income: $36,500; Capitalization rate: 10.43%; Accepts cash, conventional, FHA, and VA financing
- HOA & community: No association
Exterior
- Parking: Assigned parking; Driveway parking; On-site parking; 4 parking spaces
- Utilities: City sewer; City water; Electricity available; Not in a municipal utility district
- Home design: Residential income property; Quadruplex; One building; Preowned (built 1970)
- Construction: Composition roof; Combination and slab foundation; Construction materials: see remarks
- Exterior features: Accessible approach with ramp; Deck
Interior
- Kitchen: Dishwasher; Electric oven
- Flooring: Ceramic tile; Combination flooring
- Heating & cooling: Central heating; Central air conditioning
- Interior features: Other interior features; Two levels
Neighborhood map
What this means for you Summary
Snapshot
- This is a 4 × 2-bed/1-bath units multifamily listed at $350k.
Deal economics
- At list price, monthly cash flow is $2k ($20k/yr) — positive. Per door: $415/mo.
- The deal already cash-flows at list — no discount required.
- Meets the 1% rule at list price ($5k rent vs $350k).
- Recommended offer: $340k (3.0% below list) — sets the bar for market timing.
- Cap rate 12.0% vs local median 3.2% in Keene — top-decile yield for the area; either an underpriced asset or a hidden risk that comps aren't pricing in. Stress-test before assuming the spread holds.
Location & tenants
- Location reads 72/100 on livability (#249 in TX) — a middle-class / working-renter tenant base. Strengths: crime A+, cost of living A+, housing A+; Watch: employment D+, amenities F, commute F.
- Keene ISD (town): math 37% / reading 41% proficiency, ranked #447 of 826 in TX (top 54%) — families likely to look elsewhere, expect single-tenant / working-renter base with shorter leases; 67% free/reduced lunch — lower-income household profile, screen leases tightly.
- Zoned schools: Keene El (math 41% / reading 42%, grade F, #1,437 of 4,322 statewide, top 34%, 239 students, 77% FRL).
- Market conditions: 80 active listings in the ZIP; 2,152 units permitted in Johnson County in 2024 (76 in 5+ unit buildings).
Forward outlook
- Local home prices are declining (-3.0%/yr); year-one equity from $2k of loan paydown is wiped out by about $10k of value loss. Plan a longer hold.
- Johnson County population projected at +24% by 2050 — long-run rental-demand tailwind backs the buy-and-hold thesis.
- At projected returns (-3.0% appreciation + 3.0% rent growth), your $98k cash investment doubles in ~6 years — after that, you're playing with house money.
Negotiation context
- It's been on market 53 days — a 3% lower offer ($340k) is reasonable based on typical stale-listing flexibility.
- 4 sale attempts since 15y ago with the ask held roughly flat each time — persistent listings suggest the price (not the market) is what's stuck; bring a comps-based counter.
Risks & watch-outs
- Climate carrying-cost: major wind risk, 27% chance of damaging wind over 30y; moderate wildfire risk; extreme-heat days projected 7→23/yr by 2055 (HVAC capex compounding) — expect insurance premiums to compound above CPI over the hold.
Questions for the listing agent
- It's been on market 53 days. Have you received any prior offers? Is the seller open to a 3% concession, seller financing, or rate buy-down credit?
- Can we see the unit-by-unit rent roll, current vacancy, and any below-market leases? What's the average tenancy length?
- What capital expenditures (roof, boiler, parking lot, exteriors) have been made in the last 5 years, and what's planned in the next 2?
- Built in 1970 — when were the roof, HVAC, electrical panel, plumbing, and water heater last replaced?
- Is there a deadline driving the sale (1031 exchange, divorce, estate, relocation)? That informs how much negotiation room exists.
- Schools are D-rated, which usually means shorter tenancies and higher turnover. Who's the typical renter profile here, and what's been the actual vacancy rate?
- What's the average days-on-market for RENTAL listings here right now (not sales)? A rising rental-DOM trend means longer vacancies and softer asking-rent achievability than the comps imply.
- What's the recent tenant-quality profile in this submarket — average credit score on applications, eviction rate, late-payment / NSF rate, and stable-employment percentage? A property-management company in the area should have these aggregated.
- How much new apartment / multifamily construction is in the pipeline within 1–3 miles? Heavy new supply (>2% of stock underway) typically softens rents 12–24 months out; light construction supports rent growth.
Investment metrics
- 1% rule
- 1.57% ✓
- Cap rate
- 11.99%
- Cash-on-cash
- 20.33%
- DSCR
- 1.90
- GRM
- 5.3
CMA / ARV
- ARV (median comp)
- $389,003
- List price
- $350,000
- Delta
- -10.03%
- Verdict
- UNDERPRICED
- Comps
- 1 within 2.0 mi
Projected returns pro-forma
-3.0% appreciation · 3.0% rent growth · sell at horizon
- IRR
- 12.6%
- Equity multiple
- 1.50×
- Total profit
- $49,262
- Equity at exit
- $52,186
- IRR
- 21.6%
- Equity multiple
- 2.84×
- Total profit
- $180,012
- Equity at exit
- $30,262
Cash invested: $98,000 (down + closing). Projections, not guarantees.
Landlord ↔ Tenant lean methodology
- Overall (STATE)
- 87 Strongly Landlord-Friendly
- State Texas
- 87 Strongly Landlord-Friendly · R+5
- County
- — inherits STATE
- City
- — inherits STATE
ZIP-level market 76059
- Home prices YoY
- -7.0%
- Active inventory
- 80
- Price-to-rent
- 21.3×
Monthly cashflow live
- Estimated rent
- $5,478 high interval (Pro) →
- Mortgage (P&I)
- −$1,835
- Tax from tax record
- −$686 /mo · $8,233/yr
- Insurance
- −$146
- HOA
- −$0
- Vacancy / Maint / Mgmt
- −$1,150
- Net cashflow
- $1,660
Break-even live
Sensitivity live
| Price | -10% $1,858 | -5% $1,759 | +0% $1,660 | +5% $1,561 | +10% $1,462 |
|---|---|---|---|---|---|
| Rent | -10% $1,227 | -5% $1,444 | +0% $1,660 | +5% $1,877 | +10% $2,093 |
| Rate | -1.0pp $1,836 | -0.5pp $1,749 | base $1,660 | +0.5pp $1,570 | +1.0pp $1,477 |
4-unit breakdown (identical units grouped — click to expand)
| Units | Beds | Baths | Est. rent |
|---|---|---|---|
| 4× units | 2 | 1 | $5,476 |
| #1 | 2 | 1 | $1,369 |
| #2 | 2 | 1 | $1,369 |
| #3 | 2 | 1 | $1,369 |
| #4 | 2 | 1 | $1,369 |
| Total (4 units) | $5,478 | ||
UW: 25.0% down · 7.5% · 30yr · 1.5% tax · 5.0% vac · 8.0% maint · 8.0% mgmt
Financing live
Cash to close
- Down payment
- $87,500
- Closing costs
- $10,500
- Reserves months
- —
- Total cash needed
- —
Loan-product check · same deal, 3 products live
Conventional
25% down · 7.5% · 30yr
- Down + closing
- —
- Monthly P&I
- —
- Monthly cashflow
- —
- DSCR
- —
- Eligible?
- —
Personal DTI + credit; lowest rate.
DSCR
20% down · 8.5% · 30yr
- Down + closing
- —
- Monthly P&I
- —
- Monthly cashflow
- —
- DSCR
- —
- Eligible?
- —
No personal income docs; deal must DSCR.
Hard money
10% down · 12.0% · 12mo
- Down + closing
- —
- Monthly P&I
- —
- Monthly cashflow
- —
- DSCR
- —
- Eligible?
- —
Short-term bridge; refi at stabilization.
Listing history 26 events
-
2026-06-21days on market $350,000 Active 53 DOM
-
2026-06-18days on market $350,000 Active 50 DOM
-
2026-06-17days on market $350,000 Active 49 DOM
-
2026-06-16days on market $350,000 Active 48 DOM
-
2026-06-15days on market $350,000 Active 47 DOM
-
2026-06-13days on market $350,000 Active 45 DOM
-
2026-06-09days on market $350,000 Active 41 DOM
-
2026-06-08days on market $350,000 Active 40 DOM
-
2026-06-07days on market $350,000 Active 39 DOM
-
2026-06-04days on market $350,000 Active 36 DOM
-
2026-06-03days on market $350,000 Active 35 DOM
-
2026-06-02days on market $350,000 Active 34 DOM
-
2026-06-01days on market $350,000 Active 33 DOM
-
2026-05-31days on market $350,000 Active 32 DOM
-
2026-05-14status Active 931-char remark
-
2026-05-06historical Active Option Contract 931-char remark
-
2026-04-29$350,000 Active 931-char remark
-
2012-06-20soldstatus
-
2012-06-15soldstatus Closed 367-char remark
Show marketing remark (367 chars)
BRING YOUR INVESTORS FOR THIS GREAT FOURPLEX CASH FLOW PROPERTY. ALL UNITS FULLY LEASED CLOSE TO SWAU AND INCLUDES A FIFTH UNIT USED FOR STORAGE WHICH COULD BE CONVERTED TO ANOTHER LEASEABLE UNIT. EACH FEATURES LARGE LIVING WITH CARPET AND TILE FLOORING AND NEW ROOF IN 2011. MUST SEE!! PLEASE DO NOT APPROACH TENANTS. LARGE LOT ON ALMOST 1 ACRE, MINERALS NEGOTIABLE.
-
2012-06-01status Pending 367-char remark
Show marketing remark (367 chars)
BRING YOUR INVESTORS FOR THIS GREAT FOURPLEX CASH FLOW PROPERTY. ALL UNITS FULLY LEASED CLOSE TO SWAU AND INCLUDES A FIFTH UNIT USED FOR STORAGE WHICH COULD BE CONVERTED TO ANOTHER LEASEABLE UNIT. EACH FEATURES LARGE LIVING WITH CARPET AND TILE FLOORING AND NEW ROOF IN 2011. MUST SEE!! PLEASE DO NOT APPROACH TENANTS. LARGE LOT ON ALMOST 1 ACRE, MINERALS NEGOTIABLE.
-
2012-05-24historical Active Option Contract 367-char remark
Show marketing remark (367 chars)
BRING YOUR INVESTORS FOR THIS GREAT FOURPLEX CASH FLOW PROPERTY. ALL UNITS FULLY LEASED CLOSE TO SWAU AND INCLUDES A FIFTH UNIT USED FOR STORAGE WHICH COULD BE CONVERTED TO ANOTHER LEASEABLE UNIT. EACH FEATURES LARGE LIVING WITH CARPET AND TILE FLOORING AND NEW ROOF IN 2011. MUST SEE!! PLEASE DO NOT APPROACH TENANTS. LARGE LOT ON ALMOST 1 ACRE, MINERALS NEGOTIABLE.
-
2012-05-19$239,900 Active 367-char remark
Show marketing remark (367 chars)
BRING YOUR INVESTORS FOR THIS GREAT FOURPLEX CASH FLOW PROPERTY. ALL UNITS FULLY LEASED CLOSE TO SWAU AND INCLUDES A FIFTH UNIT USED FOR STORAGE WHICH COULD BE CONVERTED TO ANOTHER LEASEABLE UNIT. EACH FEATURES LARGE LIVING WITH CARPET AND TILE FLOORING AND NEW ROOF IN 2011. MUST SEE!! PLEASE DO NOT APPROACH TENANTS. LARGE LOT ON ALMOST 1 ACRE, MINERALS NEGOTIABLE.
-
2012-04-11historical
-
2011-10-10$239,900 Active
-
1999-08-12soldstatus
-
1999-08-12soldstatus
ⓘ Source: listings_history table (triggers on properties + properties_extension) + one-shot
backfill from property_details.listing_events for pre-trigger history.
Tax reassessment forecast TX · Resets to sale price
- Current annual tax
- $8,233 · $686/mo
- Projected year-2 tax
- $8,233 · $686/mo
- Expected delta
- $0/yr ($0/mo · 0.0%)
ⓘ Screening estimate from a state-policy table — verify with the county assessor before closing.
Climate risk First Street
- Flood 1/10 Low FEMA zone X (unshaded) · 0% chance over 30 yrs
- Wildfire 5/10 Major
- Heat 6/10 Major 7 d/yr ≥109°F today · 23 d/yr by 30 yrs out
- Wind 6/10 Major 27% chance of damaging wind over 30 yrs
- Air quality 2/10 Low 2 unhealthy d/yr today · 2 by 30 yrs out
Nearby sold comps map
Loading sold comps map…
Walkable amenities ~0.75 mi
Loading nearby amenities…
Taxation est. · year 1
- Rental income
- $65,736
- − Mortgage interest
- −$19,605
- − Property taxes
- −$8,233
- − Insurance
- −$1,750
- − Repairs & maintenance
- −$5,259
- − Management
- −$5,259
- − Depreciation
- −$10,182
- Taxable income
- $15,448
- Est. tax owed @ 24.0%
- −$3,707
- After-tax cash flow
- $16,215/yr
For passive investors: Depreciation is non-cash, so a rental often shows a tax loss while cash-flowing — sheltering income. Rental losses are passive: they offset passive income freely, and up to $25,000/yr can offset ordinary (W-2) income if you actively participate and your MAGI is under $100k (phasing out to $0 by $150k); unused losses carry forward. On sale, claimed depreciation is recaptured at up to 25%, and gains may owe capital-gains tax (a 1031 exchange can defer both). Figures are a year-1 estimate at your 24.0% rate — not tax advice; consult a CPA.
Schools (NCES district)
- District
- Keene ISD
- NCES district ID
- 4825230
- Math proficiency
- 37% ▼ -1.00%
- Reading proficiency
- 41% ▲ 3.00%
- Median HH income
- $40,764
- Composite
- 32.77/100
- National rank
- #5632
- State rank
- #447 of 826 in TX
Livability — Keene
- Score
- 72/100
- State rank
- #249
- US rank
- #5923
Category grades
Schools grade is shown separately in the Schools card above.
Census & demographics
- Census place
- Keene, TX
- City population
- 5,333
- Population (ZIP)
- 5,333
Population outlook (Johnson County) Hauer SSP2
- Today (2025)
- 179,678 people
- By 2030
- 189,208 · +5.3%
- By 2040
- 207,261 · +15.4%
- By 2050
- 223,064 · +24.1%
- By 2075
- 259,979 · +44.7%
- By 2100
- 275,395 · +53.3%
Race, ethnicity, and origin ACS 2023
- Neighborhood character
- Diverse neighborhood (Simpson 0.60)
- Race & ethnicity
- White 54% Hispanic / Latino 32% Two or more races 13% Asian 6% Black 2%
- Hispanic origin (detail)
- Mexican 25% Puerto Rican 2%
- Common ancestry
- Italian 2% Estonian 1% Slovak 1%
- Foreign-born
- 16% · Canada, Dominican Republic
- Languages at home
- 69% English-only · Spanish 27% Tagalog/Filipino 2% Other Indo-European 2%
Political lean MEDSL · Johnson
- 2024 margin
- Solid R (+51.4) · D 23.9% · R 75.3%
- 2008→2024 swing
- -3.9pp toward R · 2008: -47.5pp · 2024: -51.4pp
- All cycles
- 2024: R+51.4 2020: R+53.0 2016: R+58.3 2012: R+55.6 2008: R+47.5
Not yet ingested
- Civics
- —
Market trends
- HPI YoY
- ▼ -17.86%
- Current HPI
- 237.62
- Rent YoY
- —
- Metro
- —
- State GDP YoY
- ▲ 3.95%
- F500 in state
- 110
Industry mix (Fortune 500 HQ in TX)
| Industry | F500 HQs | Revenue |
|---|---|---|
| Energy | 16 | $1,198B |
|
||
| Technology | 5 | $198B |
|
||
| Engineering / Construction | 4 | $72B |
|
||
| Energy Services | 3 | $60B |
|
||
| Utilities | 3 | $41B |
|
||
| Healthcare | 2 | $330B |
|
||
Price history
+45.9% since first listed12 events — show timeline
- 2026-05-14 Relisted — NTREIS
- 2026-05-06 Contingent — NTREIS
- 2026-04-29 Listed $350,000 NTREIS
- 2012-06-20 Sold (Public Records) — Public Records
- 2012-06-15 Sold (MLS) — NTREIS
- 2012-06-01 Pending — NTREIS
- 2012-05-24 Contingent — NTREIS
- 2012-05-19 Listed $239,900 NTREIS
- 2012-04-11 Listing Removed — NTREIS
- 2011-10-10 Listed $239,900 NTREIS
- 1999-08-12 Sold (Public Records) — Public Records
- 1999-08-12 Sold (Public Records) — Public Records
Property tax history
+4.7%/yrLatest (2025): $8,233 · +18.4% YoY. Source: county tax records.
Cash-flow waterfall
monthlySold comps — $/sqft
last 12 mo · ≤1 miLoading sold comps…