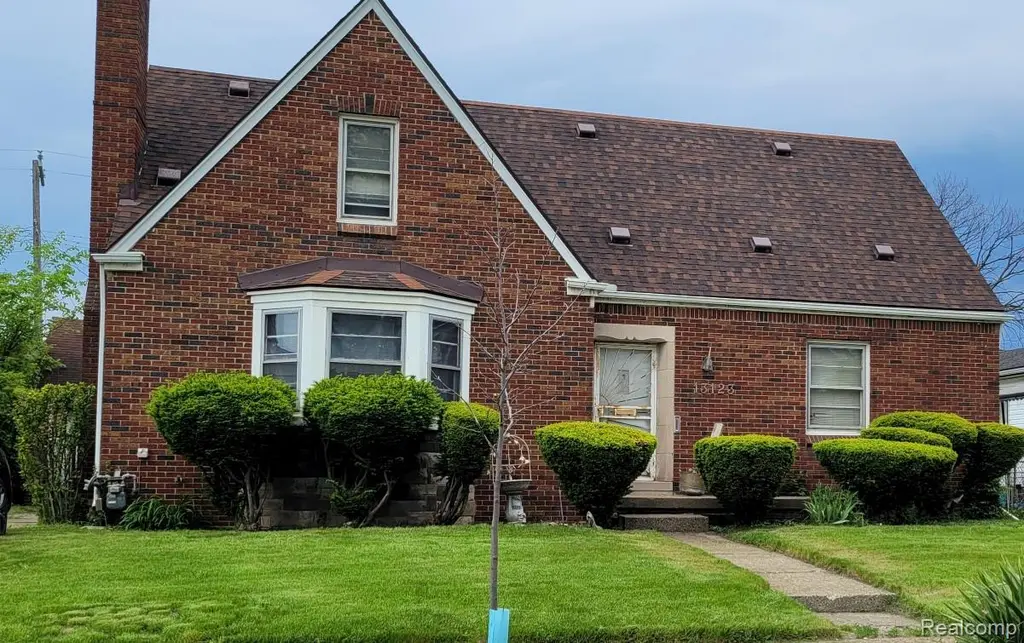
13123 Indiana St · Detroit, MI
Flood risk 1/10 · Minimal
- FEMA flood zone
- X (unshaded)
- Chance of flooding over 30 yrs
- 0.0%
- Est. flood insurance / yr
- $473 – $860
Fire risk 1/10 · Minimal
- Est. fire insurance / yr
- $784 – $1,456
Heat risk 3/10 · Minor
- Hot days now (above 97°F)
- 7 days/yr
- Hot days in 30 yrs
- 15 days/yr
Wind risk 2/10 · Minimal
- Chance of severe wind over 30 yrs
- —
Air-quality risk 3/10 · Minor
- Unhealthy air days now
- 2 days/yr
- Unhealthy air days in 30 yrs
- 5 days/yr
Risk factors via First Street. Map © Google.
Why this score? — see what drove the B+ grade
The composite is a weighted blend of 9 inputs, each scored 0–100. Each bar is that input's sub-score; the figure is the points it added to the 100-point composite (weight × sub-score).
- Cash flow +30.0/30.0
- ARV discount +15.0/15.0
- 1% rule +10.0/10.0
- DSCR +10.0/10.0
- Rent growth +4.0/5.0
- Livability +3.7/5.0
- Condition / age +2.5/5.0
- Schools +1.3/10.0
- Appreciation +0.0/10.0
$80,000
🖨 Deal sheet (PDF) 📄 Offer letter ✓ Due diligence
Listing remarks MLS
Spacious brick house, needs Tender Loving Care and updating. Being sold in "As Is" condition.
Key facts
- 6,970 sq ft lot
- 3 garage spots
- Built 1940
Property features AI
Finance
- Other: Pets allowed: cats and dogs
Exterior
- Parking: Detached garage; 3 garage spaces; Driveway; Garage faces front
- Utilities: Public water; Public sewer; Sewer and water available
- Home design: Single-family residence; One-and-a-half story; Ground-level entry with steps; Brick exterior
- Construction: Built with brick construction; Block foundation; Asphalt roof
- Exterior features: Outdoor lighting; Paved road access; Yard on a 0.16-acre lot (approx. 68 x 100)
Interior
- Bathrooms: 2 full bathrooms
- Heating & cooling: Forced air heating (natural gas); No central air
- Interior features: Gas water heater; Living room fireplace; Unfinished basement; 6 total rooms
Neighborhood map
What this means for you Summary
Snapshot
- This is a 3-bed/2.0-bath single-family listed at $80k.
Deal economics
- At list price, monthly cash flow is $446 ($5k/yr) — positive.
- The deal already cash-flows at list — no discount required.
- Meets the 1% rule at list price ($1k rent vs $80k).
- Recommended offer: $79k (1.5% below list) — sets the bar for market timing.
- Cap rate 13.0% vs local median 10.0% in Detroit — top-decile yield for the area; either an underpriced asset or a hidden risk that comps aren't pricing in. Stress-test before assuming the spread holds.
Location & tenants
- Location reads 73/100 on livability (#218 in MI) — a middle-class / working-renter tenant base. Strengths: amenities A+, commute A+, cost of living A+; Watch: schools F, crime F, employment F.
- Detroit Public Schools Community District (urban): math 10% / reading 24% proficiency, ranked #499 of 540 in MI (top 92%) — low school quality limits family demand, transient renter base, plan for 1-2y turnover; 90% free/reduced lunch — lower-income household profile, screen leases tightly.
- Market conditions: Rents rising fast (+6.1%/yr); 350 active listings in the ZIP; 11 comparable units currently listed for rent nearby; rentals at typical pace (median 26d on market — plan ~3-4 weeks tenant-placement turnaround); 45% of comp listings sitting > 30 days — soft ceiling on asking rent; lower-income renter base — watch delinquency; 2,639 units permitted in Wayne County in 2024 (1,216 in 5+ unit buildings).
- At $1,264/mo this rent would consume 46% of the median local household income ($33k/yr) (locally 2172% of renters already pay >50% of income on rent) — very limited rent-growth headroom before tenants either downsize or default.
Forward outlook
- Local home prices are declining (-3.0%/yr); year-one equity from $553 of loan paydown is wiped out by about $2k of value loss. Plan a longer hold.
- Wayne County population projected at -17% by 2050 — secular population decline; favor cash flow + early exit over multi-decade hold.
- At projected returns (-3.0% appreciation + 6.1% rent growth), your $22k cash investment doubles in ~5 years — after that, you're playing with house money.
Negotiation context
- It's been on market 29 days — a 2% lower offer ($79k) is reasonable based on typical stale-listing flexibility.
- 3 sale attempts since 18y ago; this cycle's ask has dropped $10k (11%) from the opening price — seller is motivated, your offer sets the floor, not the list.
- Current owner paid $45k; list at $80k implies a 78% gain — meaningful room to come down on a strong offer.
Risks & watch-outs
- Watch-outs: built in 1940 — expect roof / HVAC / electrical / plumbing capex.
Questions for the listing agent
- Built in 1940 — when were the roof, HVAC, electrical panel, plumbing, and water heater last replaced?
- Is there a deadline driving the sale (1031 exchange, divorce, estate, relocation)? That informs how much negotiation room exists.
- Schools are F-rated, which usually means shorter tenancies and higher turnover. Who's the typical renter profile here, and what's been the actual vacancy rate?
- Crime grade is F in this area — have there been break-ins, vandalism, or insurance claims at this property in the last 3 years? What carrier currently insures it and at what premium?
- What's the average days-on-market for RENTAL listings here right now (not sales)? A rising rental-DOM trend means longer vacancies and softer asking-rent achievability than the comps imply.
- What's the recent tenant-quality profile in this submarket — average credit score on applications, eviction rate, late-payment / NSF rate, and stable-employment percentage? A property-management company in the area should have these aggregated.
- How much new for-sale + rental construction is in the pipeline within 1–3 miles? Heavy new supply typically softens prices + rents 12–24 months out; constrained supply supports both.
Investment metrics
- 1% rule
- 1.58% ✓
- Cap rate
- 12.98%
- Cash-on-cash
- 23.87%
- DSCR
- 2.06
- GRM
- 5.3
CMA / ARV
- ARV (on-the-fly)
- $127,472
- Comps found
- 12
Show comp detail 12 sales within ~0.75 mi
| Address | Dist | Beds/Ba | Sqft | Sold | Price | $/sf | Match |
|---|---|---|---|---|---|---|---|
| 13166 Washburn St | 0.14mi | 3/1.5 | 1,839 (-11%) | 8mo | $105,300 | $57 | 68 |
| 12795 Ilene St | 0.22mi | 3/1.5 | 1,753 (-15%) | 7mo | $148,900 | $85 | 58 |
| 13120 Griggs St | 0.24mi | 3/2.0 | 1,900 (-8%) | 23mo | $132,500 | $70 | 57 |
| 3151 Ewald Cir | 0.63mi | 3/1.5 | 2,185 (+6%) | 2mo | $127,000 | $58 | 56 |
| 14011 Ohio St | 0.43mi | 4/2.0 (+1) | 1,856 (-10%) | 3mo | $115,000 | $62 | 56 |
| 3276 Oakman Blvd | 0.66mi | 4/2.5 (+1) | 2,061 (+0%) | 11mo | $134,700 | $65 | 52 |
| 13606 Northlawn St | 0.35mi | 4/2.0 (+1) | 1,790 (-13%) | 8mo | $104,999 | $59 | 51 |
| 11891 Wisconsin St | 0.50mi | 4/1.5 (+1) | 1,878 (-9%) | 15mo | $28,000 | $15 | 43 |
| 12770 Monte Vista St | 0.46mi | 3/2.0 | 1,764 (-14%) | 18mo | $47,000 | $27 | 40 |
| 3044 Oakman Blvd | 0.67mi | 3/2.0 | 1,802 (-12%) | 18mo | $145,595 | $81 | 33 |
| 3383 Ewald Cir | 0.66mi | 3/2.5 | 1,846 (-10%) | 23mo | $187,000 | $101 | 31 |
| 12645 Monte Vista St | 0.52mi | 4/1.0 (+1) | 1,750 (-15%) | 24mo | $70,000 | $40 | 22 |
Match score weights: distance 35% · size 25% · config 20% · recency 20%. Top-matched comps best support the ARV.
Projected returns pro-forma
-3.0% appreciation · 6.14% rent growth · sell at horizon
- IRR
- 20.6%
- Equity multiple
- 1.87×
- Total profit
- $19,549
- Equity at exit
- $11,928
- IRR
- 30.8%
- Equity multiple
- 4.20×
- Total profit
- $71,665
- Equity at exit
- $6,917
Cash invested: $22,400 (down + closing). Projections, not guarantees.
Landlord ↔ Tenant lean methodology
- Overall (STATE)
- 62 Landlord-Friendly
- State Michigan
- 62 Landlord-Friendly · EVEN
- County
- — inherits STATE
- City
- — inherits STATE
ZIP-level market 48238
- Home prices YoY
- -14.4%
- Rents YoY
- 6.1%
- Active inventory
- 350
- Price-to-rent
- 5.3×
Monthly cashflow live
- Estimated rent
- $1,264 high interval (Pro) →
- Mortgage (P&I)
- −$420
- Tax est. 1.5%
- −$100 /mo · $1,200/yr
- Insurance
- −$33
- HOA
- −$0
- Vacancy / Maint / Mgmt
- −$265
- Net cashflow
- $446
Break-even live
Sensitivity live
| Price | -10% $501 | -5% $473 | +0% $446 | +5% $418 | +10% $390 |
|---|---|---|---|---|---|
| Rent | -10% $346 | -5% $396 | +0% $446 | +5% $495 | +10% $545 |
| Rate | -1.0pp $486 | -0.5pp $466 | base $446 | +0.5pp $425 | +1.0pp $404 |
UW: 25.0% down · 7.5% · 30yr · 1.5% tax · 5.0% vac · 8.0% maint · 8.0% mgmt
Financing live
Cash to close
- Down payment
- $20,000
- Closing costs
- $2,400
- Reserves months
- —
- Total cash needed
- —
Loan-product check · same deal, 3 products live
Conventional
25% down · 7.5% · 30yr
- Down + closing
- —
- Monthly P&I
- —
- Monthly cashflow
- —
- DSCR
- —
- Eligible?
- —
Personal DTI + credit; lowest rate.
DSCR
20% down · 8.5% · 30yr
- Down + closing
- —
- Monthly P&I
- —
- Monthly cashflow
- —
- DSCR
- —
- Eligible?
- —
No personal income docs; deal must DSCR.
Hard money
10% down · 12.0% · 12mo
- Down + closing
- —
- Monthly P&I
- —
- Monthly cashflow
- —
- DSCR
- —
- Eligible?
- —
Short-term bridge; refi at stabilization.
Rent comps 11 comps
| Address | Beds | Baths | Sqft | Rent | $/sqft | DOM | Units | Dist |
|---|---|---|---|---|---|---|---|---|
| 12650 Griggs St Detroit, MI | 3.0 | 2.0 | 1628 | $1,375 | $0.84 | 26d | 1 | 0.30mi |
| 13910 Kentucky St Detroit, MI | 2.0 | 1.0 | 1680 | $1,000 | $0.60 | 45d | 1 | 0.33mi |
| 12303 Cloverlawn St Detroit, MI | 3.0 | 1.5 | 1454 | $1,400 | $0.96 | 45d | 1 | 0.42mi |
| 14242 Ohio St Detroit, MI | 4.0 | 1.0 | 1400 | $1,000 | $0.71 | 45d | 1 | 0.59mi |
| Ohio St Unit 4 Detroit, MI | 4.0 | 1.5 | 1400 | $750 | $0.54 | 45d | 1 | 0.78mi |
| 12123 Santa Rosa Dr Detroit, MI | 2.0 | 1.0 | 1680 | $1,000 | $0.60 | 26d | 1 | 0.89mi |
| 4341 Glendale St Detroit, MI | 4.0 | 2.5 | 1832 | $1,680 | $0.92 | 6d | 1 | 1.09mi |
| 12546 Broadstreet Ave Detroit, MI | 3.0 | 1.5 | 1899 | $1,250 | $0.66 | 46d | 1 | 1.11mi |
| 4046 Tyler St Detroit, MI | 2.0 | 1.0 | 2378 | $1,050 | $0.44 | 14d | 1 | 1.22mi |
| 3747 Tyler St Detroit, MI | 3.0 | 1.0 | 2600 | $1,700 | $0.65 | 25d | 1 | 1.37mi |
| 15457 Cloverlawn St Detroit, MI | 3.0 | 2.0 | 1500 | $1,275 | $0.85 | 26d | 1 | 1.49mi |
Listing history 20 events
-
2026-06-21days on market $80,000 Active 29 DOM
-
2026-06-18days on market $80,000 Active 26 DOM
-
2026-06-17pricedays on market $80,000 Active 25 DOM
-
2026-06-15days on market $90,000 Active 23 DOM
-
2026-06-13days on market $90,000 Active 21 DOM
-
2026-06-13days on market $90,000 Active 20 DOM
-
2026-06-09days on market $90,000 Active 17 DOM
-
2026-06-08days on market $90,000 Active 16 DOM
-
2026-06-07days on market $90,000 Active 15 DOM
-
2026-06-04days on market $90,000 Active 12 DOM
-
2026-06-03days on market $90,000 Active 11 DOM
-
2026-06-02days on market $90,000 Active 10 DOM
-
2026-06-01days on market $90,000 Active 9 DOM
-
2026-05-31days on market $90,000 Active 8 DOM
-
2026-05-22$90,000 Active
Show marketing remark (103 chars)
Spacious brick house, needs Tender Loving Care and updating. Being sold in "As Is" condition.
-
2026-05-22$90,000 Active 103-char remark
Show marketing remark (103 chars)
Spacious brick house, needs Tender Loving Care and updating. Being sold in "As Is" condition.
-
2009-03-09soldstatus $45,000
-
2009-01-14soldstatus $12,200 212-char remark
Show marketing remark (212 chars)
BANK OWNED SELL AS IS. AN EXCELLENT INVESTMENT PROPERTY, GREAT HOME FOR FIRST TIME BUYERS. BUYER RESPONSIBLE TO ORDER AND PAY FOR CITY INSPECTION ACR & FINAL WATER BILL. ALSO PAY ERA $295.00 FEE AT CLOSING.
-
2008-11-07$12,000 212-char remark
Show marketing remark (212 chars)
BANK OWNED SELL AS IS. AN EXCELLENT INVESTMENT PROPERTY, GREAT HOME FOR FIRST TIME BUYERS. BUYER RESPONSIBLE TO ORDER AND PAY FOR CITY INSPECTION ACR & FINAL WATER BILL. ALSO PAY ERA $295.00 FEE AT CLOSING.
-
2000-07-31soldstatus $36,700
ⓘ Source: listings_history table (triggers on properties + properties_extension) + one-shot
backfill from property_details.listing_events for pre-trigger history.
Climate risk First Street
- Flood 1/10 Low FEMA zone X (unshaded) · 0% chance over 30 yrs
- Wildfire 1/10 Low
- Heat 3/10 Moderate 7 d/yr ≥97°F today · 15 d/yr by 30 yrs out
- Wind 2/10 Low
- Air quality 3/10 Moderate 2 unhealthy d/yr today · 5 by 30 yrs out
Nearby sold comps map
Loading sold comps map…
Walkable amenities ~0.75 mi
Loading nearby amenities…
Taxation est. · year 1
- Rental income
- $15,165
- − Mortgage interest
- −$4,481
- − Property taxes
- −$1,200
- − Insurance
- −$400
- − Repairs & maintenance
- −$1,213
- − Management
- −$1,213
- − Depreciation
- −$2,327
- Taxable income
- $4,330
- Est. tax owed @ 24.0%
- −$1,039
- After-tax cash flow
- $4,307/yr
For passive investors: Depreciation is non-cash, so a rental often shows a tax loss while cash-flowing — sheltering income. Rental losses are passive: they offset passive income freely, and up to $25,000/yr can offset ordinary (W-2) income if you actively participate and your MAGI is under $100k (phasing out to $0 by $150k); unused losses carry forward. On sale, claimed depreciation is recaptured at up to 25%, and gains may owe capital-gains tax (a 1031 exchange can defer both). Figures are a year-1 estimate at your 24.0% rate — not tax advice; consult a CPA.
Schools (NCES district)
- District
- Detroit Public Schools Community District
- NCES district ID
- 2601103
- Math proficiency
- 10% ▼ -2.00%
- Reading proficiency
- 24% ▲ 6.00%
- Median HH income
- $25,815
- Composite
- 13.06/100
- National rank
- #9564
- State rank
- #499 of 540 in MI
Livability — Detroit
- Score
- 73/100
- State rank
- #218
- US rank
- #5427
Category grades
Schools grade is shown separately in the Schools card above.
Census & demographics
- Census place
- Detroit, MI
- County
- Wayne County · 1,562,939 people
- City population
- 572,865
- Metro
- Detroit-Warren-Dearborn, MI
- Population (ZIP)
- 24,731
- Household income
- $33,315
- Rent vs Own
- Severe rent burden
- 2172.0
Population outlook (Wayne County) Hauer SSP2
- Today (2025)
- 1,675,273 people
- By 2030
- 1,620,300 · -3.3%
- By 2040
- 1,502,341 · -10.3%
- By 2050
- 1,384,039 · -17.4%
- By 2075
- 1,124,592 · -32.9%
- By 2100
- 881,193 · -47.4%
Race, ethnicity, and origin ACS 2023
- Neighborhood character
- Predominantly Black (94%)
- Race & ethnicity
- Black 94% Two or more races 3% White 1%
- Foreign-born
- 1%
Political lean MEDSL · Wayne
- 2024 margin
- Strong D (+29.0) · D 62.7% · R 33.7% · Other 3.6%
- 2008→2024 swing
- -20.5pp toward R · 2008: 49.5pp · 2024: 29.0pp
- All cycles
- 2024: D+29.0 2020: D+38.1 2016: D+37.3 2012: D+46.9 2008: D+49.5
Not yet ingested
- Civics
- —
Market trends
- HPI YoY
- ▼ -31.96%
- Current HPI
- 189.6227
- Rent YoY
- ▲ 6.14%
- Metro
- Detroit-Warren-Dearborn, MI
- State GDP YoY
- ▲ 1.37%
- F500 in state
- 28
Industry mix (Fortune 500 HQ in MI)
| Industry | F500 HQs | Revenue |
|---|---|---|
| Automotive Parts | 3 | $48B |
|
||
| Automotive | 2 | $372B |
|
||
| Chemicals | 1 | $45B |
|
||
| Automotive Retail | 1 | $29B |
|
||
| Healthcare / Medical Devices | 1 | $23B |
|
||
| Automotive Technology | 1 | $20B |
|
||
Price history
+145.2% since first listed6 events — show timeline
- 2026-05-22 Listed $90,000 MiRealSource-MiMLS
- 2026-05-22 Listed $90,000 REALCOMP
- 2009-03-09 Sold (Public Records) $45,000 Public Records
- 2009-01-14 Sold (MLS) $12,200 REALCOMP
- 2008-11-07 Listed $12,000 REALCOMP
- 2000-07-31 Sold (Public Records) $36,700 Public Records
Property tax history
-14.4%/yrLatest (2025): $130 · -95.0% YoY. Source: county tax records.
Cash-flow waterfall
monthlySold comps — $/sqft
last 12 mo · ≤1 miLoading sold comps…