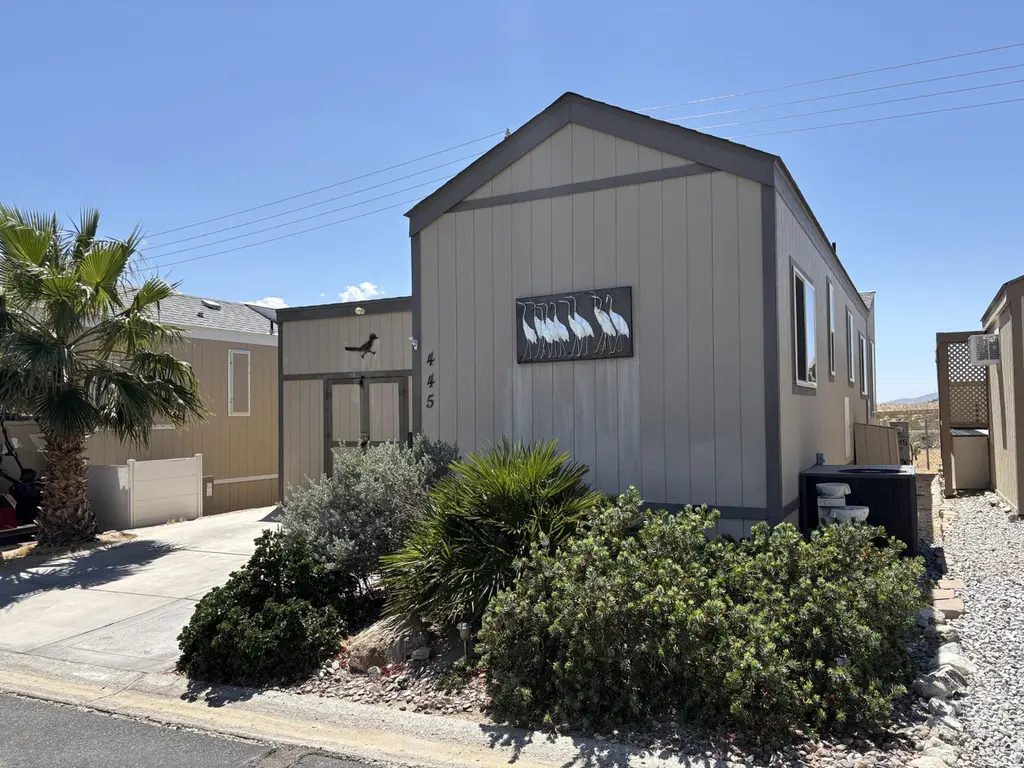
70200 Dillon Rd #445 · Desert Edge, CA
Flood risk 1/10 · Minimal
- FEMA flood zone
- A
- Chance of flooding over 30 yrs
- 0.0%
- Est. flood insurance / yr
- $1,009 – $1,996
Fire risk 5/10 · Moderate
- Est. fire insurance / yr
- $659 – $1,223
Heat risk 8/10 · Major
- Hot days now (above 109°F)
- 6 days/yr
- Hot days in 30 yrs
- 16 days/yr
Wind risk 1/10 · Minimal
- Chance of severe wind over 30 yrs
- —
Air-quality risk 5/10 · Moderate
- Unhealthy air days now
- 6 days/yr
- Unhealthy air days in 30 yrs
- 8 days/yr
Risk factors via First Street. Map © Google.
Why this score? — see what drove the B grade
The composite is a weighted blend of 9 inputs, each scored 0–100. Each bar is that input's sub-score; the figure is the points it added to the 100-point composite (weight × sub-score).
- Cash flow +30.0/30.0
- 1% rule +10.0/10.0
- DSCR +10.0/10.0
- ARV discount +7.5/15.0
- Condition / age +4.0/5.0
- Livability +3.4/5.0
- Schools +2.7/10.0
- Rent growth +2.5/5.0
- Appreciation +0.0/10.0
$99,900
🖨 Deal sheet 📄 Offer letter ✓ Due diligence
Listing remarks
Experience elevated desert living at Caliente Springs, a sought-after 55+ RV resort offering an exceptional lifestyle and resort-style amenities including hot mineral spring pools and spas, a scenic 9-hole golf course, pickleball and tennis courts, fitness center, and a vibrant social calendar filled with year-round activities. This beautifully maintained 2014 Cavco Park Model home showcases breathtaking panoramic desert and mountain views with unforgettable sunsets right from your doorstep. Thoughtfully designed and meticulously cared for, this 1 bedroom, 1 bathroom residence features attractive flooring throughout the main living areas and an abundance of natural light. The bright and wel
Key facts
- Private deck
- Fitness center
- Garage
Tags
Property features AI
Finance
- Other: Rental restrictions apply; Short-term rentals allowed; Accepted listing terms include cash and cash to new loan
- HOA & community: No monthly association fee listed
Exterior
- Parking: Driveway parking (1 space, uncovered)
- Security: Gated community security
- Utilities: Septic tank
- Home design: One-level (single-story); Park model mobile home; Manager approval required; Cavco manufacturer
- Construction: Park model construction
- Exterior features: Located in a gated, senior community; Community pool (in-ground); Community heated spa (in-ground); Panoramic desert and mountain views; Detached property; Lot is not owned (lot not included)
Interior
- Kitchen: Propane cooktop; Microwave; Refrigerator
- Flooring: Carpet; Ceramic tile
- Bathrooms: One 3/4 bathroom
- Heating & cooling: Central heating; Central air conditioning; Ceiling fan(s)
- Interior features: Blinds on windows; Sliding doors; Ground-level entry with steps; Furnished
Neighborhood map
What this means for you Summary
Snapshot
- This is a 1-bed/1.0-bath manufactured listed at $100k. Condition is rated good.
Deal economics
- At list price, monthly cash flow is $692 ($8k/yr) — positive.
- The deal already cash-flows at list — no discount required.
- Meets the 1% rule at list price ($2k rent vs $100k).
- Recommended offer: $98k (1.5% below list) — sets the bar for market timing.
Location & tenants
- Location reads 68/100 on livability (#297 in CA) — a middle-class / working-renter tenant base. Strengths: cost of living A+, housing A+; Watch: crime C-, schools F, commute D-.
- Palm Springs Unified (suburban): math 21% / reading 42% proficiency, ranked #328 of 517 in CA (top 63%) — families likely to look elsewhere, expect single-tenant / working-renter base with shorter leases; 73% free/reduced lunch — lower-income household profile, screen leases tightly.
- Market conditions: 216 active listings in the ZIP; 2 comparable units currently listed for rent nearby; 9,195 units permitted in Riverside County in 2024 (1,512 in 5+ unit buildings).
Forward outlook
- Local home prices are declining (-3.0%/yr); year-one equity from $691 of loan paydown is wiped out by about $3k of value loss. Plan a longer hold.
- Riverside County population projected at +22% by 2050 — long-run rental-demand tailwind backs the buy-and-hold thesis.
- At projected returns (-3.0% appreciation + 3.0% rent growth), your $28k cash investment doubles in ~5 years — after that, you're playing with house money.
Negotiation context
- It's been on market 26 days — a 2% lower offer ($98k) is reasonable based on typical stale-listing flexibility.
- 4 sale attempts with the ask held roughly flat each time — persistent listings suggest the price (not the market) is what's stuck; bring a comps-based counter.
Risks & watch-outs
- Watch-outs: flood insurance adds $125/mo.
- Climate carrying-cost: in FEMA flood zone A (mandatory federal flood insurance); moderate wildfire risk; extreme-heat days projected 6→16/yr by 2055 (HVAC capex compounding) — expect insurance premiums to compound above CPI over the hold.
Questions for the listing agent
- What's the actual annual flood-insurance premium (NFIP or private), and is the property in a SFHA with mandatory coverage?
- Is there a deadline driving the sale (1031 exchange, divorce, estate, relocation)? That informs how much negotiation room exists.
- Schools are F-rated, which usually means shorter tenancies and higher turnover. Who's the typical renter profile here, and what's been the actual vacancy rate?
- What's the average days-on-market for RENTAL listings here right now (not sales)? A rising rental-DOM trend means longer vacancies and softer asking-rent achievability than the comps imply.
- What's the recent tenant-quality profile in this submarket — average credit score on applications, eviction rate, late-payment / NSF rate, and stable-employment percentage? A property-management company in the area should have these aggregated.
- How much new for-sale + rental construction is in the pipeline within 1–3 miles? Heavy new supply typically softens prices + rents 12–24 months out; constrained supply supports both.
Investment metrics
- 1% rule
- 1.91% ✓
- Cap rate
- 16.10%
- Cash-on-cash
- 35.04%
- DSCR
- 2.56
- GRM
- 4.4
CMA / ARV
- ARV (on-the-fly)
- $64,800
- Comps found
- 12
Show comp detail 12 sales within ~0.75 mi
| Address | Dist | Beds/Ba | Sqft | Sold | Price | $/sf | Match |
|---|---|---|---|---|---|---|---|
| 70200 Dillon Rd #215 | 0.00mi | 1/1.0 | 600 (0%) | 4mo | $65,000 | $108 | 97 |
| 70200 Dillon Rd #605 | 0.00mi | 1/1.0 | 600 (0%) | 5mo | $97,500 | $163 | 96 |
| 70200 Dillon Rd #36 | 0.00mi | 1/1.0 | 600 (0%) | 8mo | $65,000 | $108 | 94 |
| 70200 Dillon Rd #446 | 0.11mi | 2/1.5 (+1) | 600 (0%) | 4mo | $75,000 | $125 | 84 |
| 70200 Dillon Rd #97 | 0.27mi | 1/1.0 | 600 (0%) | 4mo | $20,500 | $34 | 84 |
| 70200 Dillon Rd #499 | 0.00mi | 1/1.0 | 650 (+8%) | 3mo | $100,000 | $154 | 83 |
| 70200 Dillon Rd #590 | 0.27mi | 2/1.0 (+1) | 625 (+4%) | 4mo | $61,500 | $98 | 72 |
| 70200 Dillon Rd #384 | 0.00mi | 2/2.0 (+1) | 670 (+12%) | 4mo | $57,000 | $85 | 68 |
| 17850 Corkill Rd #31 | 0.53mi | 2/1.0 (+1) | 600 (0%) | 5mo | $25,000 | $42 | 66 |
| 70200 Dillon Rd #654 | 0.27mi | 2/1.0 (+1) | 550 (-8%) | 3mo | $97,500 | $177 | 66 |
| 70200 Dillon Rd #146 | 0.27mi | 1/1.0 | 675 (+12%) | 4mo | $49,000 | $73 | 64 |
| 69548 Crestview Dr | 0.73mi | 2/2.0 (+1) | 672 (+12%) | 3mo | $90,000 | $134 | 34 |
Match score weights: distance 35% · size 25% · config 20% · recency 20%. Top-matched comps best support the ARV.
Projected returns pro-forma
-3.0% appreciation · 3.0% rent growth · sell at horizon
- IRR
- 24.2%
- Equity multiple
- 2.00×
- Total profit
- $27,968
- Equity at exit
- $14,895
- IRR
- 32.1%
- Equity multiple
- 3.91×
- Total profit
- $81,505
- Equity at exit
- $8,638
Cash invested: $27,972 (down + closing). Projections, not guarantees.
Landlord ↔ Tenant lean methodology
- Overall (STATE)
- 18 Strongly Tenant-Friendly
- State California
- 18 Strongly Tenant-Friendly · D+13
- County
- — inherits STATE
- City
- — inherits STATE
ZIP-level market 92241
- Home prices YoY
- -22.8%
- Active inventory
- 216
- Price-to-rent
- 4.4×
Monthly cashflow live
- Estimated rent
- $1,908 medium interval (Pro) →
- Mortgage (P&I)
- −$524
- Tax est. 1.5%
- −$125 /mo · $1,498/yr
- Insurance
- −$42
- Flood insurance flood zone
- −$125 /mo · $1,502/yr
- HOA
- −$0
- Vacancy / Maint / Mgmt
- −$401
- Net cashflow
- $692
Break-even live
UW: 25.0% down · 7.5% · 30yr · 1.5% tax · 5.0% vac · 8.0% maint · 8.0% mgmt
Financing live
Cash to close
- Down payment
- $24,975
- Closing costs
- $2,997
- Reserves months
- —
- Total cash needed
- —
Loan-product check · same deal, 3 products live
Conventional
25% down · 7.5% · 30yr
- Down + closing
- —
- Monthly P&I
- —
- Monthly cashflow
- —
- DSCR
- —
- Eligible?
- —
Personal DTI + credit; lowest rate.
DSCR
20% down · 8.5% · 30yr
- Down + closing
- —
- Monthly P&I
- —
- Monthly cashflow
- —
- DSCR
- —
- Eligible?
- —
No personal income docs; deal must DSCR.
Hard money
10% down · 12.0% · 12mo
- Down + closing
- —
- Monthly P&I
- —
- Monthly cashflow
- —
- DSCR
- —
- Eligible?
- —
Short-term bridge; refi at stabilization.
Rent comps 2 comps
| Address | Beds | Baths | Sqft | Rent | $/sqft | DOM | Units | Dist |
|---|---|---|---|---|---|---|---|---|
| 70875 Dillon Rd Desert Hot Springs, CA | 2.0 | 2.0 | 720 | $2,200 | $3.06 | 44d | 1 | 0.70mi |
| 15935 Mary Cir Desert Hot Springs, CA | 1.0 | 1.0 | 550 | $1,350 | $2.45 | 18d | 1 | 1.47mi |
Listing history 23 events
-
2026-06-18days on market $99,900 Active 26 DOM
-
2026-06-17days on market $99,900 Active 25 DOM
-
2026-06-16days on market $99,900 Active 24 DOM
-
2026-06-15days on market $99,900 Active 23 DOM
-
2026-06-13days on market $99,900 Active 21 DOM
-
2026-06-13days on market $99,900 Active 20 DOM
-
2026-06-09days on market $99,900 Active 17 DOM
-
2026-06-08days on market $99,900 Active 16 DOM
-
2026-06-07days on market $99,900 Active 15 DOM
-
2026-06-04days on market $99,900 Active 12 DOM
-
2026-06-03days on market $99,900 Active 11 DOM
-
2026-06-02days on market $99,900 Active 10 DOM
-
2026-06-01days on market $99,900 Active 9 DOM
-
2026-05-31days on market $99,900 Active 8 DOM
-
2026-05-22$99,900 Active
-
2026-05-02historical
-
2026-04-13price $89,900
-
2026-03-23price $95,000
-
2026-01-09historical
-
2026-01-08$105,000 Active
-
2025-11-01historical
-
2025-11-01$115,000 Active
-
2025-08-01$125,000 Active
ⓘ Source: listings_history table (triggers on properties + properties_extension) + one-shot
backfill from property_details.listing_events for pre-trigger history.
Climate risk First Street
- Flood 1/10 Low FEMA zone A · 0% chance over 30 yrs
- Wildfire 5/10 Major
- Heat 8/10 Severe 6 d/yr ≥109°F today · 16 d/yr by 30 yrs out
- Wind 1/10 Low
- Air quality 5/10 Major 6 unhealthy d/yr today · 8 by 30 yrs out
Nearby sold comps map
Loading sold comps map…
Walkable amenities ~0.75 mi
Loading nearby amenities…
Taxation est. · year 1
- Rental income
- $22,895
- − Mortgage interest
- −$5,596
- − Property taxes
- −$1,498
- − Insurance
- −$2,002
- − Repairs & maintenance
- −$1,832
- − Management
- −$1,832
- − Depreciation
- −$2,906
- Taxable income
- $7,229
- Est. tax owed @ 24.0%
- −$1,735
- After-tax cash flow
- $6,565/yr
For passive investors: Depreciation is non-cash, so a rental often shows a tax loss while cash-flowing — sheltering income. Rental losses are passive: they offset passive income freely, and up to $25,000/yr can offset ordinary (W-2) income if you actively participate and your MAGI is under $100k (phasing out to $0 by $150k); unused losses carry forward. On sale, claimed depreciation is recaptured at up to 25%, and gains may owe capital-gains tax (a 1031 exchange can defer both). Figures are a year-1 estimate at your 24.0% rate — not tax advice; consult a CPA.
Condition & rehab AI · 13 photos
This 2014 Cavco Park Model home in Caliente Springs is in good condition with a good condition score of 80. It has a good roof, exterior, flooring, interior walls/paint, windows, foundation/structure, HVAC/mechanicals, and landscaping/curb appeal. The home is move-in ready with minor cosmetic updates needed to enhance its curb appeal and resale value.
Value-add opportunities
- Both Paint exterior — Enhances curb appeal and resale value
- Both Replace outdoor furniture — Freshens up the outdoor space and adds value
- Resale Upgrade kitchen appliances — Modernizes the kitchen and appeals to potential buyers
Renovation cost estimate screening
Value-add ROI direction
- Both Paint exterior — Enhances curb appeal and resale value ↑
- Both Replace outdoor furniture — Freshens up the outdoor space and adds value ↑
- Resale Upgrade kitchen appliances — Modernizes the kitchen and appeals to potential buyers ↑
ⓘ Cost ranges are severity-bucket heuristics (US national rule-of-thumb). Get contractor quotes + a written scope before underwriting a rehab budget.
Schools (NCES district)
- District
- Palm Springs Unified
- NCES district ID
- 0629550
- Math proficiency
- 21% ▼ -7.00%
- Reading proficiency
- 42% ▬ 0.00%
- Median HH income
- $43,638
- Composite
- 26.76/100
- National rank
- #7131
- State rank
- #328 of 517 in CA
Livability — Desert Edge
- Score
- 68/100
- State rank
- #297
- US rank
- #9953
Category grades
Schools grade is shown separately in the Schools card above.
Census & demographics
- Census place
- Desert Edge, CA
- Population (ZIP)
- 8,624
Population outlook (Riverside County) Hauer SSP2
- Today (2025)
- 2,664,475 people
- By 2030
- 2,802,692 · +5.2%
- By 2040
- 3,050,904 · +14.5%
- By 2050
- 3,256,783 · +22.2%
- By 2075
- 3,655,058 · +37.2%
- By 2100
- 3,766,594 · +41.4%
Race, ethnicity, and origin ACS 2023
- Race & ethnicity
- White 50% Hispanic / Latino 46% Two or more races 16% Asian 2% Native American 1%
- Hispanic origin (detail)
- Mexican 36%
- Common ancestry
- Lithuanian 3% Slovak 2% Portuguese 2%
- Foreign-born
- 28% · Canada, South Korea
- Languages at home
- 57% English-only · Spanish 38% Chinese 1% Russian/Polish/Slavic 1%
Political lean MEDSL · Riverside
- 2024 margin
- Toss-up / Even · D 48.0% · R 49.3% · Other 2.6%
- 2008→2024 swing
- -3.6pp toward R · 2008: 2.3pp · 2024: -1.3pp
- All cycles
- 2024: R+1.3 2020: D+8.0 2016: D+4.3 2012: R+0.4 2008: D+2.3
Not yet ingested
- Civics
- —
Market trends
- HPI YoY
- ▼ -118.23%
- Current HPI
- 400.5663
- Rent YoY
- —
- Metro
- —
- State GDP YoY
- ▲ 3.21%
- F500 in state
- 116
Industry mix (Fortune 500 HQ in CA)
| Industry | F500 HQs | Revenue |
|---|---|---|
| Technology | 27 | $1,492B |
|
||
| Financial Services | 3 | $174B |
|
||
| Retail | 3 | $44B |
|
||
| Insurance | 3 | $26B |
|
||
| Media / Entertainment | 2 | $115B |
|
||
| Pharmaceuticals / Biotech | 2 | $62B |
|
||
Price history
-20.1% since first listed9 events — show timeline
- 2026-05-22 Listed $99,900 GPSMLS
- 2026-05-02 Listing Removed — GPSMLS
- 2026-04-13 Price Changed $89,900 GPSMLS
- 2026-03-23 Price Changed $95,000 GPSMLS
- 2026-01-09 Listing Removed — GPSMLS
- 2026-01-08 Listed $105,000 GPSMLS
- 2025-11-01 Listing Removed — GPSMLS
- 2025-11-01 Listed $115,000 GPSMLS
- 2025-08-01 Listed $125,000 GPSMLS
Cash-flow waterfall
monthlySold comps — $/sqft
last 12 mo · ≤1 miLoading sold comps…