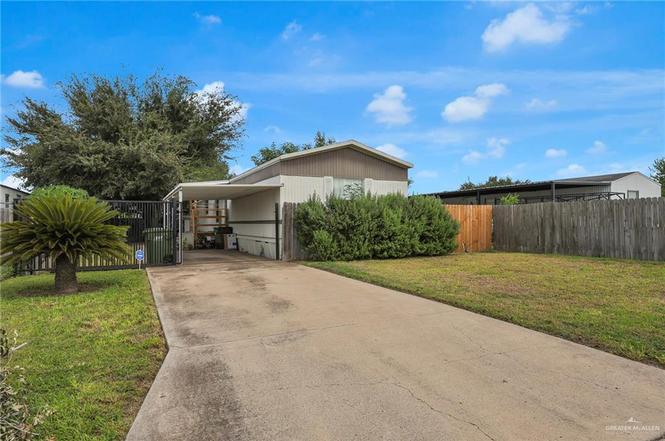
806 Post Oak Dr · Alamo, TX
Flood risk 6/10 · Moderate
- FEMA flood zone
- X (shaded)
- Chance of flooding over 30 yrs
- 0.68%
- Est. flood insurance / yr
- $507 – $1,088
Fire risk 4/10 · Minor
- Est. fire insurance / yr
- $1,222 – $2,270
Heat risk 9/10 · Severe
- Hot days now (above 111°F)
- 7 days/yr
- Hot days in 30 yrs
- 23 days/yr
Wind risk 8/10 · Major
- Chance of severe wind over 30 yrs
- 99.0%
Air-quality risk 1/10 · Minimal
- Unhealthy air days now
- 0 days/yr
- Unhealthy air days in 30 yrs
- 0 days/yr
Risk factors via First Street. Map © Google.
Why this score? — see what drove the D grade
The composite is a weighted blend of 9 inputs, each scored 0–100. Each bar is that input's sub-score; the figure is the points it added to the 100-point composite (weight × sub-score).
- Cash flow +20.5/30.0
- DSCR +6.5/10.0
- 1% rule +5.6/10.0
- Livability +3.1/5.0
- Rent growth +2.5/5.0
- Condition / age +2.5/5.0
- Schools +1.1/10.0
- ARV discount +0.0/15.0
- Appreciation +0.0/10.0
$109,000
🖨 Deal sheet 📄 Offer letter ✓ Due diligence
Listing remarks
Discover this well-maintained 3-bedroom, 2-bath home offering 1,216 sq ft of comfortable living space. Nestled in an excellent location near I-2, shopping centers, restaurants, schools, and more! Convenience is at your doorstep. Property highlights include: Spacious split-layout with 3 bedrooms and 2 full baths; One-car carport with gated driveway access; Privacy fence on all three sides for added security; Mature trees providing shade and curb appeal; Handy storage buildings for extra space; Easy access to major roads, dining, and retail. Whether you're a first-time buyer, downsizing, or investing, this home checks all the boxes. Schedule your showing today!
Key facts
- Easy access
- Privacy fence
- Storage buildings
Tags
Neighborhood map
What this means for you Summary
Snapshot
- This is a 3-bed/2.0-bath manufactured listed at $109k.
Deal economics
- At list price, monthly cash flow is $144 ($2k/yr) — positive.
- The deal already cash-flows at list — no discount required.
- Meets the 1% rule at list price ($1k rent vs $109k).
- Recommended offer: $96k (12.0% below list) — sets the bar for market timing.
- Cap rate 7.9% vs local median 3.7% in Alamo — top-decile yield for the area; either an underpriced asset or a hidden risk that comps aren't pricing in. Stress-test before assuming the spread holds.
Location & tenants
- Location reads 62/100 on livability (#916 in TX) — a middle-class / working-renter tenant base. Strengths: cost of living A+, housing A+, health & safety A+; Watch: commute D+, crime F, amenities F.
- Donna ISD (suburban): math 11% / reading 18% proficiency, ranked #821 of 826 in TX (top 99%) — low school quality limits family demand, transient renter base, plan for 1-2y turnover.
- Zoned schools: Capt D Salinas Ii El (math 16% / reading 17%, grade F, #3,946 of 4,322 statewide, top 92%, 416 students, 96% FRL); A P Solis Middle (math 8% / reading 19%, grade F, #1,602 of 1,662 statewide, top 97%, 666 students, 93% FRL); Donna H S (math 16% / reading 21%, grade F, #1,436 of 1,632 statewide, top 88%, 2,095 students, 92% FRL) — zoned schools average 94% FRL vs 48% district-wide (45 pts higher); higher-poverty schools than district average — tighter screening recommended.
- Market conditions: 350 active listings in the ZIP; 12 comparable units currently listed for rent nearby; rentals at typical pace (median 23d on market — plan ~3-4 weeks tenant-placement turnaround); 42% of comp listings sitting > 30 days — soft ceiling on asking rent; 7,378 units permitted in Hidalgo County in 2024 (641 in 5+ unit buildings).
Forward outlook
- Local home prices are declining (-3.0%/yr); year-one equity from $754 of loan paydown is wiped out by about $3k of value loss. Plan a longer hold.
- Hidalgo County population projected at +28% by 2050 — long-run rental-demand tailwind backs the buy-and-hold thesis.
Negotiation context
- It's been on market 171 days — a 12% lower offer ($96k) is reasonable based on typical stale-listing flexibility.
Risks & watch-outs
- Climate carrying-cost: major flood risk; severe wind risk, 99% chance of damaging wind over 30y; extreme-heat days projected 7→23/yr by 2055 (HVAC capex compounding) — expect insurance premiums to compound above CPI over the hold.
Questions for the listing agent
- It's been on market 171 days. Have you received any prior offers? Is the seller open to a 12% concession, seller financing, or rate buy-down credit?
- Why hasn't it sold? Are there any deal-killer items the seller is aware of (foundation, flood, title, zoning, code violations)?
- Is there a deadline driving the sale (1031 exchange, divorce, estate, relocation)? That informs how much negotiation room exists.
- Schools are D-rated, which usually means shorter tenancies and higher turnover. Who's the typical renter profile here, and what's been the actual vacancy rate?
- Crime grade is F in this area — have there been break-ins, vandalism, or insurance claims at this property in the last 3 years? What carrier currently insures it and at what premium?
- The area grade is low — what's the realistic commute time and amenity access for the typical tenant pool here? Any planned neighborhood developments (good or bad) we should know about?
- What's the average days-on-market for RENTAL listings here right now (not sales)? A rising rental-DOM trend means longer vacancies and softer asking-rent achievability than the comps imply.
- What's the recent tenant-quality profile in this submarket — average credit score on applications, eviction rate, late-payment / NSF rate, and stable-employment percentage? A property-management company in the area should have these aggregated.
- How much new for-sale + rental construction is in the pipeline within 1–3 miles? Heavy new supply typically softens prices + rents 12–24 months out; constrained supply supports both.
Investment metrics
- 1% rule
- 1.06% ✓
- Cap rate
- 7.88%
- Cash-on-cash
- 5.67%
- DSCR
- 1.25
- GRM
- 7.8
CMA / ARV
- ARV (on-the-fly)
- $72,960
- Comps found
- 1
Show comp detail 1 sale within ~0.75 mi
| Address | Dist | Beds/Ba | Sqft | Sold | Price | $/sf | Match |
|---|---|---|---|---|---|---|---|
| 1001 Las Flores Dr | 0.46mi | 2/2.0 (-1) | 1,174 (-4%) | 6mo | $70,000 | $60 | 63 |
Match score weights: distance 35% · size 25% · config 20% · recency 20%. Top-matched comps best support the ARV.
Projected returns pro-forma
-3.0% appreciation · 3.0% rent growth · sell at horizon
- IRR
- -7.5%
- Equity multiple
- 0.72×
- Total profit
- $-8,448
- Equity at exit
- $16,252
- IRR
- 2.1%
- Equity multiple
- 1.15×
- Total profit
- $4,586
- Equity at exit
- $9,424
Cash invested: $30,520 (down + closing). Projections, not guarantees.
Landlord ↔ Tenant lean methodology
- Overall (STATE)
- 87 Strongly Landlord-Friendly
- State Texas
- 87 Strongly Landlord-Friendly · R+5
- County
- — inherits STATE
- City
- — inherits STATE
ZIP-level market 78516
- Home prices YoY
- -6.5%
- Active inventory
- 350
- Price-to-rent
- 7.8×
Monthly cashflow live
- Estimated rent
- $1,157 high interval (Pro) →
- Mortgage (P&I)
- −$572
- Tax from tax record
- −$153 /mo · $1,837/yr
- Insurance
- −$45
- HOA
- −$0
- Vacancy / Maint / Mgmt
- −$243
- Net cashflow
- $144
Break-even live
UW: 25.0% down · 7.5% · 30yr · 1.5% tax · 5.0% vac · 8.0% maint · 8.0% mgmt
Financing live
Cash to close
- Down payment
- $27,250
- Closing costs
- $3,270
- Reserves months
- —
- Total cash needed
- —
Loan-product check · same deal, 3 products live
Conventional
25% down · 7.5% · 30yr
- Down + closing
- —
- Monthly P&I
- —
- Monthly cashflow
- —
- DSCR
- —
- Eligible?
- —
Personal DTI + credit; lowest rate.
DSCR
20% down · 8.5% · 30yr
- Down + closing
- —
- Monthly P&I
- —
- Monthly cashflow
- —
- DSCR
- —
- Eligible?
- —
No personal income docs; deal must DSCR.
Hard money
10% down · 12.0% · 12mo
- Down + closing
- —
- Monthly P&I
- —
- Monthly cashflow
- —
- DSCR
- —
- Eligible?
- —
Short-term bridge; refi at stabilization.
Rent comps 12 comps
| Address | Beds | Baths | Sqft | Rent | $/sqft | DOM | Units | Dist |
|---|---|---|---|---|---|---|---|---|
| 312 E Crockett Ave Alamo, TX | 2.0 | 1.0 | 700 | $699 | $1.00 | 43d | 1 | 0.36mi |
| 311 E Crockett Ave Unit 9 Alamo, TX | 2.0 | 1.0 | 700 | $900 | $1.29 | 43d | 1 | 0.62mi |
| 311 E Crockett Ave Apt 54 Alamo, TX | 2.0 | 1.0 | 700 | $699 | $1.00 | 23d | 1 | 0.65mi |
| 311 E Crockett Ave Unit 21 Alamo, TX | 2.0 | 1.0 | 700 | $699 | $1.00 | 43d | 1 | 0.65mi |
| 428 E Acacia Ave Unit 4 Alamo, TX | 3.0 | 2.0 | 1040 | $1,300 | $1.25 | 23d | 1 | 0.76mi |
| 436 E Acacia Ave Alamo, TX | 3.0 | 2.0 | 1130 | $1,225 | $1.08 | 14d | 1 | 0.76mi |
| 444 E Acacia Ave Unit 3 Alamo, TX | 3.0 | 2.0 | 1107 | $1,300 | $1.17 | 23d | 1 | 0.77mi |
| 438 Alma Ave Alamo, TX | 4.0 | 2.0 | 1392 | $1,600 | $1.15 | 14d | 1 | 1.02mi |
| 837 S 13th St Alamo, TX | 2.0 | 1.5 | 1104 | $1,095 | $0.99 | 14d | 1 | 1.10mi |
| 913 S 13th St Unit 1 Alamo, TX | 2.0 | 2.0 | 1008 | $1,050 | $1.04 | 43d | 1 | 1.16mi |
| 504 San Antonio Cir Alamo, TX | 3.0 | 2.0 | 1216 | $1,600 | $1.32 | 14d | 1 | 1.46mi |
| 422 S Val Verde Rd Unit 186 Donna, TX | 3.0 | 2.0 | 960 | $850 | $0.89 | 43d | 1 | 1.46mi |
Listing history 5 events
-
2026-04-03status Pending
-
2026-03-27historical Option
-
2026-01-06price $109,000
-
2025-10-13$119,000 Active
-
2001-08-30soldstatus
ⓘ Source: listings_history table (triggers on properties + properties_extension) + one-shot
backfill from property_details.listing_events for pre-trigger history.
Tax reassessment forecast TX · Resets to sale price
- Current annual tax
- $1,837 · $153/mo
- Projected year-2 tax
- $1,995 · $166/mo
- Expected delta
- +$157/yr (+$13/mo · 8.6%)
ⓘ Screening estimate from a state-policy table — verify with the county assessor before closing.
Climate risk First Street
- Flood 6/10 Major FEMA zone X (shaded) · 68% chance over 30 yrs
- Wildfire 4/10 Moderate
- Heat 9/10 Extreme 7 d/yr ≥111°F today · 23 d/yr by 30 yrs out
- Wind 8/10 Severe 99% chance of damaging wind over 30 yrs
- Air quality 1/10 Low 0 unhealthy d/yr today · 0 by 30 yrs out
Nearby sold comps map
Loading sold comps map…
Walkable amenities ~0.75 mi
Loading nearby amenities…
Taxation est. · year 1
- Rental income
- $13,889
- − Mortgage interest
- −$6,106
- − Property taxes
- −$1,837
- − Insurance
- −$545
- − Repairs & maintenance
- −$1,111
- − Management
- −$1,111
- − Depreciation
- −$3,171
- Taxable income
- $8
- Est. tax owed @ 24.0%
- −$2
- After-tax cash flow
- $1,729/yr
For passive investors: Depreciation is non-cash, so a rental often shows a tax loss while cash-flowing — sheltering income. Rental losses are passive: they offset passive income freely, and up to $25,000/yr can offset ordinary (W-2) income if you actively participate and your MAGI is under $100k (phasing out to $0 by $150k); unused losses carry forward. On sale, claimed depreciation is recaptured at up to 25%, and gains may owe capital-gains tax (a 1031 exchange can defer both). Figures are a year-1 estimate at your 24.0% rate — not tax advice; consult a CPA.
Schools (NCES district)
- District
- Donna ISD
- NCES district ID
- 4817390
- Math proficiency
- 11% ▼ -30.00%
- Reading proficiency
- 18% ▼ -13.00%
- Median HH income
- $27,330
- Composite
- 11.16/100
- National rank
- #9728
- State rank
- #821 of 826 in TX
Livability — Alamo
- Score
- 62/100
- State rank
- #916
- US rank
- #16356
Category grades
Schools grade is shown separately in the Schools card above.
Census & demographics
- Census place
- Alamo, TX
- County
- Hidalgo County · 623,128 people
- City population
- 34,370
- Metro
- McAllen-Edinburg-Mission, TX
- Population (ZIP)
- 34,370
- Household income
- $53,229
- Rent vs Own
- Severe rent burden
- 476.0
Population outlook (Hidalgo County) Hauer SSP2
- Today (2025)
- 955,232 people
- By 2030
- 1,009,774 · +5.7%
- By 2040
- 1,120,332 · +17.3%
- By 2050
- 1,225,036 · +28.2%
- By 2075
- 1,439,189 · +50.7%
- By 2100
- 1,533,429 · +60.5%
Race, ethnicity, and origin ACS 2023
- Neighborhood character
- Predominantly Hispanic (89%)
- Race & ethnicity
- Hispanic / Latino 89% Two or more races 40% White 10% Black 1%
- Hispanic origin (detail)
- Mexican 86%
- Foreign-born
- 29% · Canada
- Languages at home
- 24% English-only · Spanish 76%
Political lean MEDSL · Hidalgo
- 2024 margin
- Toss-up / Even · D 48.1% · R 51.0%
- 2008→2024 swing
- -41.6pp toward R · 2008: 38.7pp · 2024: -2.9pp
- All cycles
- 2024: R+2.9 2020: D+17.1 2016: D+40.5 2012: D+41.8 2008: D+38.7
Not yet ingested
- Civics
- —
Market trends
- HPI YoY
- ▼ -15.56%
- Current HPI
- 225.4438
- Rent YoY
- —
- Metro
- McAllen-Edinburg-Mission, TX
- State GDP YoY
- ▲ 3.95%
- F500 in state
- 110
Industry mix (Fortune 500 HQ in TX)
| Industry | F500 HQs | Revenue |
|---|---|---|
| Energy | 16 | $1,198B |
|
||
| Technology | 5 | $198B |
|
||
| Engineering / Construction | 4 | $72B |
|
||
| Energy Services | 3 | $60B |
|
||
| Utilities | 3 | $41B |
|
||
| Healthcare | 2 | $330B |
|
||
Price history
-8.4% since first listed5 events — show timeline
- 2026-04-03 Pending — MCALLENMLS
- 2026-03-27 Contingent — MCALLENMLS
- 2026-01-06 Price Changed $109,000 MCALLENMLS
- 2025-10-13 Listed $119,000 MCALLENMLS
- 2001-08-30 Sold (Public Records) — Public Records
Property tax history
+6.1%/yrLatest (2025): $1,837 · +9.3% YoY. Source: county tax records.
Cash-flow waterfall
monthlySold comps — $/sqft
last 12 mo · ≤1 miLoading sold comps…