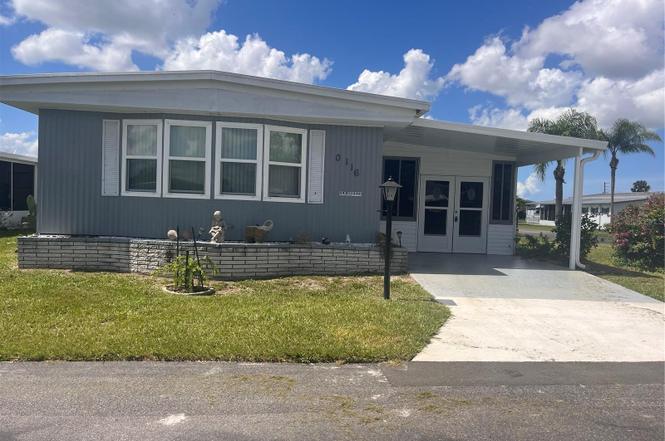
5316 53rd Ave E Unit Q116 · Bradenton, FL
Flood risk 4/10 · Minor
- FEMA flood zone
- X (unshaded)
- Chance of flooding over 30 yrs
- 0.22%
- Est. flood insurance / yr
- $507 – $1,088
Fire risk 1/10 · Minimal
- Est. fire insurance / yr
- $947 – $1,759
Heat risk 10/10 · Severe
- Hot days now (above 108°F)
- 7 days/yr
- Hot days in 30 yrs
- 30 days/yr
Wind risk 10/10 · Severe
- Chance of severe wind over 30 yrs
- 99.0%
Air-quality risk 2/10 · Minimal
- Unhealthy air days now
- 1 days/yr
- Unhealthy air days in 30 yrs
- 1 days/yr
Risk factors via First Street. Map © Google.
Why this score? — see what drove the B grade
The composite is a weighted blend of 9 inputs, each scored 0–100. Each bar is that input's sub-score; the figure is the points it added to the 100-point composite (weight × sub-score).
- Cash flow +25.1/30.0
- ARV discount +14.9/15.0
- 1% rule +8.8/10.0
- DSCR +8.2/10.0
- Schools +4.4/10.0
- Livability +4.0/5.0
- Condition / age +2.5/5.0
- Rent growth +2.3/5.0
- Appreciation +0.0/10.0
$150,000
🖨 Deal sheet 📄 Offer letter ✓ Due diligence
Listing remarks
Furnished and ready to move into 2 bedroom and 2 bath unit in good condition. Laminate flooring through out whole unit. Large front family room has a pass thru window from the kitchen. Kitchen and dining room are very convenient to each other for your cooking and dining pleasure. Living room just off dining area and it opens up to the family room to provide lots of space for your family and friends. The main bedroom has a walk-in closet and a separate private bath with a walk-in shower. The second bath has a tub/shower. There is an enclosed lanai just behind the covered carport to provide you even more living space. The laundry room is behind the lanai and has the washer and dryer and a lau
Key facts
- Laminate flooring
- Walk-in closet
- Private bath
Tags
Property features AI
Finance
- Other: Deed restrictions; Association recreation owned
- Financial info: Total monthly association fee $332 (total annual fees $3,984); Lease restrictions apply
- HOA & community: Community called Lou Paul with required monthly HOA ($332); HOA includes cable TV, pool, internet, grounds maintenance, management, private road, sewer, trash, water; Community amenities: clubhouse, pool, recreation facilities, shuffleboard court, storage, community mailbox; Buyer/association approval required; Senior community; Pet restrictions (number and size limits)
Exterior
- Parking: Carport (1 space)
- Utilities: Public water; Public sewer; Electricity connected; Cable connected; BB/HS internet available; Water connected; Sewer connected
- Home design: Manufactured double-wide home; Single story; Faces east; Crawlspace foundation
- Construction: Membrane roof; Other construction materials
- Exterior features: Private mailbox; Asphalt road access
Interior
- Kitchen: Dishwasher; Microwave; Range; Refrigerator
- Bedrooms: 2 bedrooms
- Flooring: Laminate
- Bathrooms: 2 full bathrooms
- Heating & cooling: Central heating; Central air conditioning
- Interior features: Ceiling fans
- Laundry & utility: Laundry area (other)
Neighborhood map
What this means for you Summary
Snapshot
- This is a 2-bed/1.0-bath manufactured listed at $150k.
Deal economics
- At list price, monthly cash flow is $329 ($4k/yr) — positive.
- The deal already cash-flows at list — no discount required.
- Meets the 1% rule at list price ($2k rent vs $150k).
- Recommended offer: $132k (12.0% below list) — sets the bar for market timing.
- Cap rate 8.9% vs local median 3.6% in Bradenton — top-decile yield for the area; either an underpriced asset or a hidden risk that comps aren't pricing in. Stress-test before assuming the spread holds.
Location & tenants
- Location reads 81/100 on livability (#101 in FL, #1,528 nationally) — a professional / high-income tenant draw. Strengths: commute A+, cost of living A+, housing A+; Watch: employment D+, crime D, amenities F.
- Manatee (suburban): math 54% / reading 50% proficiency, ranked #26 of 73 in FL (top 36%) — acceptable for families but not a draw, mixed tenant base, ~2y average lease.
- Market conditions: Rents soft (-1.0%/yr); 384 active listings in the ZIP; 21 comparable units currently listed for rent nearby; rentals at typical pace (median 24d on market — plan ~3-4 weeks tenant-placement turnaround); 7,472 units permitted in Manatee County in 2024 (1,782 in 5+ unit buildings).
- This rent runs 35% of the median local income ($71k/yr) — at the standard rent-burdened threshold; future hikes will face affordability resistance.
Forward outlook
- Local home prices are declining (-3.0%/yr); year-one equity from $1k of loan paydown is wiped out by about $4k of value loss. Plan a longer hold.
- Manatee County population projected at +43% by 2050 — long-run rental-demand tailwind backs the buy-and-hold thesis.
Negotiation context
- It's been on market 355 days — a 12% lower offer ($132k) is reasonable based on typical stale-listing flexibility.
- 6 sale attempts since 5y ago; this cycle's ask has dropped $35k (19%) from the opening price — seller is motivated, your offer sets the floor, not the list.
- Current owner paid $72k; list at $150k implies a 110% gain — meaningful room to come down on a strong offer.
Risks & watch-outs
- Climate carrying-cost: severe wind risk, 99% chance of damaging wind over 30y; extreme-heat days projected 7→30/yr by 2055 (HVAC capex compounding) — expect insurance premiums to compound above CPI over the hold.
Questions for the listing agent
- It's been on market 355 days. Have you received any prior offers? Is the seller open to a 12% concession, seller financing, or rate buy-down credit?
- Built in 1978 — when were the roof, HVAC, electrical panel, plumbing, and water heater last replaced?
- What does the HOA fee cover, when was the last increase, and are there any pending special assessments or reserve-fund shortfalls?
- Why hasn't it sold? Are there any deal-killer items the seller is aware of (foundation, flood, title, zoning, code violations)?
- Is there a deadline driving the sale (1031 exchange, divorce, estate, relocation)? That informs how much negotiation room exists.
- Crime grade is D in this area — have there been break-ins, vandalism, or insurance claims at this property in the last 3 years? What carrier currently insures it and at what premium?
- What's the average days-on-market for RENTAL listings here right now (not sales)? A rising rental-DOM trend means longer vacancies and softer asking-rent achievability than the comps imply.
- What's the recent tenant-quality profile in this submarket — average credit score on applications, eviction rate, late-payment / NSF rate, and stable-employment percentage? A property-management company in the area should have these aggregated.
- How much new for-sale + rental construction is in the pipeline within 1–3 miles? Heavy new supply typically softens prices + rents 12–24 months out; constrained supply supports both.
Investment metrics
- 1% rule
- 1.38% ✓
- Cap rate
- 8.92%
- Cash-on-cash
- 9.40%
- DSCR
- 1.42
- GRM
- 6.1
CMA / ARV
- ARV (on-the-fly)
- $179,360
- Comps found
- 12
Show comp detail 12 sales within ~0.75 mi
| Address | Dist | Beds/Ba | Sqft | Sold | Price | $/sf | Match |
|---|---|---|---|---|---|---|---|
| 5316 53rd Ave E Unit K12 | 0.15mi | 2/1.5 | 1,216 (+3%) | 1mo | $130,000 | $107 | 85 |
| 5316 53rd Ave E Unit X7 | 0.15mi | 2/2.0 | 1,215 (+3%) | 3mo | $155,000 | $128 | 82 |
| 5316 53rd Ave E Unit C20 | 0.05mi | 2/2.0 | 1,323 (+12%) | 1mo | $150,000 | $113 | 73 |
| 5316 53rd Ave E Unit N9 | 0.22mi | 2/2.0 | 1,056 (-10%) | 3mo | $160,000 | $152 | 66 |
| 5316 53rd Ave E Unit L1 | 0.19mi | 2/2.0 | 1,056 (-10%) | 5mo | $175,000 | $166 | 65 |
| 5707 45th St E #180 | 0.54mi | 2/2.0 | 1,125 (-5%) | 4mo | $225,000 | $200 | 59 |
| 5707 45th St E #253 | 0.54mi | 2/2.0 | 1,115 (-6%) | 3mo | $174,900 | $157 | 59 |
| 5316 53rd Ave E Unit A43 | 0.20mi | 3/2.0 (+1) | 1,344 (+14%) | 4mo | $70,000 | $52 | 55 |
| 5707 45th St E #136 | 0.54mi | 2/2.0 | 1,100 (-7%) | 6mo | $150,000 | $136 | 55 |
| 5707 45th St E #98 | 0.54mi | 2/2.0 | 1,290 (+9%) | 1mo | $165,000 | $128 | 54 |
| 5707 45th St E #158 | 0.54mi | 2/2.0 | 1,042 (-12%) | 3mo | $170,000 | $163 | 49 |
| 5707 45th St E #143 | 0.54mi | 3/2.0 (+1) | 1,352 (+15%) | 1mo | $218,000 | $161 | 40 |
Match score weights: distance 35% · size 25% · config 20% · recency 20%. Top-matched comps best support the ARV.
Projected returns pro-forma
-3.0% appreciation · 0.0% rent growth · sell at horizon
- IRR
- -6.1%
- Equity multiple
- 0.78×
- Total profit
- $-9,207
- Equity at exit
- $22,365
- IRR
- -1.5%
- Equity multiple
- 0.91×
- Total profit
- $-3,624
- Equity at exit
- $12,969
Cash invested: $42,000 (down + closing). Projections, not guarantees.
Landlord ↔ Tenant lean methodology
- Overall (STATE)
- 87 Strongly Landlord-Friendly
- State Florida
- 87 Strongly Landlord-Friendly · R+3
- County
- — inherits STATE
- City
- — inherits STATE
ZIP-level market 34203
- Home prices YoY
- -24.5%
- Rents YoY
- -1.0%
- Active inventory
- 384
- Price-to-rent
- 6.1×
Monthly cashflow live
- Estimated rent
- $2,064 high interval (Pro) →
- Mortgage (P&I)
- −$787
- Tax from tax record
- −$121 /mo · $1,446/yr
- Insurance
- −$62
- HOA
- −$332
- Vacancy / Maint / Mgmt
- −$433
- Net cashflow
- $329
Break-even live
UW: 25.0% down · 7.5% · 30yr · 1.5% tax · 5.0% vac · 8.0% maint · 8.0% mgmt
Financing live
Cash to close
- Down payment
- $37,500
- Closing costs
- $4,500
- Reserves months
- —
- Total cash needed
- —
Loan-product check · same deal, 3 products live
Conventional
25% down · 7.5% · 30yr
- Down + closing
- —
- Monthly P&I
- —
- Monthly cashflow
- —
- DSCR
- —
- Eligible?
- —
Personal DTI + credit; lowest rate.
DSCR
20% down · 8.5% · 30yr
- Down + closing
- —
- Monthly P&I
- —
- Monthly cashflow
- —
- DSCR
- —
- Eligible?
- —
No personal income docs; deal must DSCR.
Hard money
10% down · 12.0% · 12mo
- Down + closing
- —
- Monthly P&I
- —
- Monthly cashflow
- —
- DSCR
- —
- Eligible?
- —
Short-term bridge; refi at stabilization.
Rent comps 21 comps
| Address | Beds | Baths | Sqft | Rent | $/sqft | DOM | Units | Dist |
|---|---|---|---|---|---|---|---|---|
| 5316 53rd Ave E Unit Q111 Bradenton, FL | 2.0 | 2.0 | 1056 | $1,495 | $1.42 | 10d | 1 | 0.02mi |
| 5616 Gentle Breeze St Bradenton, FL | 2.0 | 2.0 | 1100 | $1,700 | $1.55 | 23d | 1 | 0.16mi |
| 5650 Simonton St Bradenton, FL | 2.0 | 2.5 | 1496 | $2,095 | $1.40 | 3d | 1 | 0.22mi |
| 5635 Whitehead St Bradenton, FL | 2.0 | 2.5 | 1496 | $2,300 | $1.54 | 23d | 1 | 0.25mi |
| 5707 45th St E #19 Bradenton, FL | 2.0 | 2.0 | 972 | $1,700 | $1.75 | 23d | 1 | 0.55mi |
| 5515 Fair Oaks St Unit 5515 Bradenton, FL | 2.0 | 2.0 | 1004 | $2,000 | $1.99 | 23d | 1 | 0.83mi |
| 5016 Misty Canal Pl Bradenton, FL | 2.0 | 2.5 | 1080 | $1,950 | $1.81 | 23d | 1 | 0.86mi |
| 4540 Runabout Way Bradenton, FL | 2.0 | 2.5 | 1080 | $2,300 | $2.13 | 23d | 1 | 0.87mi |
| 5414 Fair Oaks St Unit 10-D Bradenton, FL | 2.0 | 2.0 | 1004 | $1,995 | $1.99 | 3d | 1 | 0.89mi |
| 6503 Fairway Gardens Dr Unit Available Bradenton, FL | 2.0 | 2.0 | 1346 | $2,200 | $1.63 | 23d | 1 | 0.89mi |
| 6501 Stone River Rd Unit Available Bradenton, FL | 2.0 | 2.0 | 1118 | $2,200 | $1.97 | 23d | 1 | 0.96mi |
| 6501 Stone River Rd Bradenton, FL | 2.0 | 2.0 | 1080 | $2,820 | $2.61 | 16d | 2 | 0.96mi |
| 6505 Stone River Rd Bradenton, FL | 2.0 | 2.0 | 1080 | $2,825 | $2.62 | 16d | 3 | 1.04mi |
| 6758 Fairview Ter Bradenton, FL | 2.0 | 2.0 | 1346 | $2,300 | $1.71 | 23d | 1 | 1.22mi |
| 3645 Ali ala LOOP Braden River, FL | 1.0 | 1.0 | 950 | $1,400 | $1.47 | 23d | 1 | 1.23mi |
| 6713 Stone River Rd #202 Bradenton, FL | 2.0 | 2.0 | 1232 | $1,900 | $1.54 | 23d | 1 | 1.24mi |
| 6807 Stone River Rd #202 Bradenton, FL | 2.0 | 2.0 | 1292 | $3,500 | $2.71 | 16d | 1 | 1.26mi |
| 3880 Palm Isle Pl Bradenton, FL | 1.0–2.0 | 1.0–2.0 | 1042 | $2,499 | $2.40 | 1d | 13 | 1.27mi |
| 4815 Woodbrook Dr Sarasota, FL | 2.0 | 2.0 | 1080 | $2,290 | $2.12 | 3d | 1 | 1.29mi |
| 6870 Fairview Ter #6870 Bradenton, FL | 2.0 | 2.0 | 1346 | $2,200 | $1.63 | 16d | 1 | 1.31mi |
| 6872 Fairview Ter #101 Bradenton, FL | 2.0 | 2.0 | 1352 | $2,000 | $1.48 | 23d | 1 | 1.31mi |
HOA detail
- Monthly dues
- $332 · $3,984/yr
Listing history 31 events
-
2026-06-18days on market $150,000 Active 355 DOM
-
2026-06-17days on market $150,000 Active 354 DOM
-
2026-06-16days on market $150,000 Active 353 DOM
-
2026-06-15days on market $150,000 Active 352 DOM
-
2026-06-13days on market $150,000 Active 350 DOM
-
2026-06-13days on market $150,000 Active 349 DOM
-
2026-06-10days on market $150,000 Active 347 DOM
-
2026-06-09days on market $150,000 Active 346 DOM
-
2026-06-08days on market $150,000 Active 345 DOM
-
2026-06-08days on market $150,000 Active 344 DOM
-
2026-06-03days on market $150,000 Active 340 DOM
-
2026-06-02days on market $150,000 Active 339 DOM
-
2026-06-01days on market $150,000 Active 338 DOM
-
2026-05-31days on market $150,000 Active 337 DOM
-
2026-04-10status Active
-
2026-04-01historical
-
2026-03-23price $150,000
-
2026-01-27price $160,000
-
2025-12-02price $165,000
-
2025-08-08price $175,000
-
2025-06-19$185,000 Active
-
2024-09-16status Active
-
2024-08-30status Pending
-
2024-08-09$189,000 Active
-
2022-04-08historical
-
2021-11-01status Active
-
2021-10-26status Pending
-
2021-08-21$189,900 Active
-
2007-05-15soldstatus $71,500
-
2000-07-25soldstatus $52,200
-
1998-10-30soldstatus $21,000
ⓘ Source: listings_history table (triggers on properties + properties_extension) + one-shot
backfill from property_details.listing_events for pre-trigger history.
Tax reassessment forecast FL · Resets to sale price
- Current annual tax
- $1,446 · $121/mo
- Projected year-2 tax
- $1,446 · $121/mo
- Expected delta
- $0/yr ($0/mo · 0.0%)
ⓘ Screening estimate from a state-policy table — verify with the county assessor before closing.
Climate risk First Street
- Flood 4/10 Moderate FEMA zone X (unshaded) · 22% chance over 30 yrs
- Wildfire 1/10 Low
- Heat 10/10 Extreme 7 d/yr ≥108°F today · 30 d/yr by 30 yrs out
- Wind 10/10 Extreme 99% chance of damaging wind over 30 yrs
- Air quality 2/10 Low 1 unhealthy d/yr today · 1 by 30 yrs out
Nearby sold comps map
Loading sold comps map…
Walkable amenities ~0.75 mi
Loading nearby amenities…
Taxation est. · year 1
- Rental income
- $24,769
- − Mortgage interest
- −$8,402
- − Property taxes
- −$1,446
- − Insurance
- −$750
- − Repairs & maintenance
- −$1,982
- − Management
- −$1,982
- − HOA
- −$3,984
- − Depreciation
- −$4,364
- Taxable income
- $1,860
- Est. tax owed @ 24.0%
- −$446
- After-tax cash flow
- $3,502/yr
For passive investors: Depreciation is non-cash, so a rental often shows a tax loss while cash-flowing — sheltering income. Rental losses are passive: they offset passive income freely, and up to $25,000/yr can offset ordinary (W-2) income if you actively participate and your MAGI is under $100k (phasing out to $0 by $150k); unused losses carry forward. On sale, claimed depreciation is recaptured at up to 25%, and gains may owe capital-gains tax (a 1031 exchange can defer both). Figures are a year-1 estimate at your 24.0% rate — not tax advice; consult a CPA.
Schools (NCES district)
- District
- Manatee
- NCES district ID
- 1201230
- Math proficiency
- 54% ▼ -6.00%
- Reading proficiency
- 50% ▼ -2.00%
- Median HH income
- $49,607
- Composite
- 44.43/100
- National rank
- #2806
- State rank
- #26 of 73 in FL
Livability — Bradenton
- Score
- 81/100
- State rank
- #101
- US rank
- #1528
Category grades
Schools grade is shown separately in the Schools card above.
Census & demographics
- County
- Manatee County · 416,364 people
- City population
- 227,091
- Metro
- North Port-Sarasota-Bradenton, FL
- Population (ZIP)
- 40,618
- Household income
- $70,761
- Rent vs Own
- Severe rent burden
- 1469.0
Population outlook (Manatee County) Hauer SSP2
- Today (2025)
- 447,342 people
- By 2030
- 488,911 · +9.3%
- By 2040
- 567,934 · +27.0%
- By 2050
- 637,995 · +42.6%
- By 2075
- 781,970 · +74.8%
- By 2100
- 848,272 · +89.6%
Race, ethnicity, and origin ACS 2023
- Neighborhood character
- Predominantly White (65%)
- Race & ethnicity
- White 65% Hispanic / Latino 19% Two or more races 12% Black 9% Asian 5%
- Hispanic origin (detail)
- Mexican 9% Puerto Rican 3% Cuban 2% Dominican 1%
- Common ancestry
- Lithuanian 3% Romanian 3% Slovak 2%
- Foreign-born
- 17% · Canada, Vietnam, Dominican Republic
- Languages at home
- 76% English-only · Spanish 16% Vietnamese 2% Other Indo-European 1%
Political lean MEDSL · Manatee
- 2024 margin
- Strong R (+23.5) · D 37.9% · R 61.4%
- 2008→2024 swing
- -16.5pp toward R · 2008: -7.0pp · 2024: -23.5pp
- All cycles
- 2024: R+23.5 2020: R+16.1 2016: R+17.1 2012: R+12.5 2008: R+7.0
Not yet ingested
- Civics
- —
Market trends
- HPI YoY
- ▼ -95.87%
- Current HPI
- 295.8871
- Rent YoY
- ▼ -0.97%
- Metro
- North Port-Sarasota-Bradenton, FL
- State GDP YoY
- ▲ 3.28%
- F500 in state
- 36
Industry mix (Fortune 500 HQ in FL)
| Industry | F500 HQs | Revenue |
|---|---|---|
| Industrial Technology | 2 | $29B |
|
||
| Insurance | 2 | $17B |
|
||
| Retail | 1 | $60B |
|
||
| Technology Distribution | 1 | $58B |
|
||
| Homebuilding | 1 | $35B |
|
||
| Technology Manufacturing | 1 | $35B |
|
||
Price history
+614.3% since first listed17 events — show timeline
- 2026-04-10 Relisted — Stellar MLS as Distributed by MLS Grid
- 2026-04-01 Listing Removed — Stellar MLS as Distributed by MLS Grid
- 2026-03-23 Price Changed $150,000 Stellar MLS as Distributed by MLS Grid
- 2026-01-27 Price Changed $160,000 Stellar MLS as Distributed by MLS Grid
- 2025-12-02 Price Changed $165,000 Stellar MLS as Distributed by MLS Grid
- 2025-08-08 Price Changed $175,000 Stellar MLS as Distributed by MLS Grid
- 2025-06-19 Listed $185,000 Stellar MLS as Distributed by MLS Grid
- 2024-09-16 Relisted — Stellar MLS as Distributed by MLS Grid
- 2024-08-30 Pending — Stellar MLS as Distributed by MLS Grid
- 2024-08-09 Listed $189,000 Stellar MLS as Distributed by MLS Grid
- 2022-04-08 Listing Removed — Stellar MLS as Distributed by MLS Grid
- 2021-11-01 Relisted — Stellar MLS as Distributed by MLS Grid
- 2021-10-26 Pending — Stellar MLS as Distributed by MLS Grid
- 2021-08-21 Listed $189,900 Stellar MLS as Distributed by MLS Grid
- 2007-05-15 Sold (Public Records) $71,500 Public Records
- 2000-07-25 Sold (Public Records) $52,200 Public Records
- 1998-10-30 Sold (Public Records) $21,000 Public Records
Property tax history
+5.0%/yrLatest (2025): $1,446 · -3.8% YoY. Source: county tax records.
Cash-flow waterfall
monthlySold comps — $/sqft
last 12 mo · ≤1 miLoading sold comps…