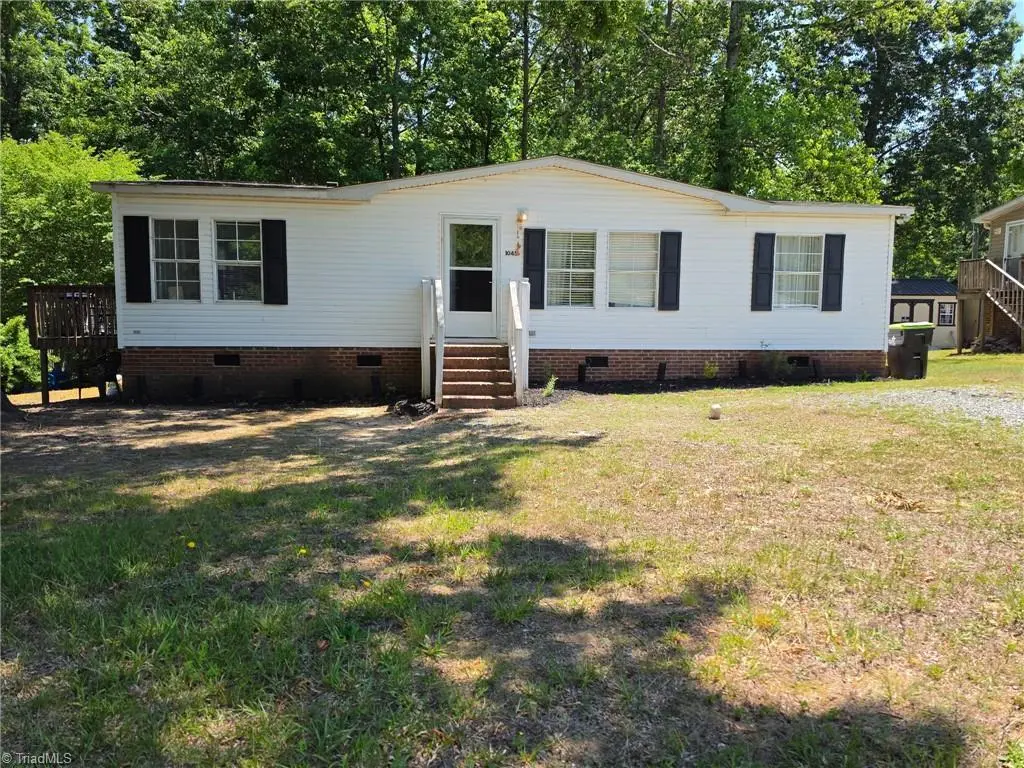
1045 Apple Blossom Ln · Green Level, NC
Flood risk 1/10 · Minimal
- FEMA flood zone
- X (unshaded)
- Chance of flooding over 30 yrs
- 0.0%
- Est. flood insurance / yr
- $507 – $1,088
Fire risk 3/10 · Minor
- Est. fire insurance / yr
- $906 – $1,684
Heat risk 6/10 · Moderate
- Hot days now (above 105°F)
- 7 days/yr
- Hot days in 30 yrs
- 17 days/yr
Wind risk 5/10 · Moderate
- Chance of severe wind over 30 yrs
- 22.0%
Air-quality risk 2/10 · Minimal
- Unhealthy air days now
- 2 days/yr
- Unhealthy air days in 30 yrs
- 2 days/yr
Risk factors via First Street. Map © Google.
Why this score? — see what drove the C+ grade
The composite is a weighted blend of 9 inputs, each scored 0–100. Each bar is that input's sub-score; the figure is the points it added to the 100-point composite (weight × sub-score).
- Cash flow +22.6/30.0
- ARV discount +15.0/15.0
- DSCR +7.2/10.0
- 1% rule +5.0/10.0
- Livability +3.1/5.0
- Schools +3.0/10.0
- Rent growth +2.8/5.0
- Condition / age +2.5/5.0
- Appreciation +0.0/10.0
$164,000
🖨 Deal sheet (PDF) 📄 Offer letter ✓ Due diligence
Listing remarks
1045 Apple Blossom Ln is a 3-bedroom, 2-bathroom home situated on a 0.45-acre lot in the Deer Run community. The interior features an open floor plan and a primary bedroom with an ensuite bath. Located in Alamance County. Sold as-is. Please see agent remarks for showing availability.
Key facts
- Open floor plan
- Deer run community
- Ensuite bath
Tags
Property features AI
Finance
- HOA & community: No homeowners association; Subdivision: Deer Run
Exterior
- Parking: Driveway
- Utilities: Public water; Public sewer; Electric water heater
- Home design: Manufactured double-wide home; Single-story
- Construction: Built in 1998; Vinyl siding; Crawl space foundation
- Exterior features: Public-maintained road access; Lot approximately 0.45 acres; No pool
Interior
- Kitchen: Electric water heater
- Bathrooms: Two full bathrooms
- Heating & cooling: Central air conditioning; Forced air heating (electric)
- Interior features: Primary bedroom located on the main level; Living room fireplace
Neighborhood map
What this means for you Summary
Snapshot
- This is a 3-bed/2.0-bath manufactured listed at $164k.
Deal economics
- At list price, monthly cash flow is $279 ($3k/yr) — positive.
- The deal already cash-flows at list — no discount required.
- To meet the 1% rule (rent ≥ 1% of price), the offer needs to be $163k (0.5% below list).
- Recommended offer: $159k (3.0% below list) — sets the bar for market timing.
Location & tenants
- Location reads 62/100 on livability (#460 in NC) — a middle-class / working-renter tenant base. Strengths: cost of living A+, housing A+, crime B+; Watch: health & safety C-, schools F, amenities F.
- Alamance-Burlington Schools (rural): math 30% / reading 40% proficiency, ranked #133 of 178 in NC (top 75%) — families likely to look elsewhere, expect single-tenant / working-renter base with shorter leases.
- Market conditions: Rents rising (+1.1%/yr); 273 active listings in the ZIP; 2 comparable units currently listed for rent nearby; 2,466 units permitted in Alamance County in 2024 (403 in 5+ unit buildings).
- This rent runs 38% of the median local income ($52k/yr) — at the standard rent-burdened threshold; future hikes will face affordability resistance.
Forward outlook
- Local home prices are declining (-3.0%/yr); year-one equity from $1k of loan paydown is wiped out by about $5k of value loss. Plan a longer hold.
- Alamance County population projected at +19% by 2050 — long-run rental-demand tailwind backs the buy-and-hold thesis.
Negotiation context
- It's been on market 31 days — a 3% lower offer ($159k) is reasonable based on typical stale-listing flexibility.
- 5 sale attempts since 17y ago; this cycle's ask has dropped $10k (6%) from the opening price — seller is motivated, your offer sets the floor, not the list.
- Current owner paid $90k; list at $164k implies a 83% gain — meaningful room to come down on a strong offer.
Risks & watch-outs
- Climate carrying-cost: moderate wind risk, 22% chance of damaging wind over 30y; extreme-heat days projected 7→17/yr by 2055 (HVAC capex compounding) — expect insurance premiums to compound above CPI over the hold.
Questions for the listing agent
- It's been on market 31 days. Have you received any prior offers? Is the seller open to a 3% concession, seller financing, or rate buy-down credit?
- Is there a deadline driving the sale (1031 exchange, divorce, estate, relocation)? That informs how much negotiation room exists.
- Schools are F-rated, which usually means shorter tenancies and higher turnover. Who's the typical renter profile here, and what's been the actual vacancy rate?
- What's the average days-on-market for RENTAL listings here right now (not sales)? A rising rental-DOM trend means longer vacancies and softer asking-rent achievability than the comps imply.
- What's the recent tenant-quality profile in this submarket — average credit score on applications, eviction rate, late-payment / NSF rate, and stable-employment percentage? A property-management company in the area should have these aggregated.
- How much new for-sale + rental construction is in the pipeline within 1–3 miles? Heavy new supply typically softens prices + rents 12–24 months out; constrained supply supports both.
Investment metrics
- 1% rule
- 1.00% ✗
- Cap rate
- 8.34%
- Cash-on-cash
- 7.30%
- DSCR
- 1.32
- GRM
- 8.4
CMA / ARV
- ARV (on-the-fly)
- $206,712
- Comps found
- 2
Show comp detail 2 sales within ~0.75 mi
| Address | Dist | Beds/Ba | Sqft | Sold | Price | $/sf | Match |
|---|---|---|---|---|---|---|---|
| 1034 Apple Blossom Ln | 0.04mi | 3/2.0 | 1,326 (+12%) | 7mo | $140,000 | $106 | 72 |
| 2006 Sam Gwynn Ct | 0.36mi | 3/2.0 | 1,272 (+7%) | 4mo | $220,900 | $174 | 68 |
Match score weights: distance 35% · size 25% · config 20% · recency 20%. Top-matched comps best support the ARV.
Projected returns pro-forma
-3.0% appreciation · 1.06% rent growth · sell at horizon
- IRR
- -7.2%
- Equity multiple
- 0.74×
- Total profit
- $-11,952
- Equity at exit
- $24,453
- IRR
- -0.0%
- Equity multiple
- 1.00×
- Total profit
- $-31
- Equity at exit
- $14,180
Cash invested: $45,920 (down + closing). Projections, not guarantees.
Landlord ↔ Tenant lean methodology
- Overall (STATE)
- 85 Strongly Landlord-Friendly
- State North Carolina
- 85 Strongly Landlord-Friendly · R+3
- County
- — inherits STATE
- City
- — inherits STATE
ZIP-level market 27217
- Home prices YoY
- -22.3%
- Rents YoY
- 1.1%
- Active inventory
- 273
- Price-to-rent
- 8.4×
Monthly cashflow live
- Estimated rent
- $1,633 medium interval (Pro) →
- Mortgage (P&I)
- −$860
- Tax from tax record
- −$82 /mo · $982/yr
- Insurance
- −$68
- HOA
- −$0
- Vacancy / Maint / Mgmt
- −$343
- Net cashflow
- $279
Break-even live
Sensitivity live
| Price | -10% $372 | -5% $326 | +0% $279 | +5% $233 | +10% $187 |
|---|---|---|---|---|---|
| Rent | -10% $151 | -5% $215 | +0% $279 | +5% $344 | +10% $408 |
| Rate | -1.0pp $362 | -0.5pp $321 | base $279 | +0.5pp $237 | +1.0pp $194 |
UW: 25.0% down · 7.5% · 30yr · 1.5% tax · 5.0% vac · 8.0% maint · 8.0% mgmt
Financing live
Cash to close
- Down payment
- $41,000
- Closing costs
- $4,920
- Reserves months
- —
- Total cash needed
- —
Loan-product check · same deal, 3 products live
Conventional
25% down · 7.5% · 30yr
- Down + closing
- —
- Monthly P&I
- —
- Monthly cashflow
- —
- DSCR
- —
- Eligible?
- —
Personal DTI + credit; lowest rate.
DSCR
20% down · 8.5% · 30yr
- Down + closing
- —
- Monthly P&I
- —
- Monthly cashflow
- —
- DSCR
- —
- Eligible?
- —
No personal income docs; deal must DSCR.
Hard money
10% down · 12.0% · 12mo
- Down + closing
- —
- Monthly P&I
- —
- Monthly cashflow
- —
- DSCR
- —
- Eligible?
- —
Short-term bridge; refi at stabilization.
Rent comps 2 comps
| Address | Beds | Baths | Sqft | Rent | $/sqft | DOM | Units | Dist |
|---|---|---|---|---|---|---|---|---|
| 1206 N NC Highway 49 Burlington, NC | 3.0 | 1.0 | 1075 | $1,375 | $1.28 | 22d | 1 | 0.36mi |
| 127 Telegraph Ln Burlington, NC | 3.0 | 2.0 | 1316 | $1,850 | $1.41 | 22d | 1 | 1.43mi |
Listing history 27 events
-
2026-06-19days on market $164,000 Active 31 DOM
-
2026-06-18days on market $164,000 Active 30 DOM
-
2026-06-17days on market $164,000 Active 29 DOM
-
2026-06-16days on market $164,000 Active 28 DOM
-
2026-06-15days on market $164,000 Active 27 DOM
-
2026-06-14days on market $164,000 Active 25 DOM
-
2026-06-13pricedays on market $164,000 Active 24 DOM
-
2026-06-10days on market $174,000 Active 22 DOM
-
2026-06-09days on market $174,000 Active 21 DOM
-
2026-06-08days on market $174,000 Active 20 DOM
-
2026-06-07days on market $174,000 Active 19 DOM
-
2026-06-05days on market $174,000 Active 16 DOM
-
2026-06-02days on market $174,000 Active 14 DOM
-
2026-06-01days on market $174,000 Active 13 DOM
-
2026-05-31days on market $174,000 Active 12 DOM
-
2026-05-30days on market $174,000 Active 11 DOM
-
2026-05-19$174,000 Active
-
2021-04-01historical
-
2021-03-30historical
-
2021-02-22$109,900 Active
-
2021-02-22$109,900
-
2019-06-06soldstatus $89,500
-
2016-03-15historical
-
2014-10-02$59,900
-
2011-08-22historical
-
2009-09-16$71,500
-
1998-08-19soldstatus $19,000
ⓘ Source: listings_history table (triggers on properties + properties_extension) + one-shot
backfill from property_details.listing_events for pre-trigger history.
Tax reassessment forecast NC · Resets to sale price
- Current annual tax
- $982 · $82/mo
- Projected year-2 tax
- $1,345 · $112/mo
- Expected delta
- +$363/yr (+$30/mo · 37.0%)
ⓘ Screening estimate from a state-policy table — verify with the county assessor before closing.
Climate risk First Street
- Flood 1/10 Low FEMA zone X (unshaded) · 0% chance over 30 yrs
- Wildfire 3/10 Moderate
- Heat 6/10 Major 7 d/yr ≥105°F today · 17 d/yr by 30 yrs out
- Wind 5/10 Major 22% chance of damaging wind over 30 yrs
- Air quality 2/10 Low 2 unhealthy d/yr today · 2 by 30 yrs out
Nearby sold comps map
Loading sold comps map…
Walkable amenities ~0.75 mi
Loading nearby amenities…
Taxation est. · year 1
- Rental income
- $19,590
- − Mortgage interest
- −$9,187
- − Property taxes
- −$982
- − Insurance
- −$820
- − Repairs & maintenance
- −$1,567
- − Management
- −$1,567
- − Depreciation
- −$4,771
- Taxable income
- $696
- Est. tax owed @ 24.0%
- −$167
- After-tax cash flow
- $3,187/yr
For passive investors: Depreciation is non-cash, so a rental often shows a tax loss while cash-flowing — sheltering income. Rental losses are passive: they offset passive income freely, and up to $25,000/yr can offset ordinary (W-2) income if you actively participate and your MAGI is under $100k (phasing out to $0 by $150k); unused losses carry forward. On sale, claimed depreciation is recaptured at up to 25%, and gains may owe capital-gains tax (a 1031 exchange can defer both). Figures are a year-1 estimate at your 24.0% rate — not tax advice; consult a CPA.
Schools (NCES district)
- District
- Alamance-Burlington Schools
- NCES district ID
- 3700030
- Math proficiency
- 30% ▼ -6.00%
- Reading proficiency
- 40% ▲ 2.00%
- Median HH income
- $43,359
- Composite
- 29.68/100
- National rank
- #6460
- State rank
- #133 of 178 in NC
Livability — Green Level
- Score
- 62/100
- State rank
- #460
- US rank
- #16840
Category grades
Schools grade is shown separately in the Schools card above.
Census & demographics
- County
- Alamance County · 173,369 people
- Metro
- Burlington, NC
- Population (ZIP)
- 41,406
- Household income
- $51,950
- Rent vs Own
- Severe rent burden
- 1040.0
Population outlook (Alamance County) Hauer SSP2
- Today (2025)
- 173,381 people
- By 2030
- 180,609 · +4.2%
- By 2040
- 194,327 · +12.1%
- By 2050
- 206,158 · +18.9%
- By 2075
- 235,665 · +35.9%
- By 2100
- 258,626 · +49.2%
Race, ethnicity, and origin ACS 2023
- Neighborhood character
- Diverse neighborhood (Simpson 0.69)
- Race & ethnicity
- White 38% Black 29% Hispanic / Latino 29% Two or more races 7% Native American 1%
- Hispanic origin (detail)
- Mexican 19% Puerto Rican 1%
- Common ancestry
- Serbian 2% Italian 1% Slovak 1%
- Foreign-born
- 13% · Canada
- Languages at home
- 75% English-only · Spanish 24%
Political lean MEDSL · Alamance
- 2024 margin
- Lean R (+8.2) · D 45.4% · R 53.5% · Other 1.1%
- 2008→2024 swing
- +1.1pp toward D · 2008: -9.2pp · 2024: -8.2pp
- All cycles
- 2024: R+8.2 2020: R+8.4 2016: R+12.9 2012: R+14.1 2008: R+9.2
Not yet ingested
- Civics
- —
Market trends
- HPI YoY
- ▼ -74.45%
- Current HPI
- 259.8107
- Rent YoY
- ▲ 1.06%
- Metro
- Burlington, NC
- State GDP YoY
- ▲ 3.28%
- F500 in state
- 26
Industry mix (Fortune 500 HQ in NC)
| Industry | F500 HQs | Revenue |
|---|---|---|
| Financial Services | 2 | $213B |
|
||
| Retail | 2 | $95B |
|
||
| Industrial Conglomerate | 1 | $38B |
|
||
| Metals / Steel | 1 | $35B |
|
||
| Utilities | 1 | $30B |
|
||
| Industrial Machinery | 1 | $19B |
|
||
Price history
+815.8% since first listed11 events — show timeline
- 2026-05-19 Listed $174,000 Triad MLS
- 2021-04-01 Listing Removed — TMLS
- 2021-03-30 Listing Removed — TMLS
- 2021-02-22 Listed $109,900 TMLS
- 2021-02-22 Listed $109,900 TMLS
- 2019-06-06 Sold (Public Records) $89,500 Public Records
- 2016-03-15 Listing Removed — TMLS
- 2014-10-02 Listed $59,900 TMLS
- 2011-08-22 Listing Removed — TMLS
- 2009-09-16 Listed $71,500 TMLS
- 1998-08-19 Sold (Public Records) $19,000 Public Records
Property tax history
+3.2%/yrLatest (2025): $982 · +3.0% YoY. Source: county tax records.
Cash-flow waterfall
monthlySold comps — $/sqft
last 12 mo · ≤1 miLoading sold comps…