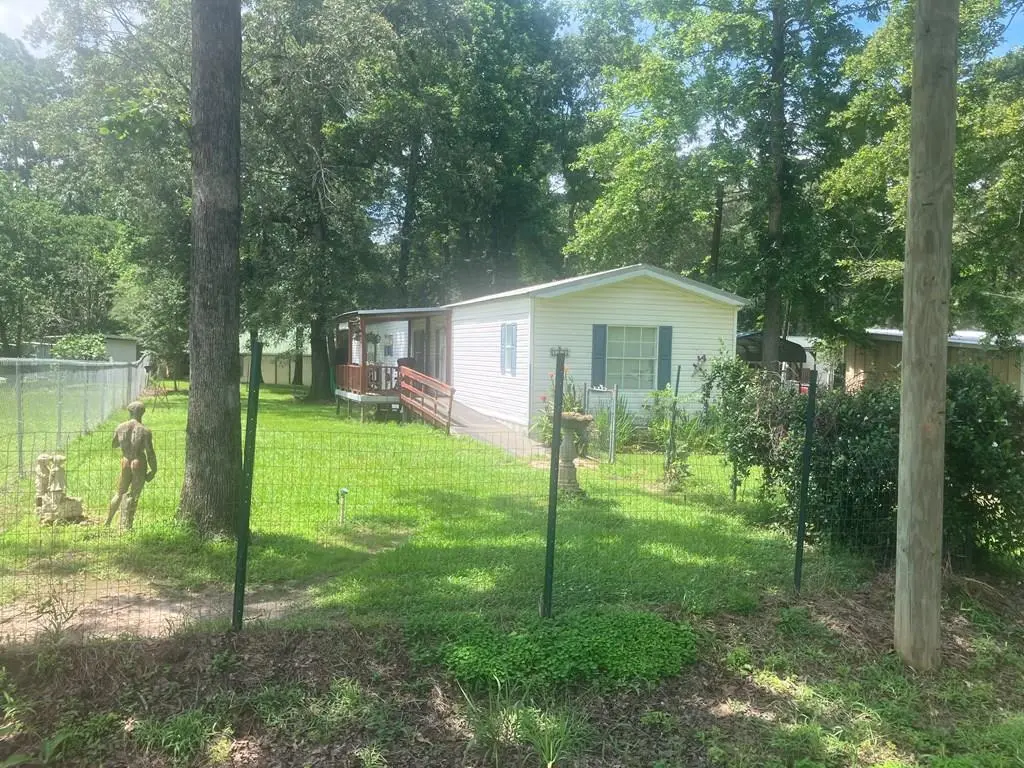
145 Mark St · Hemphill, TX
Flood risk 1/10 · Minimal
- FEMA flood zone
- —
- Chance of flooding over 30 yrs
- 0.0%
- Est. flood insurance / yr
- —
Fire risk 4/10 · Minor
- Est. fire insurance / yr
- $1,222 – $2,270
Heat risk 8/10 · Major
- Hot days now (above 110°F)
- 7 days/yr
- Hot days in 30 yrs
- 22 days/yr
Wind risk 8/10 · Major
- Chance of severe wind over 30 yrs
- 97.0%
Air-quality risk 1/10 · Minimal
- Unhealthy air days now
- 0 days/yr
- Unhealthy air days in 30 yrs
- 0 days/yr
Risk factors via First Street. Map © Google.
Why this score? — see what drove the D grade
The composite is a weighted blend of 9 inputs, each scored 0–100. Each bar is that input's sub-score; the figure is the points it added to the 100-point composite (weight × sub-score).
- Cash flow +15.1/30.0
- ARV discount +7.5/15.0
- DSCR +4.6/10.0
- Livability +3.4/5.0
- 1% rule +3.3/10.0
- Schools +3.2/10.0
- Rent growth +2.5/5.0
- Condition / age +2.5/5.0
- Appreciation +0.0/10.0
$110,000
🖨 Deal sheet 📄 Offer letter ✓ Due diligence
Listing remarks
1995 Champion MH on two nice lots w/ two garage type storage garages and fenced in yard. Unrestricted. Can raise chickens. Covered front porch; hook-ups for RV; generator (runs 110 only). Pex Plumbing, and insulated; vinyl siding; kitchen appliances and washer/dryer remain. Two bedrooms & bath on one side and master with bath on other side. Nice looking place. Toledo Beach addition about one minute drive by car to three great boat launches and park for children. Close to amenities. MH has overlaid additional roof. gas, restaurant, groceries, medical facility, lake area. Come see!
Key facts
- Covered front porch
- Pex plumbing
- Vinyl siding
Tags
Property features AI
Exterior
- Home design: Manufactured home; Residential property
- Construction: Metal roof
- Exterior features: Fenced yard
Interior
- Kitchen: Microwave; Refrigerator
- Flooring: Laminate
- Bathrooms: 2 full bathrooms
- Heating & cooling: Central heating; Electric heating; Central air conditioning
- Interior features: Walk-in closet(s)
- Laundry & utility: Washer; Dryer
Neighborhood map
What this means for you Summary
Snapshot
- This is a 3-bed/2.0-bath manufactured listed at $110k.
Deal economics
- At list price, monthly cash flow is $36 ($431/yr) — positive.
- The deal already cash-flows at list — no discount required.
- To meet the 1% rule (rent ≥ 1% of price), the offer needs to be $92k (16.5% below list).
- Recommended offer: $92k (16.5% below list) — sets the bar for 1% rule.
Location & tenants
- Location reads 67/100 on livability (#530 in TX) — a middle-class / working-renter tenant base. Strengths: crime A+, cost of living A+, housing A+; Watch: schools F, amenities F, commute F.
- Hemphill ISD (rural): math 37% / reading 41% proficiency, ranked #466 of 826 in TX (top 56%) — families likely to look elsewhere, expect single-tenant / working-renter base with shorter leases.
- Market conditions: 235 active listings in the ZIP.
Forward outlook
- Local home prices are declining (-3.0%/yr); year-one equity from $761 of loan paydown is wiped out by about $3k of value loss. Plan a longer hold.
- Sabine County population projected at -23% by 2050 — secular population decline; favor cash flow + early exit over multi-decade hold.
Negotiation context
- Only 10 days on market — expect competitive offers; lowballing is unlikely to land.
Risks & watch-outs
- Climate carrying-cost: severe wind risk, 97% chance of damaging wind over 30y; extreme-heat days projected 7→22/yr by 2055 (HVAC capex compounding) — expect insurance premiums to compound above CPI over the hold.
Questions for the listing agent
- Is there a deadline driving the sale (1031 exchange, divorce, estate, relocation)? That informs how much negotiation room exists.
- Schools are F-rated, which usually means shorter tenancies and higher turnover. Who's the typical renter profile here, and what's been the actual vacancy rate?
- The area grade is low — what's the realistic commute time and amenity access for the typical tenant pool here? Any planned neighborhood developments (good or bad) we should know about?
- What's the average days-on-market for RENTAL listings here right now (not sales)? A rising rental-DOM trend means longer vacancies and softer asking-rent achievability than the comps imply.
- What's the recent tenant-quality profile in this submarket — average credit score on applications, eviction rate, late-payment / NSF rate, and stable-employment percentage? A property-management company in the area should have these aggregated.
- How much new for-sale + rental construction is in the pipeline within 1–3 miles? Heavy new supply typically softens prices + rents 12–24 months out; constrained supply supports both.
Investment metrics
- 1% rule
- 0.83% ✗
- Cap rate
- 6.68%
- Cash-on-cash
- 1.40%
- DSCR
- 1.06
- GRM
- 10.0
CMA / ARV
No comps found within radius.
Projected returns pro-forma
-3.0% appreciation · 3.0% rent growth · sell at horizon
- IRR
- -14.1%
- Equity multiple
- 0.49×
- Total profit
- $-15,569
- Equity at exit
- $16,401
- IRR
- -5.4%
- Equity multiple
- 0.65×
- Total profit
- $-10,735
- Equity at exit
- $9,511
Cash invested: $30,800 (down + closing). Projections, not guarantees.
Landlord ↔ Tenant lean methodology
- Overall (STATE)
- 87 Strongly Landlord-Friendly
- State Texas
- 87 Strongly Landlord-Friendly · R+5
- County
- — inherits STATE
- City
- — inherits STATE
ZIP-level market 75948
- Home prices YoY
- -17.7%
- Active inventory
- 235
- Price-to-rent
- 10.0×
Monthly cashflow live
- Estimated rent
- $918 medium interval (Pro) →
- Mortgage (P&I)
- −$577
- Tax from tax record
- −$67 /mo · $799/yr
- Insurance
- −$46
- HOA
- −$0
- Vacancy / Maint / Mgmt
- −$193
- Net cashflow
- $36
Break-even live
UW: 25.0% down · 7.5% · 30yr · 1.5% tax · 5.0% vac · 8.0% maint · 8.0% mgmt
Financing live
Cash to close
- Down payment
- $27,500
- Closing costs
- $3,300
- Reserves months
- —
- Total cash needed
- —
Loan-product check · same deal, 3 products live
Conventional
25% down · 7.5% · 30yr
- Down + closing
- —
- Monthly P&I
- —
- Monthly cashflow
- —
- DSCR
- —
- Eligible?
- —
Personal DTI + credit; lowest rate.
DSCR
20% down · 8.5% · 30yr
- Down + closing
- —
- Monthly P&I
- —
- Monthly cashflow
- —
- DSCR
- —
- Eligible?
- —
No personal income docs; deal must DSCR.
Hard money
10% down · 12.0% · 12mo
- Down + closing
- —
- Monthly P&I
- —
- Monthly cashflow
- —
- DSCR
- —
- Eligible?
- —
Short-term bridge; refi at stabilization.
Listing history 8 events
-
2026-06-18days on market $110,000 Active 10 DOM
-
2026-06-17days on market $110,000 Active 9 DOM
-
2026-06-16days on market $110,000 Active 8 DOM
-
2026-06-15days on market $110,000 Active 7 DOM
-
2026-06-13days on market $110,000 Active 5 DOM
-
2026-06-12days on market $110,000 Active 4 DOM
-
2026-06-09remarks 590-char remark
-
2026-06-09$110,000 Active 1 DOM
ⓘ Source: listings_history table (triggers on properties + properties_extension) + one-shot
backfill from property_details.listing_events for pre-trigger history.
Tax reassessment forecast TX · Resets to sale price
- Current annual tax
- $799 · $67/mo
- Projected year-2 tax
- $2,013 · $168/mo
- Expected delta
- +$1,214/yr (+$101/mo · 151.8%)
ⓘ Screening estimate from a state-policy table — verify with the county assessor before closing.
Climate risk First Street
- Flood 1/10 Low 0% chance over 30 yrs
- Wildfire 4/10 Moderate
- Heat 8/10 Severe 7 d/yr ≥110°F today · 22 d/yr by 30 yrs out
- Wind 8/10 Severe 97% chance of damaging wind over 30 yrs
- Air quality 1/10 Low 0 unhealthy d/yr today · 0 by 30 yrs out
Nearby sold comps map
Loading sold comps map…
Walkable amenities ~0.75 mi
Loading nearby amenities…
Taxation est. · year 1
- Rental income
- $11,016
- − Mortgage interest
- −$6,162
- − Property taxes
- −$799
- − Insurance
- −$550
- − Repairs & maintenance
- −$881
- − Management
- −$881
- − Depreciation
- −$3,200
- Taxable loss
- −$1,458
- Est. tax savings @ 24.0%
- +$350
- After-tax cash flow
- $781/yr
For passive investors: Depreciation is non-cash, so a rental often shows a tax loss while cash-flowing — sheltering income. Rental losses are passive: they offset passive income freely, and up to $25,000/yr can offset ordinary (W-2) income if you actively participate and your MAGI is under $100k (phasing out to $0 by $150k); unused losses carry forward. On sale, claimed depreciation is recaptured at up to 25%, and gains may owe capital-gains tax (a 1031 exchange can defer both). Figures are a year-1 estimate at your 24.0% rate — not tax advice; consult a CPA.
Schools (NCES district)
- District
- Hemphill ISD
- NCES district ID
- 4822890
- Math proficiency
- 37% ▼ -1.00%
- Reading proficiency
- 41% ▲ 4.00%
- Median HH income
- $33,330
- Composite
- 32.06/100
- National rank
- #5821
- State rank
- #466 of 826 in TX
Livability — Hemphill
- Score
- 67/100
- State rank
- #530
- US rank
- #10376
Category grades
Schools grade is shown separately in the Schools card above.
Census & demographics
- Population (ZIP)
- 5,218
Population outlook (Sabine County) Hauer SSP2
- Today (2025)
- 9,354 people
- By 2030
- 8,806 · -5.9%
- By 2040
- 7,871 · -15.9%
- By 2050
- 7,224 · -22.8%
- By 2075
- 6,351 · -32.1%
- By 2100
- 5,465 · -41.6%
Race, ethnicity, and origin ACS 2023
- Neighborhood character
- Predominantly White (78%)
- Race & ethnicity
- White 78% Hispanic / Latino 7% Black 6% Two or more races 6% Asian 3% Native American 2%
- Hispanic origin (detail)
- Mexican 5%
- Common ancestry
- Lithuanian 5% Italian 2% Serbian 1%
- Foreign-born
- 2% · Canada
- Languages at home
- 96% English-only · Vietnamese 2% Spanish 1%
Political lean MEDSL · Sabine
- 2024 margin
- Solid R (+78.5) · D 10.6% · R 89.1%
- 2008→2024 swing
- -23.7pp toward R · 2008: -54.8pp · 2024: -78.5pp
- All cycles
- 2024: R+78.5 2020: R+75.0 2016: R+72.8 2012: R+63.9 2008: R+54.8
Not yet ingested
- Civics
- —
Market trends
- HPI YoY
- ▼ -34.26%
- Current HPI
- 159.0093
- Rent YoY
- —
- Metro
- —
- State GDP YoY
- ▲ 3.95%
- F500 in state
- 110
Industry mix (Fortune 500 HQ in TX)
| Industry | F500 HQs | Revenue |
|---|---|---|
| Energy | 16 | $1,198B |
|
||
| Technology | 5 | $198B |
|
||
| Engineering / Construction | 4 | $72B |
|
||
| Energy Services | 3 | $60B |
|
||
| Utilities | 3 | $41B |
|
||
| Healthcare | 2 | $330B |
|
||
Price history
1 event — show timeline
- 2026-06-05 Listed $110,000 Deep East Texas MLS
Property tax history
+4.1%/yrLatest (2025): $799 · +15.3% YoY. Source: county tax records.
Cash-flow waterfall
monthlySold comps — $/sqft
last 12 mo · ≤1 miLoading sold comps…