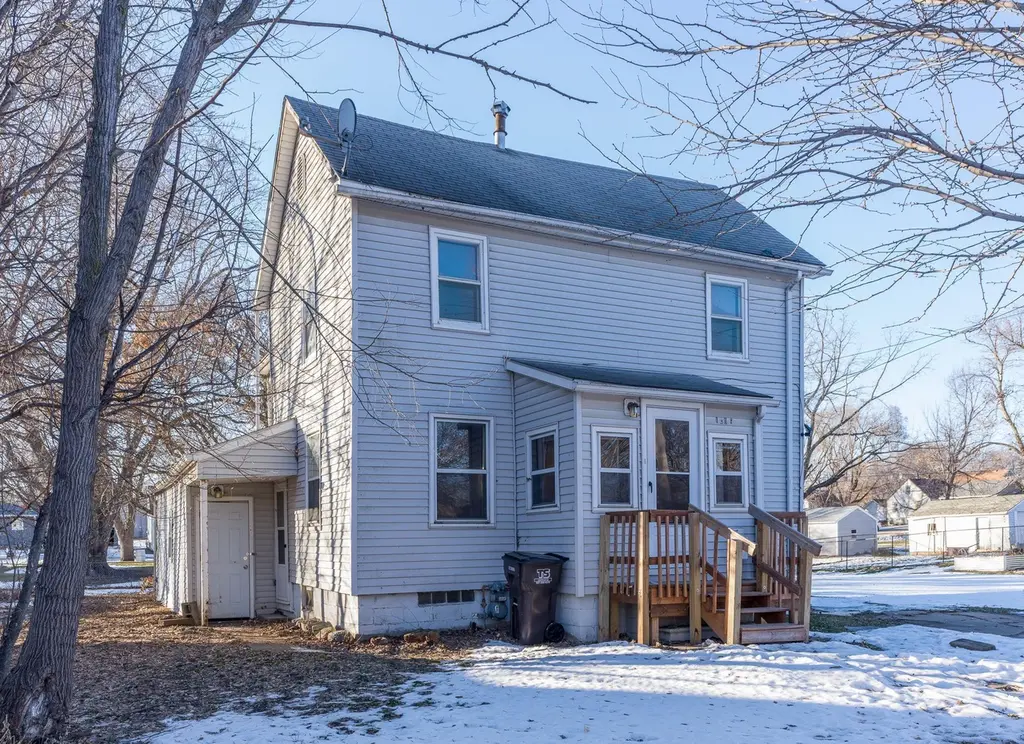
1206 James Ave · Albert Lea, MN
Flood risk 7/10 · Major
- FEMA flood zone
- X (unshaded)
- Chance of flooding over 30 yrs
- 0.76%
- Est. flood insurance / yr
- $507 – $1,088
Fire risk 1/10 · Minimal
- Est. fire insurance / yr
- $888 – $1,650
Heat risk 2/10 · Minimal
- Hot days now (above 98°F)
- 7 days/yr
- Hot days in 30 yrs
- 16 days/yr
Wind risk 2/10 · Minimal
- Chance of severe wind over 30 yrs
- —
Air-quality risk 1/10 · Minimal
- Unhealthy air days now
- 0 days/yr
- Unhealthy air days in 30 yrs
- 0 days/yr
Risk factors via First Street. Map © Google.
Why this score? — see what drove the B- grade
The composite is a weighted blend of 9 inputs, each scored 0–100. Each bar is that input's sub-score; the figure is the points it added to the 100-point composite (weight × sub-score).
- Cash flow +30.0/30.0
- 1% rule +10.0/10.0
- DSCR +10.0/10.0
- ARV discount +7.5/15.0
- Livability +3.6/5.0
- Schools +3.0/10.0
- Rent growth +2.5/5.0
- Condition / age +2.5/5.0
- Appreciation +0.0/10.0
$79,900
🖨 Deal sheet 📄 Offer letter ✓ Due diligence
Listing remarks MLS
If you are looking for a large home and you have the ability to do some remodeling yourself, this is a great opportunity. Replacing the flooring, giving it a fresh coat of paint and some new fixtures and you have the start to a great home. The exterior features vinyl siding for maintenance free living. There is a newer boiler and it keeps the home comfortable in the winter months. Please reach out today or schedule a showing with your Buyer's Agent. The Listing Agent owns that vacant lot to the North so both lots could be combined in the purchase. The property is a show and go so schedule through ShowingTime.
Key facts
- Newer boiler
- Vinyl siding
- 6,833 sq ft lot
Tags
Neighborhood map
What this means for you Summary
Snapshot
- This is a 5-bed/2.0-bath single-family listed at $80k.
Deal economics
- At list price, monthly cash flow is $653 ($8k/yr) — positive.
- The deal already cash-flows at list — no discount required.
- Meets the 1% rule at list price ($2k rent vs $80k).
- Recommended offer: $70k (12.0% below list) — sets the bar for market timing.
- Cap rate 17.1% vs local median 4.0% in Albert Lea — top-decile yield for the area; either an underpriced asset or a hidden risk that comps aren't pricing in. Stress-test before assuming the spread holds.
Location & tenants
- Location reads 72/100 on livability (#274 in MN) — a middle-class / working-renter tenant base. Strengths: cost of living A+, housing A+, health & safety A+; Watch: schools C-, employment D+, amenities F.
- Albert Lea Public School District (town): math 30% / reading 40% proficiency, ranked #258 of 301 in MN (top 86%) — families likely to look elsewhere, expect single-tenant / working-renter base with shorter leases.
- Market conditions: 150 active listings in the ZIP; 16 units permitted in Freeborn County in 2024 (0 in 5+ unit buildings).
Forward outlook
- Local home prices are declining (-3.0%/yr); year-one equity from $552 of loan paydown is wiped out by about $2k of value loss. Plan a longer hold.
- Freeborn County population projected at -11% by 2050 — secular population decline; favor cash flow + early exit over multi-decade hold.
- At projected returns (-3.0% appreciation + 3.0% rent growth), your $22k cash investment doubles in ~4 years — after that, you're playing with house money.
Negotiation context
- It's been on market 147 days — a 12% lower offer ($70k) is reasonable based on typical stale-listing flexibility.
- 8 sale attempts since 22y ago; this cycle's ask has dropped $20k (20%) from the opening price — seller is motivated, your offer sets the floor, not the list.
- Current owner paid $50k; list at $80k implies a 60% gain — meaningful room to come down on a strong offer.
Risks & watch-outs
- Watch-outs: flood insurance adds $66/mo; built in 1900 — expect roof / HVAC / electrical / plumbing capex.
- Climate carrying-cost: major flood risk — expect insurance premiums to compound above CPI over the hold.
Questions for the listing agent
- It's been on market 147 days. Have you received any prior offers? Is the seller open to a 12% concession, seller financing, or rate buy-down credit?
- Built in 1900 — when were the roof, HVAC, electrical panel, plumbing, and water heater last replaced?
- What's the actual annual flood-insurance premium (NFIP or private), and is the property in a SFHA with mandatory coverage?
- Why hasn't it sold? Are there any deal-killer items the seller is aware of (foundation, flood, title, zoning, code violations)?
- Is there a deadline driving the sale (1031 exchange, divorce, estate, relocation)? That informs how much negotiation room exists.
- What's the average days-on-market for RENTAL listings here right now (not sales)? A rising rental-DOM trend means longer vacancies and softer asking-rent achievability than the comps imply.
- What's the recent tenant-quality profile in this submarket — average credit score on applications, eviction rate, late-payment / NSF rate, and stable-employment percentage? A property-management company in the area should have these aggregated.
- How much new for-sale + rental construction is in the pipeline within 1–3 miles? Heavy new supply typically softens prices + rents 12–24 months out; constrained supply supports both.
Investment metrics
- 1% rule
- 1.95% ✓
- Cap rate
- 17.09%
- Cash-on-cash
- 38.57%
- DSCR
- 2.72
- GRM
- 4.3
CMA / ARV
- ARV (median comp)
- $191,000
- List price
- $79,900
- Delta
- -58.17%
- Verdict
- UNDERPRICED
- Comps
- 7 within 2.0 mi
Projected returns pro-forma
-3.0% appreciation · 3.0% rent growth · sell at horizon
- IRR
- 30.6%
- Equity multiple
- 2.28×
- Total profit
- $28,658
- Equity at exit
- $11,913
- IRR
- 37.8%
- Equity multiple
- 4.52×
- Total profit
- $78,641
- Equity at exit
- $6,908
Cash invested: $22,372 (down + closing). Projections, not guarantees.
Landlord ↔ Tenant lean methodology
- Overall (STATE)
- 46 Balanced
- State Minnesota
- 46 Balanced · D+2
- County
- — inherits STATE
- City
- — inherits STATE
ZIP-level market 56007
- Home prices YoY
- -22.3%
- Active inventory
- 150
- Price-to-rent
- 4.3×
Monthly cashflow live
- Estimated rent
- $1,561 medium interval (Pro) →
- Mortgage (P&I)
- −$419
- Tax from tax record
- −$62 /mo · $740/yr
- Insurance
- −$33
- Flood insurance flood zone
- −$66 /mo · $798/yr
- HOA
- −$0
- Vacancy / Maint / Mgmt
- −$328
- Net cashflow
- $653
Break-even live
UW: 25.0% down · 7.5% · 30yr · 1.5% tax · 5.0% vac · 8.0% maint · 8.0% mgmt
Financing live
Cash to close
- Down payment
- $19,975
- Closing costs
- $2,397
- Reserves months
- —
- Total cash needed
- —
Loan-product check · same deal, 3 products live
Conventional
25% down · 7.5% · 30yr
- Down + closing
- —
- Monthly P&I
- —
- Monthly cashflow
- —
- DSCR
- —
- Eligible?
- —
Personal DTI + credit; lowest rate.
DSCR
20% down · 8.5% · 30yr
- Down + closing
- —
- Monthly P&I
- —
- Monthly cashflow
- —
- DSCR
- —
- Eligible?
- —
No personal income docs; deal must DSCR.
Hard money
10% down · 12.0% · 12mo
- Down + closing
- —
- Monthly P&I
- —
- Monthly cashflow
- —
- DSCR
- —
- Eligible?
- —
Short-term bridge; refi at stabilization.
Listing history 38 events
-
2026-06-19days on market $79,900 Active 147 DOM
-
2026-06-18days on market $79,900 Active 146 DOM
-
2026-06-17days on market $79,900 Active 145 DOM
-
2026-06-16days on market $79,900 Active 144 DOM
-
2026-06-15days on market $79,900 Active 143 DOM
-
2026-06-14days on market $79,900 Active 141 DOM
-
2026-06-12days on market $79,900 Active 140 DOM
-
2026-06-09days on market $79,900 Active 137 DOM
-
2026-06-08days on market $79,900 Active 136 DOM
-
2026-06-07days on market $79,900 Active 135 DOM
-
2026-06-05days on market $79,900 Active 132 DOM
-
2026-06-03days on market $79,900 Active 131 DOM
-
2026-06-02days on market $79,900 Active 130 DOM
-
2026-06-01days on market $79,900 Active 129 DOM
-
2026-05-31days on market $79,900 Active 128 DOM
-
2026-05-30days on market $79,900 Active 127 DOM
-
2026-04-24price $79,900 616-char remark
Show marketing remark (616 chars)
If you are looking for a large home and you have the ability to do some remodeling yourself, this is a great opportunity. Replacing the flooring, giving it a fresh coat of paint and some new fixtures and you have the start to a great home. The exterior features vinyl siding for maintenance free living. There is a newer boiler and it keeps the home comfortable in the winter months. Please reach out today or schedule a showing with your Buyer's Agent. The Listing Agent owns that vacant lot to the North so both lots could be combined in the purchase. The property is a show and go so schedule through ShowingTime.
-
2026-01-23$99,900 Active 616-char remark
Show marketing remark (616 chars)
If you are looking for a large home and you have the ability to do some remodeling yourself, this is a great opportunity. Replacing the flooring, giving it a fresh coat of paint and some new fixtures and you have the start to a great home. The exterior features vinyl siding for maintenance free living. There is a newer boiler and it keeps the home comfortable in the winter months. Please reach out today or schedule a showing with your Buyer's Agent. The Listing Agent owns that vacant lot to the North so both lots could be combined in the purchase. The property is a show and go so schedule through ShowingTime.
-
2018-12-11historical 122-char remark
Show marketing remark (122 chars)
Property has been a rental for years. Could be a nice single family home. Good block foundation. Put your talents to work!
-
2018-12-10historical
-
2018-12-10historical
-
2018-12-09historical
-
2018-10-18soldstatus $50,000
-
2018-10-15soldstatus $50,000
-
2018-06-19$59,600
-
2017-11-21$67,900
-
2016-07-15soldstatus $23,000 122-char remark
Show marketing remark (122 chars)
Property has been a rental for years. Could be a nice single family home. Good block foundation. Put your talents to work!
-
2016-07-15soldstatus $23,000
Show marketing remark (122 chars)
Property has been a rental for years. Could be a nice single family home. Good block foundation. Put your talents to work!
-
2016-06-14$24,900 122-char remark
Show marketing remark (122 chars)
Property has been a rental for years. Could be a nice single family home. Good block foundation. Put your talents to work!
-
2009-04-06soldstatus $18,000
-
2009-04-06soldstatus $18,000
-
2009-03-05$19,900
-
2009-03-05$19,900
-
2006-04-27soldstatus $44,211
-
2006-04-27soldstatus $44,211
-
2006-04-13historical
-
2005-11-30$39,900
-
2004-04-13$63,900
ⓘ Source: listings_history table (triggers on properties + properties_extension) + one-shot
backfill from property_details.listing_events for pre-trigger history.
Tax reassessment forecast MN · Partial reset (capped growth)
- Current annual tax
- $740 · $62/mo
- Projected year-2 tax
- $817 · $68/mo
- Expected delta
- +$77/yr (+$6/mo · 10.5%)
ⓘ Screening estimate from a state-policy table — verify with the county assessor before closing.
Climate risk First Street
- Flood 7/10 Severe FEMA zone X (unshaded) · 76% chance over 30 yrs
- Wildfire 1/10 Low
- Heat 2/10 Low 7 d/yr ≥98°F today · 16 d/yr by 30 yrs out
- Wind 2/10 Low
- Air quality 1/10 Low 0 unhealthy d/yr today · 0 by 30 yrs out
Nearby sold comps map
Loading sold comps map…
Walkable amenities ~0.75 mi
Loading nearby amenities…
Taxation est. · year 1
- Rental income
- $18,729
- − Mortgage interest
- −$4,476
- − Property taxes
- −$740
- − Insurance
- −$1,197
- − Repairs & maintenance
- −$1,498
- − Management
- −$1,498
- − Depreciation
- −$2,324
- Taxable income
- $6,996
- Est. tax owed @ 24.0%
- −$1,679
- After-tax cash flow
- $6,152/yr
For passive investors: Depreciation is non-cash, so a rental often shows a tax loss while cash-flowing — sheltering income. Rental losses are passive: they offset passive income freely, and up to $25,000/yr can offset ordinary (W-2) income if you actively participate and your MAGI is under $100k (phasing out to $0 by $150k); unused losses carry forward. On sale, claimed depreciation is recaptured at up to 25%, and gains may owe capital-gains tax (a 1031 exchange can defer both). Figures are a year-1 estimate at your 24.0% rate — not tax advice; consult a CPA.
Schools (NCES district)
- District
- Albert Lea Public School District
- NCES district ID
- 2702970
- Math proficiency
- 30% ▼ -14.00%
- Reading proficiency
- 40% ▼ -8.00%
- Median HH income
- $42,776
- Composite
- 29.62/100
- National rank
- #6472
- State rank
- #258 of 301 in MN
Livability — Albert Lea
- Score
- 72/100
- State rank
- #274
- US rank
- #5963
Category grades
Schools grade is shown separately in the Schools card above.
Census & demographics
- Census place
- Albert Lea, MN
- County
- Freeborn County · 21,377 people
- City population
- 21,377
- Metro
- Albert Lea, MN
- Population (ZIP)
- 21,377
- Household income
- $68,846
- Rent vs Own
- Severe rent burden
- 483.0
Population outlook (Freeborn County) Hauer SSP2
- Today (2025)
- 29,680 people
- By 2030
- 29,038 · -2.2%
- By 2040
- 27,650 · -6.8%
- By 2050
- 26,387 · -11.1%
- By 2075
- 25,224 · -15.0%
- By 2100
- 23,842 · -19.7%
Race, ethnicity, and origin ACS 2023
- Neighborhood character
- Predominantly White (79%)
- Race & ethnicity
- White 79% Hispanic / Latino 14% Two or more races 8% Asian 4% Black 2%
- Hispanic origin (detail)
- Mexican 11%
- Common ancestry
- Portuguese 23% Iranian 3% Romanian 2%
- Foreign-born
- 4% · Canada, Philippines
- Languages at home
- 90% English-only · Spanish 7% Other Asian/Pacific 3%
Political lean MEDSL · Freeborn
- 2024 margin
- Strong R (+21.3) · D 38.7% · R 60.0% · Other 1.3%
- 2008→2024 swing
- -38.5pp toward R · 2008: 17.1pp · 2024: -21.3pp
- All cycles
- 2024: R+21.3 2020: R+16.0 2016: R+17.4 2012: D+14.2 2008: D+17.1
Not yet ingested
- Civics
- —
Market trends
- HPI YoY
- ▼ -63.40%
- Current HPI
- 220.7963
- Rent YoY
- —
- Metro
- Albert Lea, MN
- State GDP YoY
- ▲ 2.41%
- F500 in state
- 34
Industry mix (Fortune 500 HQ in MN)
| Industry | F500 HQs | Revenue |
|---|---|---|
| Healthcare | 2 | $407B |
|
||
| Retail | 2 | $150B |
|
||
| Consumer Goods | 2 | $32B |
|
||
| Industrial Machinery | 2 | $6B |
|
||
| Agriculture | 1 | $40B |
|
||
| Healthcare / Medical Devices | 1 | $32B |
|
||
Price history
+25.0% since first listed22 events — show timeline
- 2026-04-24 Price Changed $79,900 NORTHSTARMLS as Distributed by MLS Grid
- 2026-01-23 Listed $99,900 NORTHSTARMLS as Distributed by MLS Grid
- 2018-12-11 Listing Removed — NORTHSTARMLS as Distributed by MLS Grid
- 2018-12-10 Listing Removed — NORTHSTARMLS as Distributed by MLS Grid
- 2018-12-10 Listing Removed — NORTHSTARMLS as Distributed by MLS Grid
- 2018-12-09 Listing Removed — NORTHSTARMLS as Distributed by MLS Grid
- 2018-10-18 Sold (MLS) $50,000 NORTHSTARMLS as Distributed by MLS Grid
- 2018-10-15 Sold (Public Records) $50,000 Public Records
- 2018-06-19 Listed $59,600 NORTHSTARMLS as Distributed by MLS Grid
- 2017-11-21 Listed $67,900 NORTHSTARMLS as Distributed by MLS Grid
- 2016-07-15 Sold (Public Records) $23,000 Public Records
- 2016-07-15 Sold (MLS) $23,000 NORTHSTARMLS as Distributed by MLS Grid
- 2016-06-14 Listed $24,900 NORTHSTARMLS as Distributed by MLS Grid
- 2009-04-06 Sold (MLS) $18,000 NORTHSTARMLS as Distributed by MLS Grid
- 2009-04-06 Sold (MLS) $18,000 NORTHSTARMLS as Distributed by MLS Grid
- 2009-03-05 Listed $19,900 NORTHSTARMLS as Distributed by MLS Grid
- 2009-03-05 Listed $19,900 NORTHSTARMLS as Distributed by MLS Grid
- 2006-04-27 Sold (Public Records) $44,211 Public Records
- 2006-04-27 Sold (MLS) $44,211 NORTHSTARMLS as Distributed by MLS Grid
- 2006-04-13 Listing Removed — NORTHSTARMLS as Distributed by MLS Grid
- 2005-11-30 Listed $39,900 NORTHSTARMLS as Distributed by MLS Grid
- 2004-04-13 Listed $63,900 NORTHSTARMLS as Distributed by MLS Grid
Property tax history
+2.5%/yrLatest (2025): $740 · +13.1% YoY. Source: county tax records.
Cash-flow waterfall
monthlySold comps — $/sqft
last 12 mo · ≤1 miLoading sold comps…