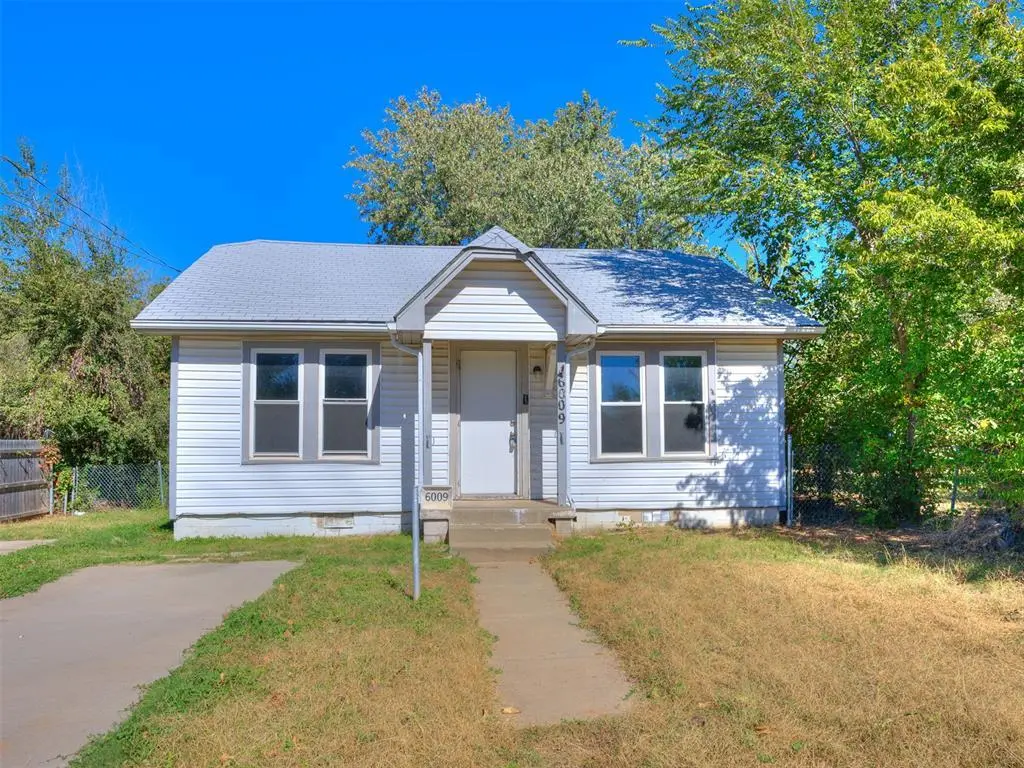
6009 NW 19th St · Oklahoma City, OK
Flood risk 1/10 · Minimal
- FEMA flood zone
- X (unshaded)
- Chance of flooding over 30 yrs
- 0.0%
- Est. flood insurance / yr
- $507 – $1,088
Fire risk 1/10 · Minimal
- Est. fire insurance / yr
- $2,463 – $4,575
Heat risk 5/10 · Moderate
- Hot days now (above 107°F)
- 7 days/yr
- Hot days in 30 yrs
- 17 days/yr
Wind risk 2/10 · Minimal
- Chance of severe wind over 30 yrs
- 4.0%
Air-quality risk 2/10 · Minimal
- Unhealthy air days now
- 1 days/yr
- Unhealthy air days in 30 yrs
- 2 days/yr
Risk factors via First Street. Map © Google.
Why this score? — see what drove the D+ grade
The composite is a weighted blend of 9 inputs, each scored 0–100. Each bar is that input's sub-score; the figure is the points it added to the 100-point composite (weight × sub-score).
- Cash flow +15.2/30.0
- ARV discount +15.0/15.0
- DSCR +4.7/10.0
- Livability +4.0/5.0
- 1% rule +3.6/10.0
- Rent growth +2.5/5.0
- Condition / age +2.5/5.0
- Schools +1.3/10.0
- Appreciation +0.0/10.0
$112,900
🖨 Deal sheet 📄 Offer letter ✓ Due diligence
Listing remarks
Welcome to this cozy NW OKC property—an excellent cash-flow investment opportunity in a steadily appreciating neighborhood. This home offers two bedrooms, plus a versatile third bedroom, providing flexibility for tenants who need extra space for a home office, guest room, or hobbies. The bright and comfortable layout makes the home easy to market and highly appealing to long-term renters. The functional kitchen provides ample cabinetry and counter space, ideal for everyday cooking and entertaining. An inside utility area adds convenience, while the fenced backyard offers a private spot for pets, play, or outdoor relaxation—features that increase rental desirability. Located near
Key facts
- Functional kitchen
- Inside utility area
- Fenced backyard
Tags
Property features AI
Finance
- Other: Homestead exempt; Located in Holtman Stiner Gardens; Vacant and active listing; Approx. 992 living area (assessor)
- Financial info: Not assumable; Does not apply for loan qualification
- HOA & community: No mandatory association dues
Exterior
- Home design: Single family residence; One story; Faces south; Existing property
- Construction: Built with other construction materials; Composition roof; Slab foundation
- Exterior features: Chain link fencing; Interior lot
Interior
- Bedrooms: 2 bedrooms
- Bathrooms: 1 full bathroom
- Interior features: One living area; No fireplace
Neighborhood map
What this means for you Summary
Snapshot
- This is a 2-bed/1.0-bath single-family listed at $113k.
Deal economics
- At list price, monthly cash flow is $40 ($479/yr) — positive.
- The deal already cash-flows at list — no discount required.
- To meet the 1% rule (rent ≥ 1% of price), the offer needs to be $97k (13.8% below list).
- Recommended offer: $97k (13.8% below list) — sets the bar for 1% rule.
- Cap rate 6.7% vs local median 3.7% in Oklahoma City — top-decile yield for the area; either an underpriced asset or a hidden risk that comps aren't pricing in. Stress-test before assuming the spread holds.
Location & tenants
- Location reads 80/100 on livability (#3 in OK, #1,635 nationally) — a professional / high-income tenant draw. Strengths: amenities A+, commute A+, cost of living A+; Watch: crime F.
- Putnam City (urban): math 12% / reading 16% proficiency, ranked #227 of 270 in OK (top 84%) — low school quality limits family demand, transient renter base, plan for 1-2y turnover; 65% free/reduced lunch — lower-income household profile, screen leases tightly.
- Zoned schools: Apollo Es (math 15% / reading 12%, grade F, #642 of 845 statewide, top 76%, 527 students, 0% FRL); Putnam City West Hs (math 10% / reading 20%, grade F, #323 of 447 statewide, top 74%, 1,803 students, 0% FRL) — zoned schools average 0% FRL vs 65% district-wide (65 pts lower); this property's tenant base skews higher-income than the district average.
- Market conditions: Rents flat; 69 active listings in the ZIP; 40 comparable units currently listed for rent nearby; rentals at typical pace (median 24d on market — plan ~3-4 weeks tenant-placement turnaround); lower-income renter base — watch delinquency; 5,365 units permitted in Oklahoma County in 2024 (569 in 5+ unit buildings).
Forward outlook
- Local home prices are declining (-3.0%/yr); year-one equity from $781 of loan paydown is wiped out by about $3k of value loss. Plan a longer hold.
- Oklahoma County population projected at +41% by 2050 — long-run rental-demand tailwind backs the buy-and-hold thesis.
Negotiation context
- It's been on market 21 days — a 2% lower offer ($111k) is reasonable based on typical stale-listing flexibility.
- 6 sale attempts since 2y ago with the ask held roughly flat each time — persistent listings suggest the price (not the market) is what's stuck; bring a comps-based counter.
- Current owner paid $66k; list at $113k implies a 71% gain — meaningful room to come down on a strong offer.
Risks & watch-outs
- Watch-outs: built in 1941 — expect roof / HVAC / electrical / plumbing capex.
- Climate carrying-cost: extreme-heat days projected 7→17/yr by 2055 (HVAC capex compounding) — expect insurance premiums to compound above CPI over the hold.
Questions for the listing agent
- Built in 1941 — when were the roof, HVAC, electrical panel, plumbing, and water heater last replaced?
- Is there a deadline driving the sale (1031 exchange, divorce, estate, relocation)? That informs how much negotiation room exists.
- Schools are F-rated, which usually means shorter tenancies and higher turnover. Who's the typical renter profile here, and what's been the actual vacancy rate?
- Crime grade is F in this area — have there been break-ins, vandalism, or insurance claims at this property in the last 3 years? What carrier currently insures it and at what premium?
- The area grade is low — what's the realistic commute time and amenity access for the typical tenant pool here? Any planned neighborhood developments (good or bad) we should know about?
- What's the average days-on-market for RENTAL listings here right now (not sales)? A rising rental-DOM trend means longer vacancies and softer asking-rent achievability than the comps imply.
- What's the recent tenant-quality profile in this submarket — average credit score on applications, eviction rate, late-payment / NSF rate, and stable-employment percentage? A property-management company in the area should have these aggregated.
- How much new for-sale + rental construction is in the pipeline within 1–3 miles? Heavy new supply typically softens prices + rents 12–24 months out; constrained supply supports both.
Investment metrics
- 1% rule
- 0.86% ✗
- Cap rate
- 6.72%
- Cash-on-cash
- 1.51%
- DSCR
- 1.07
- GRM
- 9.7
CMA / ARV
- ARV (on-the-fly)
- $140,864
- Comps found
- 12
Show comp detail 12 sales within ~0.75 mi
| Address | Dist | Beds/Ba | Sqft | Sold | Price | $/sf | Match |
|---|---|---|---|---|---|---|---|
| 6009 NW 19th St | 0.00mi | 2/1.0 | 992 (0%) | 0mo | $100,000 | $101 | 100 |
| 2312 N Redmond Ave | 0.32mi | 3/1.0 (+1) | 986 (-1%) | 5mo | $140,000 | $142 | 75 |
| 5920 NW 26th St | 0.47mi | 2/1.0 | 950 (-4%) | 2mo | $76,000 | $80 | 70 |
| 6300 NW 19th St | 0.19mi | 3/1.0 (+1) | 1,077 (+9%) | 3mo | $139,900 | $130 | 70 |
| 2312 N Donald Ave | 0.35mi | 3/1.0 (+1) | 1,066 (+8%) | 3mo | $122,900 | $115 | 64 |
| 5937 NW 26th St | 0.50mi | 3/1.0 (+1) | 1,025 (+3%) | 6mo | $105,000 | $102 | 61 |
| 1609 N Kavel Dr | 0.35mi | 2/1.5 | 900 (-9%) | 7mo | $161,500 | $179 | 61 |
| 5804 NW 24th St | 0.36mi | 3/1.0 (+1) | 940 (-5%) | 12mo | $165,000 | $176 | 59 |
| 2305 N Gleason Ave | 0.62mi | 3/1.0 (+1) | 1,035 (+4%) | 8mo | $159,000 | $154 | 52 |
| 2005 N Peniel Ave | 0.41mi | 3/1.5 (+1) | 1,090 (+10%) | 11mo | $140,000 | $128 | 48 |
| 6621 NW 25 St | 0.62mi | 3/1.0 (+1) | 900 (-9%) | 8mo | $154,700 | $172 | 44 |
| 2625 N Hammond Ave | 0.53mi | 3/1.5 (+1) | 1,137 (+15%) | 5mo | $185,000 | $163 | 39 |
Match score weights: distance 35% · size 25% · config 20% · recency 20%. Top-matched comps best support the ARV.
Projected returns pro-forma
-3.0% appreciation · 0.01% rent growth · sell at horizon
- IRR
- -17.1%
- Equity multiple
- 0.41×
- Total profit
- $-18,615
- Equity at exit
- $16,834
- IRR
- -15.4%
- Equity multiple
- 0.24×
- Total profit
- $-23,999
- Equity at exit
- $9,762
Cash invested: $31,612 (down + closing). Projections, not guarantees.
Landlord ↔ Tenant lean methodology
- Overall (STATE)
- 83 Strongly Landlord-Friendly
- State Oklahoma
- 83 Strongly Landlord-Friendly · R+20
- County
- — inherits STATE
- City
- — inherits STATE
ZIP-level market 73127
- Home prices YoY
- -30.6%
- Rents YoY
- 0.0%
- Active inventory
- 69
- Price-to-rent
- 9.7×
Monthly cashflow live
- Estimated rent
- $974 high interval (Pro) →
- Mortgage (P&I)
- −$592
- Tax from tax record
- −$90 /mo · $1,082/yr
- Insurance
- −$47
- HOA
- −$0
- Vacancy / Maint / Mgmt
- −$204
- Net cashflow
- $40
Break-even live
UW: 25.0% down · 7.5% · 30yr · 1.5% tax · 5.0% vac · 8.0% maint · 8.0% mgmt
Financing live
Cash to close
- Down payment
- $28,225
- Closing costs
- $3,387
- Reserves months
- —
- Total cash needed
- —
Loan-product check · same deal, 3 products live
Conventional
25% down · 7.5% · 30yr
- Down + closing
- —
- Monthly P&I
- —
- Monthly cashflow
- —
- DSCR
- —
- Eligible?
- —
Personal DTI + credit; lowest rate.
DSCR
20% down · 8.5% · 30yr
- Down + closing
- —
- Monthly P&I
- —
- Monthly cashflow
- —
- DSCR
- —
- Eligible?
- —
No personal income docs; deal must DSCR.
Hard money
10% down · 12.0% · 12mo
- Down + closing
- —
- Monthly P&I
- —
- Monthly cashflow
- —
- DSCR
- —
- Eligible?
- —
Short-term bridge; refi at stabilization.
Rent comps 40 comps
| Address | Beds | Baths | Sqft | Rent | $/sqft | DOM | Units | Dist |
|---|---|---|---|---|---|---|---|---|
| 6100 Macarthur Park Ln Unit 1609 Oklahoma City, OK | 2.0 | 1.5 | 960 | $950 | $0.99 | 23d | 1 | 0.12mi |
| 6022 NW 23rd St Unit 6028-7 Oklahoma City, OK | 2.0 | 1.0 | 800 | $995 | $1.24 | 23d | 1 | 0.20mi |
| 6022 NW 23rd St Unit 6028-6 Oklahoma City, OK | 2.0 | 1.0 | 800 | $995 | $1.24 | 4d | 1 | 0.20mi |
| 6022 NW 23rd St Unit 6014-5 Oklahoma City, OK | 1.0 | 1.0 | 600 | $825 | $1.38 | 23d | 1 | 0.20mi |
| 6022 NW 23rd St Unit 6024-8 Oklahoma City, OK | 1.0 | 1.0 | 600 | $850 | $1.42 | 23d | 1 | 0.20mi |
| 6022 NW 23rd St Unit 6024-6 Oklahoma City, OK | 1.0 | 1.0 | 600 | $795 | $1.32 | 4d | 1 | 0.20mi |
| 6108 NW 16th St Oklahoma City, OK | 2.0 | 1.5 | 850 | $1,000 | $1.18 | 23d | 1 | 0.30mi |
| 2404 N Reeves Ave Oklahoma City, OK | 2.0 | 1.0 | 950 | $895 | $0.94 | 16d | 1 | 0.30mi |
| 2325 N Redmond Ave Bethany, OK | 3.0 | 1.5 | 908 | $1,200 | $1.32 | 23d | 1 | 0.34mi |
| 5518 NW 23rd St Oklahoma City, OK | 2.0 | 1.0 | 659 | $940 | $1.43 | 23d | 1 | 0.42mi |
| 1681 N Donald Ave Unit 105 Oklahoma City, OK | 1.0 | 1.0 | 768 | $849 | $1.11 | 20d | 1 | 0.50mi |
| 1681 N Donald Ave Unit 263 Oklahoma City, OK | 2.0 | 2.0 | 1056 | $995 | $0.94 | 20d | 1 | 0.50mi |
| 1681 N Donald Ave Unit 224 Oklahoma City, OK | 2.0 | 1.0 | 960 | $949 | $0.99 | 20d | 1 | 0.50mi |
| 6703 NW 25th St Bethany, OK | 3.0 | 1.0 | 1100 | $1,249 | $1.14 | 23d | 1 | 0.65mi |
| 6802 NW 16th St Unit 21A Oklahoma City, OK | 1.0 | 1.0 | 550 | $750 | $1.36 | 23d | 1 | 0.69mi |
| 1120 N Tela Dr Oklahoma City, OK | 2.0 | 1.0 | 864 | $875 | $1.01 | 23d | 1 | 0.73mi |
| 1120 N Tela Dr Oklahoma City, OK | 2.0 | 1.0 | 864 | $875 | $1.01 | 19d | 1 | 0.73mi |
| 6820 NW 22nd St Bethany, OK | 3.0 | 1.5 | 1100 | $1,400 | $1.27 | 2d | 1 | 0.75mi |
| 6714 NW 27th St Bethany, OK | 2.0 | 1.0 | 773 | $1,050 | $1.36 | 23d | 1 | 0.75mi |
| 6810 NW 16th St Oklahoma City, OK | 1.0–3.0 | 1.0–2.0 | 1119 | $954 | $0.85 | 1d | 20 | 0.78mi |
| 4750 NW 23rd St Oklahoma City, OK | 1.0 | 1.0 | 765 | $700 | $0.92 | 11d | 1 | 0.79mi |
| 4750 NW 23rd St Oklahoma City, OK | 1.0 | 1.0 | 765 | $740 | $0.97 | 3d | 1 | 0.79mi |
| 4750 NW 23rd St Oklahoma City, OK | 2.0 | 1.0 | 975 | $830 | $0.85 | 23d | 1 | 0.79mi |
| 4750 NW 23rd St Unit 109 Oklahoma City, OK | 1.0 | 1.0 | 765 | $700 | $0.92 | 23d | 1 | 0.80mi |
| 4750 NW 23rd St Unit 158 Oklahoma City, OK | 2.0 | 1.0 | 975 | $785 | $0.81 | 23d | 1 | 0.80mi |
| 1900 N Rockwell Ave Bethany, OK | 1.0–2.0 | 1.0–2.0 | 825 | $949 | $1.15 | 2d | 12 | 0.81mi |
| 1900 N Rockwell Ave Bethany, OK | 1.0–3.0 | 1.0–2.0 | 885 | $788 | $0.89 | 23d | 12 | 0.82mi |
| 1800 N Rockwell Ave Bethany, OK | 1.0–3.0 | 1.0–2.0 | 1036 | $938 | $0.90 | 2d | 1 | 0.82mi |
| 4746 NW 23rd St Oklahoma City, OK | 2.0 | 1.0 | 975 | $815 | $0.84 | 3d | 1 | 0.85mi |
| 4746 NW 23rd St Oklahoma City, OK | 1.0 | 1.0 | 740 | $635 | $0.86 | 3d | 1 | 0.85mi |
| 4746 NW 23rd St Oklahoma City, OK | 2.0 | 1.0 | 975 | $725 | $0.74 | 23d | 1 | 0.85mi |
| 6601 NW 30th Ter Unit 9 Bethany, OK | 1.0 | 1.0 | 538 | $675 | $1.25 | 23d | 1 | 0.90mi |
| 6601 NW 30th Ter Unit 9 Bethany, OK | 1.0 | 1.0 | 538 | $675 | $1.25 | 19d | 1 | 0.90mi |
| 6100-6114 NW 32nd St Unit 129 Bethany, OK | 2.0 | 1.0 | 895 | $725 | $0.81 | 23d | 1 | 0.96mi |
| 6100-6114 NW 32nd St Unit 214 Bethany, OK | 1.0 | 1.0 | 680 | $725 | $1.07 | 23d | 1 | 0.96mi |
| 6100-6114 NW 32nd St Unit 124 Bethany, OK | 2.0 | 1.0 | 895 | $790 | $0.88 | 23d | 1 | 0.96mi |
| 6100-6114 NW 32nd St Unit 117 Bethany, OK | 2.0 | 1.5 | 955 | $935 | $0.98 | 14d | 1 | 0.96mi |
| 6100-6114 NW 32nd St Unit 224 Bethany, OK | 2.0 | 1.0 | 895 | $825 | $0.92 | 23d | 1 | 0.96mi |
| 6618 NW 31st St Bethany, OK | 2.0 | 1.0 | 1005 | $1,200 | $1.19 | 2d | 1 | 0.98mi |
| 5801 NW 33rd St Oklahoma City, OK | 2.0 | 1.0 | 707 | $875 | $1.24 | 23d | 1 | 1.04mi |
Listing history 21 events
-
2026-05-08$112,900 Active
-
2026-04-23historical
-
2026-04-02price $114,900
-
2026-02-06status Active
-
2026-01-31status Active
-
2026-01-06status Pending
-
2025-12-12price $116,900
-
2025-10-23$119,900 Active
-
2025-06-30historical
-
2025-06-05price $124,900
-
2025-04-25price $129,500
-
2025-04-25price $129,900
-
2025-03-20price $133,900
-
2025-02-14price $136,900
-
2024-12-17$139,900 Active
-
2024-10-24historical
-
2024-08-02$130,000 Active
-
2022-06-05price $995
-
2021-04-28soldstatus $66,000
-
1988-10-11soldstatus $24,500
-
1986-02-01soldstatus $29,500
ⓘ Source: listings_history table (triggers on properties + properties_extension) + one-shot
backfill from property_details.listing_events for pre-trigger history.
Tax reassessment forecast OK · Resets to sale price
- Current annual tax
- $1,082 · $90/mo
- Projected year-2 tax
- $1,082 · $90/mo
- Expected delta
- $0/yr ($0/mo · 0.0%)
ⓘ Screening estimate from a state-policy table — verify with the county assessor before closing.
Climate risk First Street
- Flood 1/10 Low FEMA zone X (unshaded) · 0% chance over 30 yrs
- Wildfire 1/10 Low
- Heat 5/10 Major 7 d/yr ≥107°F today · 17 d/yr by 30 yrs out
- Wind 2/10 Low 4% chance of damaging wind over 30 yrs
- Air quality 2/10 Low 1 unhealthy d/yr today · 2 by 30 yrs out
Nearby sold comps map
Loading sold comps map…
Walkable amenities ~0.75 mi
Loading nearby amenities…
Taxation est. · year 1
- Rental income
- $11,683
- − Mortgage interest
- −$6,324
- − Property taxes
- −$1,082
- − Insurance
- −$564
- − Repairs & maintenance
- −$935
- − Management
- −$935
- − Depreciation
- −$3,284
- Taxable loss
- −$1,441
- Est. tax savings @ 24.0%
- +$346
- After-tax cash flow
- $824/yr
For passive investors: Depreciation is non-cash, so a rental often shows a tax loss while cash-flowing — sheltering income. Rental losses are passive: they offset passive income freely, and up to $25,000/yr can offset ordinary (W-2) income if you actively participate and your MAGI is under $100k (phasing out to $0 by $150k); unused losses carry forward. On sale, claimed depreciation is recaptured at up to 25%, and gains may owe capital-gains tax (a 1031 exchange can defer both). Figures are a year-1 estimate at your 24.0% rate — not tax advice; consult a CPA.
Schools (NCES district)
- District
- Putnam City
- NCES district ID
- 4025290
- Math proficiency
- 12% ▼ -18.00%
- Reading proficiency
- 16% ▼ -14.00%
- Median HH income
- $46,657
- Composite
- 12.61/100
- National rank
- #9614
- State rank
- #227 of 270 in OK
Livability — Oklahoma City
- Score
- 80/100
- State rank
- #3
- US rank
- #1635
Category grades
Schools grade is shown separately in the Schools card above.
Census & demographics
- Census place
- Oklahoma City, OK
- County
- Oklahoma County · 771,644 people
- City population
- 498,656
- Metro
- Oklahoma City, OK
- Population (ZIP)
- 25,865
- Household income
- $44,925
- Rent vs Own
- Severe rent burden
- 1244.0
Population outlook (Oklahoma County) Hauer SSP2
- Today (2025)
- 911,875 people
- By 2030
- 982,413 · +7.7%
- By 2040
- 1,130,468 · +24.0%
- By 2050
- 1,288,422 · +41.3%
- By 2075
- 1,711,482 · +87.7%
- By 2100
- 2,088,448 · +129.0%
Race, ethnicity, and origin ACS 2023
- Neighborhood character
- Highly diverse neighborhood (Simpson 0.71)
- Race & ethnicity
- Hispanic / Latino 40% White 33% Two or more races 24% Black 13% Native American 3% Asian 2%
- Hispanic origin (detail)
- Mexican 26%
- Common ancestry
- Slovak 1% Lithuanian 1%
- Foreign-born
- 18% · Canada, Vietnam
- Languages at home
- 63% English-only · Spanish 35% Other Asian/Pacific 1% Vietnamese 1%
Political lean MEDSL · Oklahoma
- 2024 margin
- Toss-up / Even · D 48.0% · R 49.7% · Other 2.3%
- 2008→2024 swing
- +15.1pp toward D · 2008: -16.8pp · 2024: -1.7pp
- All cycles
- 2024: R+1.7 2020: R+1.1 2016: R+10.5 2012: R+16.7 2008: R+16.8
Not yet ingested
- Civics
- —
Market trends
- HPI YoY
- ▼ -118.05%
- Current HPI
- 268.0173
- Rent YoY
- ▬ 0.01%
- Metro
- Oklahoma City, OK
- State GDP YoY
- ▲ 1.55%
- F500 in state
- 6
Industry mix (Fortune 500 HQ in OK)
| Industry | F500 HQs | Revenue |
|---|---|---|
| Energy | 3 | $48B |
|
||
Price history
+282.7% since first listed21 events — show timeline
- 2026-05-08 Listed $112,900 MLSOK
- 2026-04-23 Listing Removed — MLSOK
- 2026-04-02 Price Changed $114,900 MLSOK
- 2026-02-06 Relisted — MLSOK
- 2026-01-31 Relisted — MLSOK
- 2026-01-06 Pending — MLSOK
- 2025-12-12 Price Changed $116,900 MLSOK
- 2025-10-23 Listed $119,900 MLSOK
- 2025-06-30 Listing Removed — MLSOK
- 2025-06-05 Price Changed $124,900 MLSOK
- 2025-04-25 Price Changed $129,500 MLSOK
- 2025-04-25 Price Changed $129,900 MLSOK
- 2025-03-20 Price Changed $133,900 MLSOK
- 2025-02-14 Price Changed $136,900 MLSOK
- 2024-12-17 Listed $139,900 MLSOK
- 2024-10-24 Listing Removed — MLSOK
- 2024-08-02 Listed $130,000 MLSOK
- 2022-06-05 Price Changed $995 RENT.
- 2021-04-28 Sold (Public Records) $66,000 Public Records
- 1988-10-11 Sold (Public Records) $24,500 Public Records
- 1986-02-01 Sold (Public Records) $29,500 Public Records
Property tax history
+6.9%/yrLatest (2025): $1,082 · +5.7% YoY. Source: county tax records.
Cash-flow waterfall
monthlySold comps — $/sqft
last 12 mo · ≤1 miLoading sold comps…