 Duplex
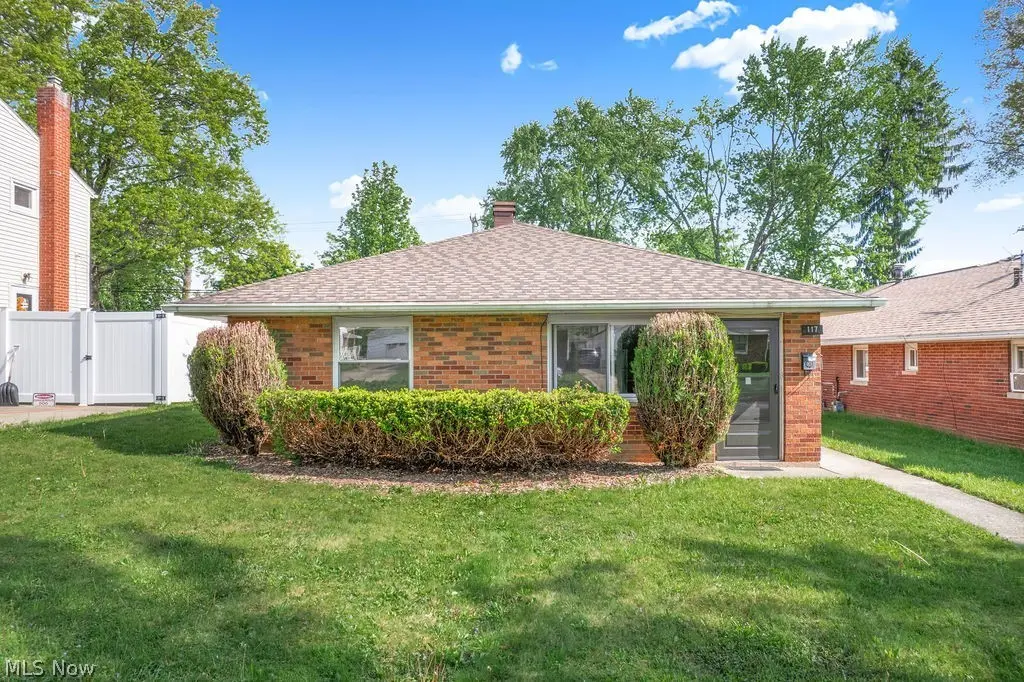
117-119 Filmore Ave · Cuyahoga Falls, OH
Flood risk 1/10 · Minimal
- FEMA flood zone
- X (unshaded)
- Chance of flooding over 30 yrs
- 0.0%
- Est. flood insurance / yr
- $507 – $1,088
Fire risk 1/10 · Minimal
- Est. fire insurance / yr
- $713 – $1,323
Heat risk 3/10 · Minor
- Hot days now (above 98°F)
- 7 days/yr
- Hot days in 30 yrs
- 17 days/yr
Wind risk 1/10 · Minimal
- Chance of severe wind over 30 yrs
- —
Air-quality risk 3/10 · Minor
- Unhealthy air days now
- 2 days/yr
- Unhealthy air days in 30 yrs
- 4 days/yr
Risk factors via First Street. Map © Google.
Why this score? — see what drove the C- grade
The composite is a weighted blend of 9 inputs, each scored 0–100. Each bar is that input's sub-score; the figure is the points it added to the 100-point composite (weight × sub-score).
- Cash flow +18.0/30.0
- ARV discount +7.8/15.0
- DSCR +5.6/10.0
- 1% rule +4.8/10.0
- Schools +4.5/10.0
- Rent growth +4.2/5.0
- Livability +4.2/5.0
- Condition / age +2.5/5.0
- Appreciation +0.0/10.0
$249,900
🖨 Deal sheet 📄 Offer letter ✓ Due diligence
Multi-family units
County records classify this as Multi-Family (2-4 Unit). Listing-text estimate: 2 units. confirmed
Listing remarks
RARE FIND IN CUYAHOGA FALLS! Immaculate, well-maintained brick ranch twinplex showcasing true pride of ownership throughout the years. This turnkey property is ready for immediate occupancy, perfect for an owner-occupant or investor. Per owner (dates approximate): Unit 119: Furnace and central air (3-4 years old), hot water tank (7-8 years old) - per owner. Unit 117: hot water tank (8-9 years old per owner), windows replaced at one point, furnace (approx. 8-9 years old), C/A - older, compressor updated - per owner.
Key facts
- 6,534 sq ft lot
- Garage
- Built 1961
Property features AI
Finance
- Financial info: Owner pays trash collection; Tenant responsible for electricity, gas, water, and sewer
Exterior
- Parking: Converted garage; Driveway; Side-by-side parking; No conventional garage
- Utilities: Public water; Public sewer
- Home design: Single-story brick home; Faces south; Slab foundation
- Construction: Brick construction; Asphalt/fiberglass roof; Built (year source: Assessor)
- Exterior features: Back yard; Front yard; Flat, level lot
Interior
- Kitchen: Range; Refrigerator
- Bathrooms: 2 full bathrooms
- Heating & cooling: Central air conditioning; Forced-air gas heating
- Interior features: Double-pane windows; Total of 8 rooms; One building on the property
- Laundry & utility: Washer hookup; Electric dryer hookup; Laundry on main level
Neighborhood map
What this means for you Summary
Snapshot
- This is a 2 × 2-bed/1.0-bath units multifamily listed at $250k.
Deal economics
- At list price, monthly cash flow is $216 ($3k/yr) — positive. Per door: $108/mo.
- The deal already cash-flows at list — no discount required.
- To meet the 1% rule (rent ≥ 1% of price), the offer needs to be $245k (1.9% below list).
- Recommended offer: $245k (1.9% below list) — sets the bar for 1% rule.
- Cap rate 7.3% vs local median 4.6% in Cuyahoga Falls — top-decile yield for the area; either an underpriced asset or a hidden risk that comps aren't pricing in. Stress-test before assuming the spread holds.
Location & tenants
- Location reads 83/100 on livability (#60 in OH, #870 nationally) — a professional / high-income tenant draw. Strengths: cost of living A+, housing A+, health & safety A+; Watch: commute F.
- Cuyahoga Falls City (suburban): math 47% / reading 58% proficiency, ranked #408 of 656 in OH (top 62%) — acceptable for families but not a draw, mixed tenant base, ~2y average lease.
- Market conditions: Rents rising fast (+7.0%/yr); 90 active listings in the ZIP; 5 comparable units currently listed for rent nearby; rentals at typical pace (median 14d on market — plan ~3-4 weeks tenant-placement turnaround); 1,114 units permitted in Summit County in 2024 (397 in 5+ unit buildings).
- At $2,452/mo this rent would consume 46% of the median local household income ($63k/yr) (locally 1080% of renters already pay >50% of income on rent) — very limited rent-growth headroom before tenants either downsize or default.
Forward outlook
- Local home prices are declining (-3.0%/yr); year-one equity from $2k of loan paydown is wiped out by about $7k of value loss. Plan a longer hold.
- Summit County population projected to shrink 6% by 2050 — rents likely to lag national; underwrite the cash flow, not the appreciation.
Negotiation context
- Only 3 days on market — expect competitive offers; lowballing is unlikely to land.
- Current owner paid $60k; list at $250k implies a 316% gain — meaningful room to come down on a strong offer.
Questions for the listing agent
- Can we see the unit-by-unit rent roll, current vacancy, and any below-market leases? What's the average tenancy length?
- What capital expenditures (roof, boiler, parking lot, exteriors) have been made in the last 5 years, and what's planned in the next 2?
- Built in 1961 — when were the roof, HVAC, electrical panel, plumbing, and water heater last replaced?
- Is there a deadline driving the sale (1031 exchange, divorce, estate, relocation)? That informs how much negotiation room exists.
- Schools are A-rated — typically a magnet for longer-tenancy family renters. What's the average tenant stay here, and is there a school-zone premium baked into asking?
- What's the average days-on-market for RENTAL listings here right now (not sales)? A rising rental-DOM trend means longer vacancies and softer asking-rent achievability than the comps imply.
- What's the recent tenant-quality profile in this submarket — average credit score on applications, eviction rate, late-payment / NSF rate, and stable-employment percentage? A property-management company in the area should have these aggregated.
- How much new apartment / multifamily construction is in the pipeline within 1–3 miles? Heavy new supply (>2% of stock underway) typically softens rents 12–24 months out; light construction supports rent growth.
Investment metrics
- 1% rule
- 0.98% ✗
- Cap rate
- 7.33%
- Cash-on-cash
- 3.70%
- DSCR
- 1.16
- GRM
- 8.5
CMA / ARV
- ARV (on-the-fly)
- $251,720
- Comps found
- 4
Show comp detail 4 sales within ~0.75 mi
| Address | Dist | Beds/Ba | Sqft | Sold | Price | $/sf | Match |
|---|---|---|---|---|---|---|---|
| 117-119 Filmore Ave | 0.00mi | 4/2.0 | 1,624 (0%) | 1mo | $255,000 | $157 | 99 |
| 3340-3342 Bailey Rd | 0.11mi | 5/2.0 (+1) | 1,585 (-2%) | 10mo | $240,000 | $151 | 78 |
| 304/306 Erie St | 0.72mi | 4/2.0 | 1,612 (-1%) | 9mo | $250,000 | $155 | 58 |
| 2813 6th St | 0.73mi | 4/2.0 | 1,792 (+10%) | 22mo | $191,000 | $107 | 30 |
Match score weights: distance 35% · size 25% · config 20% · recency 20%. Top-matched comps best support the ARV.
Projected returns pro-forma
-3.0% appreciation · 6.95% rent growth · sell at horizon
- IRR
- -6.1%
- Equity multiple
- 0.76×
- Total profit
- $-16,594
- Equity at exit
- $37,261
- IRR
- 7.8%
- Equity multiple
- 1.69×
- Total profit
- $48,478
- Equity at exit
- $21,607
Cash invested: $69,972 (down + closing). Projections, not guarantees.
Landlord ↔ Tenant lean methodology
- Overall (STATE)
- 73 Landlord-Friendly
- State Ohio
- 73 Landlord-Friendly · R+6
- County
- — inherits STATE
- City
- — inherits STATE
ZIP-level market 44221
- Rents YoY
- 7.0%
- Active inventory
- 90
- Price-to-rent
- 17.0×
Monthly cashflow live
- Estimated rent
- $2,452 high interval (Pro) →
- Mortgage (P&I)
- −$1,311
- Tax from tax record
- −$307 /mo · $3,682/yr
- Insurance
- −$104
- HOA
- −$0
- Vacancy / Maint / Mgmt
- −$515
- Net cashflow
- $216
Break-even live
2-unit breakdown (identical units grouped — click to expand)
| Units | Beds | Baths | Est. rent |
|---|---|---|---|
| 2× units | 2 | 1 | $2,452 |
| #1 | 2 | 1 | $1,226 |
| #2 | 2 | 1 | $1,226 |
| Total (2 units) | $2,452 | ||
UW: 25.0% down · 7.5% · 30yr · 1.5% tax · 5.0% vac · 8.0% maint · 8.0% mgmt
Financing live
Cash to close
- Down payment
- $62,475
- Closing costs
- $7,497
- Reserves months
- —
- Total cash needed
- —
Loan-product check · same deal, 3 products live
Conventional
25% down · 7.5% · 30yr
- Down + closing
- —
- Monthly P&I
- —
- Monthly cashflow
- —
- DSCR
- —
- Eligible?
- —
Personal DTI + credit; lowest rate.
DSCR
20% down · 8.5% · 30yr
- Down + closing
- —
- Monthly P&I
- —
- Monthly cashflow
- —
- DSCR
- —
- Eligible?
- —
No personal income docs; deal must DSCR.
Hard money
10% down · 12.0% · 12mo
- Down + closing
- —
- Monthly P&I
- —
- Monthly cashflow
- —
- DSCR
- —
- Eligible?
- —
Short-term bridge; refi at stabilization.
Rent comps 5 comps
| Address | Beds | Baths | Sqft | Rent | $/sqft | DOM | Units | Dist |
|---|---|---|---|---|---|---|---|---|
| 113 Madison Ave Unit 1496128P Cuyahoga Falls, OH | 3.0 | 1.5 | 1065 | $4,259 | $4.00 | 13d | 1 | 0.15mi |
| 2899 Northland St Cuyahoga Falls, OH | 4.0 | 1.0 | 1424 | $1,995 | $1.40 | 14d | 1 | 0.52mi |
| 890 Quail Crk Blvd Cuyahoga Falls, OH | 2.0–3.0 | 2.0 | 1387 | $2,475 | $1.78 | 13d | 1 | 0.56mi |
| 401-407 Pleasant Meadow Blvd Unit 401-203 Stow, OH | 3.0 | 2.0 | 1528 | $1,745 | $1.14 | 43d | 1 | 0.66mi |
| 430 Keenan Ave Cuyahoga Falls, OH | 3.0 | 1.0 | 1104 | $1,325 | $1.20 | 14d | 1 | 0.70mi |
Listing history 3 events
-
2026-05-11status Pending
-
2026-05-08$249,900 Active
-
1991-09-23soldstatus $60,000
ⓘ Source: listings_history table (triggers on properties + properties_extension) + one-shot
backfill from property_details.listing_events for pre-trigger history.
Tax reassessment forecast OH · Partial reset (capped growth)
- Current annual tax
- $3,682 · $307/mo
- Projected year-2 tax
- $3,790 · $316/mo
- Expected delta
- +$108/yr (+$9/mo · 2.9%)
ⓘ Screening estimate from a state-policy table — verify with the county assessor before closing.
Climate risk First Street
- Flood 1/10 Low FEMA zone X (unshaded) · 0% chance over 30 yrs
- Wildfire 1/10 Low
- Heat 3/10 Moderate 7 d/yr ≥98°F today · 17 d/yr by 30 yrs out
- Wind 1/10 Low
- Air quality 3/10 Moderate 2 unhealthy d/yr today · 4 by 30 yrs out
Nearby sold comps map
Loading sold comps map…
Walkable amenities ~0.75 mi
Loading nearby amenities…
Taxation est. · year 1
- Rental income
- $29,424
- − Mortgage interest
- −$13,998
- − Property taxes
- −$3,682
- − Insurance
- −$1,250
- − Repairs & maintenance
- −$2,354
- − Management
- −$2,354
- − Depreciation
- −$7,270
- Taxable loss
- −$1,483
- Est. tax savings @ 24.0%
- +$356
- After-tax cash flow
- $2,944/yr
For passive investors: Depreciation is non-cash, so a rental often shows a tax loss while cash-flowing — sheltering income. Rental losses are passive: they offset passive income freely, and up to $25,000/yr can offset ordinary (W-2) income if you actively participate and your MAGI is under $100k (phasing out to $0 by $150k); unused losses carry forward. On sale, claimed depreciation is recaptured at up to 25%, and gains may owe capital-gains tax (a 1031 exchange can defer both). Figures are a year-1 estimate at your 24.0% rate — not tax advice; consult a CPA.
Schools (NCES district)
- District
- Cuyahoga Falls City
- NCES district ID
- 3904383
- Math proficiency
- 47% ▼ -18.00%
- Reading proficiency
- 58% ▼ -7.00%
- Median HH income
- $49,587
- Composite
- 44.78/100
- National rank
- #2746
- State rank
- #408 of 656 in OH
Livability — Cuyahoga Falls
- Score
- 83/100
- State rank
- #60
- US rank
- #870
Category grades
Schools grade is shown separately in the Schools card above.
Census & demographics
- Census place
- Cuyahoga Falls, OH
- County
- Summit County · 440,783 people
- City population
- 47,005
- Metro
- Akron, OH
- Population (ZIP)
- 28,546
- Household income
- $63,342
- Rent vs Own
- Severe rent burden
- 1080.0
Population outlook (Summit County) Hauer SSP2
- Today (2025)
- 546,583 people
- By 2030
- 544,028 · -0.5%
- By 2040
- 531,363 · -2.8%
- By 2050
- 514,923 · -5.8%
- By 2075
- 481,765 · -11.9%
- By 2100
- 432,265 · -20.9%
Race, ethnicity, and origin ACS 2023
- Neighborhood character
- Predominantly White (81%)
- Race & ethnicity
- White 81% Asian 7% Black 5% Two or more races 5% Hispanic / Latino 2%
- Common ancestry
- Romanian 4% Lithuanian 2% Scotch-Irish 2%
- Foreign-born
- 7% · India, China, Canada
- Languages at home
- 90% English-only · Other Indo-European 6% Other Asian/Pacific 1% German/W. Germanic 1%
Political lean MEDSL · Summit
- 2024 margin
- Lean D (+7.0) · D 53.0% · R 46.0%
- 2008→2024 swing
- -9.6pp toward R · 2008: 16.6pp · 2024: 7.0pp
- All cycles
- 2024: D+7.0 2020: D+9.6 2016: D+8.2 2012: D+14.8 2008: D+16.6
Not yet ingested
- Civics
- —
Market trends
- HPI YoY
- ▼ -222.74%
- Current HPI
- 213.5428
- Rent YoY
- ▲ 6.95%
- Metro
- Akron, OH
- State GDP YoY
- ▲ 1.98%
- F500 in state
- 48
Industry mix (Fortune 500 HQ in OH)
| Industry | F500 HQs | Revenue |
|---|---|---|
| Insurance | 3 | $145B |
|
||
| Industrial Machinery | 3 | $49B |
|
||
| Financial Services | 3 | $24B |
|
||
| Consumer Goods | 2 | $93B |
|
||
| Aerospace / Defense | 2 | $47B |
|
||
| Utilities | 2 | $33B |
|
||
Price history
+316.5% since first listed3 events — show timeline
- 2026-05-11 Pending — MLSNOW
- 2026-05-08 Listed $249,900 MLSNOW
- 1991-09-23 Sold (Public Records) $60,000 Public Records
Property tax history
+4.0%/yrLatest (2025): $3,682 · -1.7% YoY. Source: county tax records.
Cash-flow waterfall
monthlySold comps — $/sqft
last 12 mo · ≤1 miLoading sold comps…