853 Newman Trl · Ozark Acres, AR
Flood risk 1/10 · Minimal
- FEMA flood zone
- X (unshaded)
- Chance of flooding over 30 yrs
- 0.0%
- Est. flood insurance / yr
- $507 – $1,088
Fire risk 3/10 · Minor
- Est. fire insurance / yr
- $1,499 – $2,785
Heat risk 4/10 · Minor
- Hot days now (above 108°F)
- 7 days/yr
- Hot days in 30 yrs
- 20 days/yr
Wind risk 2/10 · Minimal
- Chance of severe wind over 30 yrs
- 4.0%
Air-quality risk 1/10 · Minimal
- Unhealthy air days now
- 0 days/yr
- Unhealthy air days in 30 yrs
- 0 days/yr
Risk factors via First Street. Map © Google.
Why this score? — see what drove the B+ grade
The composite is a weighted blend of 9 inputs, each scored 0–100. Each bar is that input's sub-score; the figure is the points it added to the 100-point composite (weight × sub-score).
- Cash flow +30.0/30.0
- ARV discount +15.0/15.0
- 1% rule +10.0/10.0
- DSCR +10.0/10.0
- Appreciation +4.0/10.0
- Schools +3.4/10.0
- Rent growth +2.5/5.0
- Livability +2.5/5.0
- Condition / age +2.5/5.0
$52,500
🖨 Deal sheet (PDF) 📄 Offer letter ✓ Due diligence
Listing remarks MLS
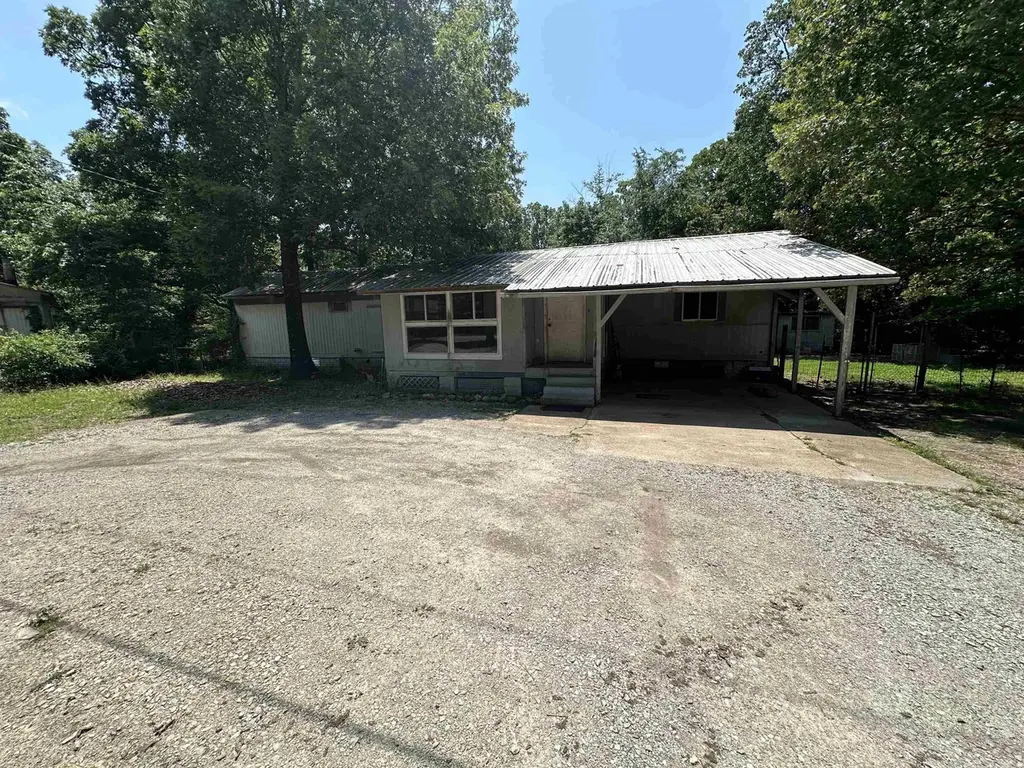
Close to Vagabond lake. Great fishing and great swimming area
Key facts
- Great fishing area
- Great swimming area
- 0.25 acre lot
Tags
Neighborhood map
What this means for you Summary
Snapshot
- This is a 3-bed/1.5-bath manufactured listed at $52k.
Deal economics
- At list price, monthly cash flow is $406 ($5k/yr) — positive.
- The deal already cash-flows at list — no discount required.
- Meets the 1% rule at list price ($911 rent vs $52k).
- Recommended offer: $46k (12.0% below list) — sets the bar for market timing.
Location & tenants
- Location reads: area grade B — affects rentability + tenant quality, not the cash-flow math above.
- Highland School District (town): math 43% / reading 39% proficiency, ranked #66 of 238 in AR (top 28%) — families likely to look elsewhere, expect single-tenant / working-renter base with shorter leases.
- Zoned schools: Cherokee Elementary School (math 58% / reading 40%, grade D, #108 of 454 statewide, top 24%, 594 students, 100% FRL); Highland Middle School (math 41% / reading 36%, grade F, #105 of 201 statewide, top 52%, 492 students, 100% FRL); Highland High School (math 31% / reading 44%, grade F, #62 of 292 statewide, top 21%, 526 students, 100% FRL) — zoned schools average 100% FRL vs 56% district-wide (44 pts higher); higher-poverty schools than district average — tighter screening recommended.
- Market conditions: 60 active listings in the ZIP; 4 units permitted in Sharp County in 2024 (0 in 5+ unit buildings).
Forward outlook
- Local home prices are declining (-1.9%/yr); year-one equity from $363 of loan paydown is wiped out by about $998 of value loss. Plan a longer hold.
- Sharp County population projected at -11% by 2050 — secular population decline; favor cash flow + early exit over multi-decade hold.
- At projected returns (-1.9% appreciation + 3.0% rent growth), your $15k cash investment doubles in ~4 years — after that, you're playing with house money.
Negotiation context
- It's been on market 618 days — a 12% lower offer ($46k) is reasonable based on typical stale-listing flexibility.
- Current owner paid $15k; list at $52k implies a 250% gain — meaningful room to come down on a strong offer.
Questions for the listing agent
- It's been on market 618 days. Have you received any prior offers? Is the seller open to a 12% concession, seller financing, or rate buy-down credit?
- Why hasn't it sold? Are there any deal-killer items the seller is aware of (foundation, flood, title, zoning, code violations)?
- Is there a deadline driving the sale (1031 exchange, divorce, estate, relocation)? That informs how much negotiation room exists.
- What's the average days-on-market for RENTAL listings here right now (not sales)? A rising rental-DOM trend means longer vacancies and softer asking-rent achievability than the comps imply.
- What's the recent tenant-quality profile in this submarket — average credit score on applications, eviction rate, late-payment / NSF rate, and stable-employment percentage? A property-management company in the area should have these aggregated.
- How much new for-sale + rental construction is in the pipeline within 1–3 miles? Heavy new supply typically softens prices + rents 12–24 months out; constrained supply supports both.
Investment metrics
- 1% rule
- 1.74% ✓
- Cap rate
- 15.56%
- Cash-on-cash
- 33.11%
- DSCR
- 2.47
- GRM
- 4.8
CMA / ARV
- ARV (median comp)
- $93,278
- List price
- $52,500
- Delta
- -43.72%
- Verdict
- UNDERPRICED
- Comps
- 9 within 1.0 mi
Projected returns pro-forma
-1.9% appreciation · 3.0% rent growth · sell at horizon
- IRR
- 30.4%
- Equity multiple
- 2.34×
- Total profit
- $19,765
- Equity at exit
- $10,441
- IRR
- 36.2%
- Equity multiple
- 4.58×
- Total profit
- $52,611
- Equity at exit
- $9,157
Cash invested: $14,700 (down + closing). Projections, not guarantees.
Landlord ↔ Tenant lean methodology
- Overall (STATE)
- 92 Strongly Landlord-Friendly
- State Arkansas
- 92 Strongly Landlord-Friendly · R+14
- County
- — inherits STATE
- City
- — inherits STATE
ZIP-level market 72482
- Home prices YoY
- -1.0%
- Active inventory
- 60
- Price-to-rent
- 4.8×
Monthly cashflow live
- Estimated rent
- $911 medium interval (Pro) →
- Mortgage (P&I)
- −$275
- Tax from tax record
- −$17 /mo · $204/yr
- Insurance
- −$22
- HOA
- −$0
- Vacancy / Maint / Mgmt
- −$191
- Net cashflow
- $406
Break-even live
Sensitivity live
| Price | -10% $435 | -5% $420 | +0% $406 | +5% $391 | +10% $376 |
|---|---|---|---|---|---|
| Rent | -10% $334 | -5% $370 | +0% $406 | +5% $442 | +10% $478 |
| Rate | -1.0pp $432 | -0.5pp $419 | base $406 | +0.5pp $392 | +1.0pp $378 |
UW: 25.0% down · 7.5% · 30yr · 1.5% tax · 5.0% vac · 8.0% maint · 8.0% mgmt
Financing live
Cash to close
- Down payment
- $13,125
- Closing costs
- $1,575
- Reserves months
- —
- Total cash needed
- —
Loan-product check · same deal, 3 products live
Conventional
25% down · 7.5% · 30yr
- Down + closing
- —
- Monthly P&I
- —
- Monthly cashflow
- —
- DSCR
- —
- Eligible?
- —
Personal DTI + credit; lowest rate.
DSCR
20% down · 8.5% · 30yr
- Down + closing
- —
- Monthly P&I
- —
- Monthly cashflow
- —
- DSCR
- —
- Eligible?
- —
No personal income docs; deal must DSCR.
Hard money
10% down · 12.0% · 12mo
- Down + closing
- —
- Monthly P&I
- —
- Monthly cashflow
- —
- DSCR
- —
- Eligible?
- —
Short-term bridge; refi at stabilization.
Listing history 19 events
-
2026-06-21days on market $52,500 Active 618 DOM
-
2026-06-19days on market $52,500 Active 616 DOM
-
2026-06-18days on market $52,500 Active 615 DOM
-
2026-06-17days on market $52,500 Active 614 DOM
-
2026-06-16days on market $52,500 Active 613 DOM
-
2026-06-15days on market $52,500 Active 612 DOM
-
2026-06-14days on market $52,500 Active 610 DOM
-
2026-06-12days on market $52,500 Active 609 DOM
-
2026-06-09days on market $52,500 Active 606 DOM
-
2026-06-08days on market $52,500 Active 605 DOM
-
2026-06-07days on market $52,500 Active 604 DOM
-
2026-06-04days on market $52,500 Active 600 DOM
-
2026-06-02days on market $52,500 Active 599 DOM
-
2026-06-01days on market $52,500 Active 598 DOM
-
2026-05-31days on market $52,500 Active 597 DOM
-
2026-05-31days on market $52,500 Active 596 DOM
-
2024-08-01$52,500 New Listing 61-char remark
Show marketing remark (61 chars)
Close to Vagabond lake. Great fishing and great swimming area
-
2001-11-14soldstatus $15,000
-
1997-06-06soldstatus $22,000
ⓘ Source: listings_history table (triggers on properties + properties_extension) + one-shot
backfill from property_details.listing_events for pre-trigger history.
Tax reassessment forecast AR · Resets to sale price
- Current annual tax
- $204 · $17/mo
- Projected year-2 tax
- $336 · $28/mo
- Expected delta
- +$132/yr (+$11/mo · 64.4%)
ⓘ Screening estimate from a state-policy table — verify with the county assessor before closing.
Climate risk First Street
- Flood 1/10 Low FEMA zone X (unshaded) · 0% chance over 30 yrs
- Wildfire 3/10 Moderate
- Heat 4/10 Moderate 7 d/yr ≥108°F today · 20 d/yr by 30 yrs out
- Wind 2/10 Low 4% chance of damaging wind over 30 yrs
- Air quality 1/10 Low 0 unhealthy d/yr today · 0 by 30 yrs out
Nearby sold comps map
Loading sold comps map…
Walkable amenities ~0.75 mi
Loading nearby amenities…
Taxation est. · year 1
- Rental income
- $10,934
- − Mortgage interest
- −$2,941
- − Property taxes
- −$204
- − Insurance
- −$262
- − Repairs & maintenance
- −$875
- − Management
- −$875
- − Depreciation
- −$1,527
- Taxable income
- $4,249
- Est. tax owed @ 24.0%
- −$1,020
- After-tax cash flow
- $3,847/yr
For passive investors: Depreciation is non-cash, so a rental often shows a tax loss while cash-flowing — sheltering income. Rental losses are passive: they offset passive income freely, and up to $25,000/yr can offset ordinary (W-2) income if you actively participate and your MAGI is under $100k (phasing out to $0 by $150k); unused losses carry forward. On sale, claimed depreciation is recaptured at up to 25%, and gains may owe capital-gains tax (a 1031 exchange can defer both). Figures are a year-1 estimate at your 24.0% rate — not tax advice; consult a CPA.
Schools (NCES district)
- District
- Highland School District
- NCES district ID
- 0507770
- Math proficiency
- 43% ▼ -7.00%
- Reading proficiency
- 39% ▼ -9.00%
- Median HH income
- $32,066
- Composite
- 33.63/100
- National rank
- #5400
- State rank
- #66 of 238 in AR
Livability — Ozark Acres
No livability data for this city. (Only ~50 U.S. cities are tracked.)
Census & demographics
- Census place
- Ozark Acres, AR
- Population (ZIP)
- 1,481
Population outlook (Sharp County) Hauer SSP2
- Today (2025)
- 16,170 people
- By 2030
- 15,711 · -2.8%
- By 2040
- 14,974 · -7.4%
- By 2050
- 14,420 · -10.8%
- By 2075
- 13,235 · -18.2%
- By 2100
- 11,492 · -28.9%
Race, ethnicity, and origin ACS 2023
- Neighborhood character
- Predominantly White (92%)
- Race & ethnicity
- White 92% Two or more races 7%
- Common ancestry
- Lithuanian 4% Iranian 2% Portuguese 2%
- Foreign-born
- 1% · Canada
Political lean MEDSL · Sharp
- 2024 margin
- Solid R (+62.7) · D 17.7% · R 80.4% · Other 1.9%
- 2008→2024 swing
- -33.7pp toward R · 2008: -28.9pp · 2024: -62.7pp
- All cycles
- 2024: R+62.7 2020: R+60.0 2016: R+54.7 2012: R+38.8 2008: R+28.9
Not yet ingested
- Civics
- —
Market trends
- HPI YoY
- ▼ -1.90%
- Current HPI
- 194.2165
- Rent YoY
- —
- Metro
- —
- State GDP YoY
- ▲ 3.80%
- F500 in state
- 10
Industry mix (Fortune 500 HQ in AR)
| Industry | F500 HQs | Revenue |
|---|---|---|
| Retail | 1 | $681B |
|
||
| Food / Agriculture | 1 | $53B |
|
||
| Retail / Energy | 1 | $22B |
|
||
| Transportation / Logistics | 1 | $12B |
|
||
| Energy | 1 | $4B |
|
||
Price history
+138.6% since first listed3 events — show timeline
- 2024-08-01 Listed $52,500 CARMLS
- 2001-11-14 Sold (Public Records) $15,000 Public Records
- 1997-06-06 Sold (Public Records) $22,000 Public Records
Property tax history
+3.5%/yrLatest (2025): $204 · +0.0% YoY. Source: county tax records.
Cash-flow waterfall
monthlySold comps — $/sqft
last 12 mo · ≤1 miLoading sold comps…