314 Cr 211 Cir W · Alice, TX
Flood risk 1/10 · Minimal
- FEMA flood zone
- X (unshaded)
- Chance of flooding over 30 yrs
- 0.0%
- Est. flood insurance / yr
- $507 – $1,088
Fire risk 6/10 · Moderate
- Est. fire insurance / yr
- $1,222 – $2,270
Heat risk 9/10 · Severe
- Hot days now (above 111°F)
- 7 days/yr
- Hot days in 30 yrs
- 21 days/yr
Wind risk 9/10 · Severe
- Chance of severe wind over 30 yrs
- 99.0%
Air-quality risk 1/10 · Minimal
- Unhealthy air days now
- 0 days/yr
- Unhealthy air days in 30 yrs
- 0 days/yr
Risk factors via First Street. Map © Google.
Why this score? — see what drove the D+ grade
The composite is a weighted blend of 9 inputs, each scored 0–100. Each bar is that input's sub-score; the figure is the points it added to the 100-point composite (weight × sub-score).
- Cash flow +18.9/30.0
- ARV discount +7.5/15.0
- DSCR +6.0/10.0
- 1% rule +4.7/10.0
- Livability +3.4/5.0
- Rent growth +2.5/5.0
- Schools +1.5/10.0
- Condition / age +1.0/5.0
- Appreciation +0.0/10.0
$162,900
🖨 Deal sheet 📄 Offer letter ✓ Due diligence
Listing remarks MLS
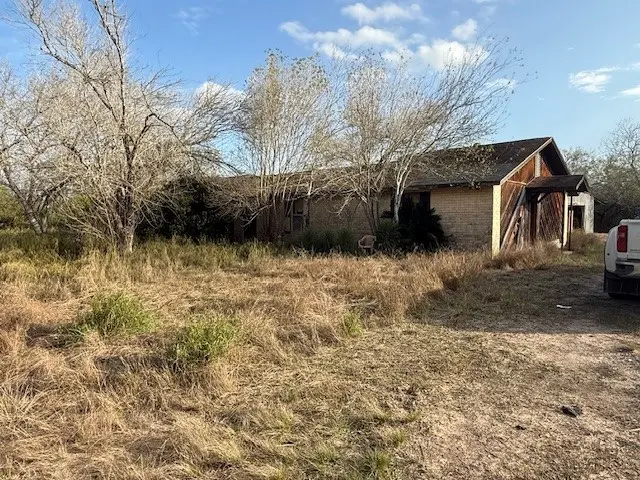
This is a great chance to live on your own small acreage property; at this price, you can renovate the interior to your own taste. The house sits on 2.71 acres; a very well built barn/garage is included. It is bordered by a much larger acreage tract to the south, and 6 acres to the west. The GLA is recorded as 1883 square feet, but an additional 1000 square feet was added. Total square footage will need to be verified.
Key facts
- 2.71 acre lot
- 2 garage spots
- Built 1977
Tags
Neighborhood map
What this means for you Summary
Snapshot
- This is a 4-bed/2.0-bath single-family listed at $163k. Condition is rated poor.
Deal economics
- At list price, monthly cash flow is $168 ($2k/yr) — positive.
- The deal already cash-flows at list — no discount required.
- To meet the 1% rule (rent ≥ 1% of price), the offer needs to be $157k (3.4% below list).
- Recommended offer: $148k (9.0% below list) — sets the bar for market timing.
- Cap rate 7.5% vs local median 4.1% in Alice — top-decile yield for the area; either an underpriced asset or a hidden risk that comps aren't pricing in. Stress-test before assuming the spread holds.
Location & tenants
- Location reads 67/100 on livability (#558 in TX) — a middle-class / working-renter tenant base. Strengths: cost of living A+, health & safety A+, housing A; Watch: employment D, schools D-, crime F.
- Alice ISD (town): math 12% / reading 23% proficiency, ranked #799 of 826 in TX (top 97%) — low school quality limits family demand, transient renter base, plan for 1-2y turnover; 70% free/reduced lunch — lower-income household profile, screen leases tightly.
- Market conditions: 220 active listings in the ZIP; 6 units permitted in Jim Wells County in 2024 (0 in 5+ unit buildings).
Forward outlook
- Local home prices are declining (-3.0%/yr); year-one equity from $1k of loan paydown is wiped out by about $5k of value loss. Plan a longer hold.
- Jim Wells County population projected at +10% by 2050 — modest demand growth; plan on rents tracking national, not racing it.
Negotiation context
- It's been on market 100 days — a 9% lower offer ($148k) is reasonable based on typical stale-listing flexibility.
Risks & watch-outs
- Climate carrying-cost: severe wind risk, 99% chance of damaging wind over 30y; major wildfire risk; extreme-heat days projected 7→21/yr by 2055 (HVAC capex compounding) — expect insurance premiums to compound above CPI over the hold.
Questions for the listing agent
- It's been on market 100 days. Have you received any prior offers? Is the seller open to a 9% concession, seller financing, or rate buy-down credit?
- Have any recent inspections been done? Can we get a copy of the seller's disclosures and any deferred-maintenance estimates?
- Built in 1977 — when were the roof, HVAC, electrical panel, plumbing, and water heater last replaced?
- Why hasn't it sold? Are there any deal-killer items the seller is aware of (foundation, flood, title, zoning, code violations)?
- Is there a deadline driving the sale (1031 exchange, divorce, estate, relocation)? That informs how much negotiation room exists.
- Schools are D-rated, which usually means shorter tenancies and higher turnover. Who's the typical renter profile here, and what's been the actual vacancy rate?
- Crime grade is F in this area — have there been break-ins, vandalism, or insurance claims at this property in the last 3 years? What carrier currently insures it and at what premium?
- The area grade is low — what's the realistic commute time and amenity access for the typical tenant pool here? Any planned neighborhood developments (good or bad) we should know about?
- What's the average days-on-market for RENTAL listings here right now (not sales)? A rising rental-DOM trend means longer vacancies and softer asking-rent achievability than the comps imply.
- What's the recent tenant-quality profile in this submarket — average credit score on applications, eviction rate, late-payment / NSF rate, and stable-employment percentage? A property-management company in the area should have these aggregated.
- How much new for-sale + rental construction is in the pipeline within 1–3 miles? Heavy new supply typically softens prices + rents 12–24 months out; constrained supply supports both.
Investment metrics
- 1% rule
- 0.97% ✗
- Cap rate
- 7.53%
- Cash-on-cash
- 4.41%
- DSCR
- 1.20
- GRM
- 8.6
CMA / ARV
- ARV (median comp)
- $353,151
- List price
- $162,900
- Delta
- -53.87%
- Verdict
- UNDERPRICED
- Comps
- 2 within 1.0 mi
Show comp detail 1 sale within ~0.75 mi
| Address | Dist | Beds/Ba | Sqft | Sold | Price | $/sf | Match |
|---|---|---|---|---|---|---|---|
| 213 Cr 2101 | 0.41mi | 4/2.0 | 2,006 (+6%) | 12mo | $395,000 | $197 | 60 |
Match score weights: distance 35% · size 25% · config 20% · recency 20%. Top-matched comps best support the ARV.
Projected returns pro-forma
-3.0% appreciation · 3.0% rent growth · sell at horizon
- IRR
- -9.4%
- Equity multiple
- 0.66×
- Total profit
- $-15,720
- Equity at exit
- $24,289
- IRR
- 0.0%
- Equity multiple
- 1.00×
- Total profit
- $40
- Equity at exit
- $14,085
Cash invested: $45,612 (down + closing). Projections, not guarantees.
Landlord ↔ Tenant lean methodology
- Overall (STATE)
- 87 Strongly Landlord-Friendly
- State Texas
- 87 Strongly Landlord-Friendly · R+5
- County
- — inherits STATE
- City
- — inherits STATE
ZIP-level market 78332
- Active inventory
- 220
- Price-to-rent
- 8.6×
Monthly cashflow live
- Estimated rent
- $1,574 medium interval (Pro) →
- Mortgage (P&I)
- −$854
- Tax from tax record
- −$154 /mo · $1,843/yr
- Insurance
- −$68
- HOA
- −$0
- Vacancy / Maint / Mgmt
- −$331
- Net cashflow
- $168
Break-even live
UW: 25.0% down · 7.5% · 30yr · 1.5% tax · 5.0% vac · 8.0% maint · 8.0% mgmt
Financing live
Cash to close
- Down payment
- $40,725
- Closing costs
- $4,887
- Reserves months
- —
- Total cash needed
- —
Loan-product check · same deal, 3 products live
Conventional
25% down · 7.5% · 30yr
- Down + closing
- —
- Monthly P&I
- —
- Monthly cashflow
- —
- DSCR
- —
- Eligible?
- —
Personal DTI + credit; lowest rate.
DSCR
20% down · 8.5% · 30yr
- Down + closing
- —
- Monthly P&I
- —
- Monthly cashflow
- —
- DSCR
- —
- Eligible?
- —
No personal income docs; deal must DSCR.
Hard money
10% down · 12.0% · 12mo
- Down + closing
- —
- Monthly P&I
- —
- Monthly cashflow
- —
- DSCR
- —
- Eligible?
- —
Short-term bridge; refi at stabilization.
Listing history 15 events
-
2026-06-18days on market $162,900 Active 100 DOM
-
2026-06-17days on market $162,900 Active 99 DOM
-
2026-06-16days on market $162,900 Active 98 DOM
-
2026-06-15days on market $162,900 Active 97 DOM
-
2026-06-13days on market $162,900 Active 95 DOM
-
2026-06-12days on market $162,900 Active 94 DOM
-
2026-06-09days on market $162,900 Active 91 DOM
-
2026-06-08days on market $162,900 Active 90 DOM
-
2026-06-08days on market $162,900 Active 89 DOM
-
2026-06-07days on market $162,900 Active 88 DOM
-
2026-06-03days on market $162,900 Active 85 DOM
-
2026-06-02days on market $162,900 Active 84 DOM
-
2026-06-01days on market $162,900 Active 83 DOM
-
2026-05-31days on market $162,900 Active 82 DOM
-
2025-03-06$162,900 Active 422-char remark
Show marketing remark (422 chars)
This is a great chance to live on your own small acreage property; at this price, you can renovate the interior to your own taste. The house sits on 2.71 acres; a very well built barn/garage is included. It is bordered by a much larger acreage tract to the south, and 6 acres to the west. The GLA is recorded as 1883 square feet, but an additional 1000 square feet was added. Total square footage will need to be verified.
ⓘ Source: listings_history table (triggers on properties + properties_extension) + one-shot
backfill from property_details.listing_events for pre-trigger history.
Tax reassessment forecast TX · Resets to sale price
- Current annual tax
- $1,843 · $154/mo
- Projected year-2 tax
- $2,981 · $248/mo
- Expected delta
- +$1,138/yr (+$95/mo · 61.8%)
ⓘ Screening estimate from a state-policy table — verify with the county assessor before closing.
Climate risk First Street
- Flood 1/10 Low FEMA zone X (unshaded) · 0% chance over 30 yrs
- Wildfire 6/10 Major
- Heat 9/10 Extreme 7 d/yr ≥111°F today · 21 d/yr by 30 yrs out
- Wind 9/10 Extreme 99% chance of damaging wind over 30 yrs
- Air quality 1/10 Low 0 unhealthy d/yr today · 0 by 30 yrs out
Nearby sold comps map
Loading sold comps map…
Walkable amenities ~0.75 mi
Loading nearby amenities…
Taxation est. · year 1
- Rental income
- $18,888
- − Mortgage interest
- −$9,125
- − Property taxes
- −$1,843
- − Insurance
- −$814
- − Repairs & maintenance
- −$1,511
- − Management
- −$1,511
- − Depreciation
- −$4,739
- Taxable loss
- −$655
- Est. tax savings @ 24.0%
- +$157
- After-tax cash flow
- $2,170/yr
For passive investors: Depreciation is non-cash, so a rental often shows a tax loss while cash-flowing — sheltering income. Rental losses are passive: they offset passive income freely, and up to $25,000/yr can offset ordinary (W-2) income if you actively participate and your MAGI is under $100k (phasing out to $0 by $150k); unused losses carry forward. On sale, claimed depreciation is recaptured at up to 25%, and gains may owe capital-gains tax (a 1031 exchange can defer both). Figures are a year-1 estimate at your 24.0% rate — not tax advice; consult a CPA.
Condition & rehab AI · 3 photos
This property is in a state of abandonment and requires extensive repairs and maintenance to be considered habitable. Significant work is needed to address the roof, exterior, and landscaping to improve its value.
Repairs flagged
- Major roof — Missing shingles
- Major exterior — Overgrown vegetation
- Major barn — Structurally compromised
Value-add opportunities
- Both landscaping and clearing vegetation — Improves curb appeal and safety
- Both roof repair — Essential for structural integrity and safety
- Both exterior maintenance — Enhances curb appeal and safety
Renovation cost estimate screening
| Repair item | Severity | Est. cost |
|---|---|---|
| roof · Missing shingles | Major | $15,000–50,000 |
| exterior · Overgrown vegetation | Major | $15,000–50,000 |
| barn · Structurally compromised | Major | $15,000–50,000 |
| Total estimated repair cost · 3 items | $45,000–150,000 |
Value-add ROI direction
- Both landscaping and clearing vegetation — Improves curb appeal and safety ↑
- Both roof repair — Essential for structural integrity and safety ↑
- Both exterior maintenance — Enhances curb appeal and safety ↑
ⓘ Cost ranges are severity-bucket heuristics (US national rule-of-thumb). Get contractor quotes + a written scope before underwriting a rehab budget.
Schools (NCES district)
- District
- Alice ISD
- NCES district ID
- 4807800
- Math proficiency
- 12% ▼ -18.00%
- Reading proficiency
- 23% ▼ -7.00%
- Median HH income
- $37,747
- Composite
- 14.63/100
- National rank
- #9407
- State rank
- #799 of 826 in TX
Livability — Alice
- Score
- 67/100
- State rank
- #558
- US rank
- #10742
Category grades
Schools grade is shown separately in the Schools card above.
Census & demographics
- Population (ZIP)
- 27,281
Population outlook (Jim Wells County) Hauer SSP2
- Today (2025)
- 43,325 people
- By 2030
- 44,156 · +1.9%
- By 2040
- 45,790 · +5.7%
- By 2050
- 47,455 · +9.5%
- By 2075
- 51,800 · +19.6%
- By 2100
- 52,006 · +20.0%
Race, ethnicity, and origin ACS 2023
- Neighborhood character
- Predominantly Hispanic (84%)
- Race & ethnicity
- Hispanic / Latino 84% White 14% Two or more races 14%
- Hispanic origin (detail)
- Mexican 76%
- Foreign-born
- 4% · Canada
- Languages at home
- 50% English-only · Spanish 49%
Political lean MEDSL · Jim Wells
- 2024 margin
- R (+15.5) · D 42.0% · R 57.5%
- 2008→2024 swing
- -31.6pp toward R · 2008: 16.1pp · 2024: -15.5pp
- All cycles
- 2024: R+15.5 2020: R+9.8 2016: D+10.3 2012: D+17.0 2008: D+16.1
Not yet ingested
- Civics
- —
Market trends
- HPI YoY
- ▼ -123.86%
- Current HPI
- 77.6253
- Rent YoY
- —
- Metro
- —
- State GDP YoY
- ▲ 3.95%
- F500 in state
- 110
Industry mix (Fortune 500 HQ in TX)
| Industry | F500 HQs | Revenue |
|---|---|---|
| Energy | 16 | $1,198B |
|
||
| Technology | 5 | $198B |
|
||
| Engineering / Construction | 4 | $72B |
|
||
| Energy Services | 3 | $60B |
|
||
| Utilities | 3 | $41B |
|
||
| Healthcare | 2 | $330B |
|
||
Price history
1 event — show timeline
- 2025-03-06 Listed $162,900 CBMLS
Property tax history
+0.6%/yrLatest (2025): $1,843 · +0.6% YoY. Source: county tax records.
Cash-flow waterfall
monthlySold comps — $/sqft
last 12 mo · ≤1 miLoading sold comps…