 🏗️ New Construction
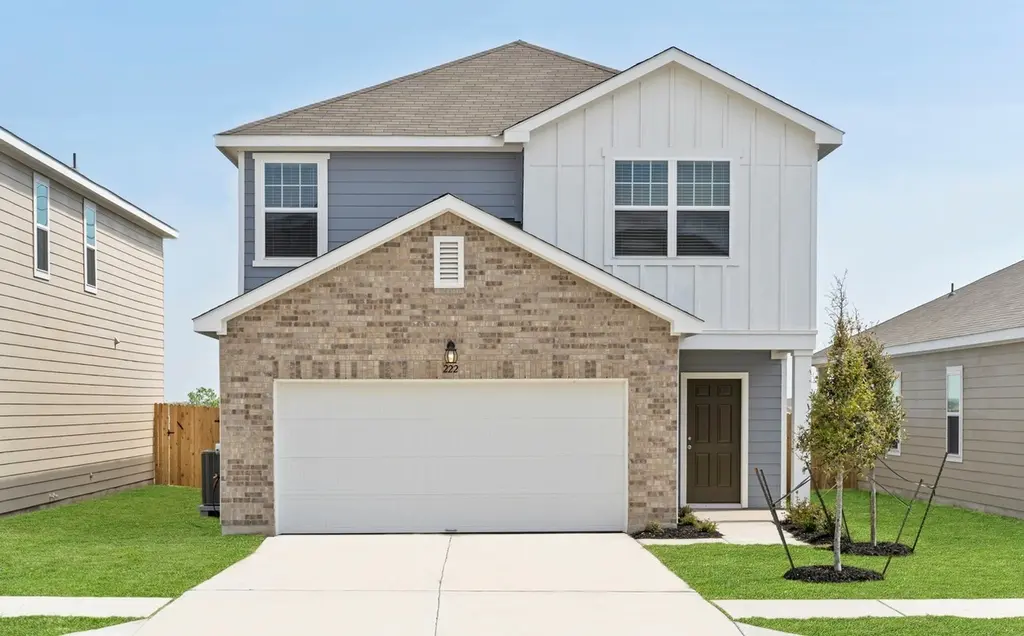
9518 Travertine Ct · Cut and Shoot, TX
Flood risk No data
- FEMA flood zone
- —
- Chance of flooding over 30 yrs
- —
- Est. flood insurance / yr
- —
Fire risk No data
- Est. fire insurance / yr
- —
Heat risk No data
- Hot days now (above threshold)
- —
- Hot days in 30 yrs
- —
Wind risk No data
- Chance of severe wind over 30 yrs
- —
Air-quality risk No data
- Unhealthy air days now
- —
- Unhealthy air days in 30 yrs
- —
Risk factors via First Street. Map © Google.
Why this score? — see what drove the D- grade
The composite is a weighted blend of 9 inputs, each scored 0–100. Each bar is that input's sub-score; the figure is the points it added to the 100-point composite (weight × sub-score).
- Cash flow +10.4/30.0
- ARV discount +7.5/15.0
- Schools +5.1/10.0
- Condition / age +4.0/5.0
- 1% rule +3.3/10.0
- DSCR +3.0/10.0
- Livability +2.8/5.0
- Rent growth +2.4/5.0
- Appreciation +0.0/10.0
$274,990
🖨 Deal sheet (PDF) 📄 Offer letter ✓ Due diligence
Listing remarks
Spacious Two-Story Living with LVP Flooring and First-Floor Guest Suite The Magellan is a beautifully designed two-story home offering 2,260 square feet with 4 bedrooms, 3 bathrooms, and a 2-car garage. One bedroom and a full bath are located on the first floor, ideal for guests or flexible living. The open-concept main level features LVP flooring throughout the main living areas and a modern kitchen with granite countertops, a large island, soft close cabinets and drawers, and stainless steel appliances, creating a seamless flow for everyday living and entertaining. Upstairs includes a spacious game room and a private primary suite with a walk-in closet and en suite bath. Located in the S
Key facts
- Large island
- Soft close cabinets
- Lvp flooring
Tags
Property features AI
Finance
- Other: Full ownership
- HOA & community: Stonebrooke Community Association with an annual association fee of $550
Exterior
- Parking: Attached 2-car garage
- Security: Smoke detectors
- Utilities: Public water; Public sewer
- Home design: Residential property; New construction (under construction); Slab foundation; Composition roof
- Construction: Built by Starlight Homes; Cement siding; Year built: 2026
- Exterior features: Deck; Patio; Fully fenced backyard
Interior
- Kitchen: Dishwasher; Electric oven; Electric range; Microwave; Garbage disposal; Refrigerator
- Bedrooms: Primary bedroom on second level (approx. 15.5 x 15); Second-level bedroom (approx. 15.5 x 10.5); Second-level bedroom (approx. 12 x 13); First-level bedroom (approx. 11 x 12)
- Flooring: Carpet; Plank; Vinyl
- Bathrooms: 3 full bathrooms
- Heating & cooling: Central heating (electric); Central air conditioning (electric)
- Interior features: Granite counters; High ceilings; Kitchen island; Kitchen/family room combo; Pantry; Self-closing cabinet doors and drawers; Tub with shower; Programmable thermostat; Low emissivity windows; Ventilation for improved indoor air quality
- Laundry & utility: Washer hookup; Electric dryer hookup; Washer and dryer included
Neighborhood map
What this means for you Summary
Snapshot
- This is a 4-bed/3.0-bath single-family listed at $275k. Condition is rated good.
Deal economics
- At list price, monthly cash flow is $-156 ($-2k/yr) — negative.
- To cash-flow at today's rent, offer at most $269k (2.2% below list).
- To meet the 1% rule (rent ≥ 1% of price), the offer needs to be $241k (12.3% below list).
- Recommended offer: $241k (12.3% below list) — sets the bar for 1% rule.
Location & tenants
- Location reads 56/100 on livability (#1,326 in TX) — a working-class tenant base; expect higher turnover. Strengths: cost of living A+, housing A+; Watch: crime D-, amenities F, commute F.
- Conroe ISD (other): math 57% / reading 57% proficiency, ranked #69 of 826 in TX (top 8%) — acceptable for families but not a draw, mixed tenant base, ~2y average lease.
- Zoned schools: Patterson El (math 33% / reading 35%, grade F, #2,149 of 4,322 statewide, top 50%, 977 students, 74% FRL); Bozman Int (math 44% / reading 40%, grade D-, #572 of 1,662 statewide, top 36%, 988 students, 68% FRL); Conroe H S (math 32% / reading 51%, grade F, #767 of 1,632 statewide, top 47%, 4,915 students, 61% FRL) — zoned schools average 68% FRL vs 34% district-wide (33 pts higher); higher-poverty schools than district average — tighter screening recommended.
- Zoned-school proficiency averages 39% at this address vs 57% district-wide (-18 pts) — the specific schools serving this property underperform the Conroe ISD average; the district grade overstates school quality for this exact location.
- Market conditions: Rents soft (-0.3%/yr); 721 active listings in the ZIP; 1 comparable units currently listed for rent nearby; solid renter incomes; 13,259 units permitted in Montgomery County in 2024 (1,402 in 5+ unit buildings).
- This rent runs 38% of the median local income ($75k/yr) — at the standard rent-burdened threshold; future hikes will face affordability resistance.
Forward outlook
- Local home prices are declining (-3.0%/yr); year-one equity from $2k of loan paydown is wiped out by about $9k of value loss. Plan a longer hold.
- Montgomery County population projected at +65% by 2050 — long-run rental-demand tailwind backs the buy-and-hold thesis.
Negotiation context
- Only 12 days on market — expect competitive offers; lowballing is unlikely to land.
Questions for the listing agent
- What do current leases actually rent for vs. the listed asking? Can we see a recent rent roll and the last 12 months of T-12 income?
- What does the HOA fee cover, when was the last increase, and are there any pending special assessments or reserve-fund shortfalls?
- Is there a deadline driving the sale (1031 exchange, divorce, estate, relocation)? That informs how much negotiation room exists.
- Schools are F-rated, which usually means shorter tenancies and higher turnover. Who's the typical renter profile here, and what's been the actual vacancy rate?
- Crime grade is D in this area — have there been break-ins, vandalism, or insurance claims at this property in the last 3 years? What carrier currently insures it and at what premium?
- The area grade is low — what's the realistic commute time and amenity access for the typical tenant pool here? Any planned neighborhood developments (good or bad) we should know about?
- What's the average days-on-market for RENTAL listings here right now (not sales)? A rising rental-DOM trend means longer vacancies and softer asking-rent achievability than the comps imply.
- What's the recent tenant-quality profile in this submarket — average credit score on applications, eviction rate, late-payment / NSF rate, and stable-employment percentage? A property-management company in the area should have these aggregated.
- How much new for-sale + rental construction is in the pipeline within 1–3 miles? Heavy new supply typically softens prices + rents 12–24 months out; constrained supply supports both.
Investment metrics
- 1% rule
- 0.83% ✗
- Cap rate
- 5.65%
- Cash-on-cash
- -2.30%
- DSCR
- 0.90
- GRM
- 10.1
CMA / ARV
- ARV (on-the-fly)
- $291,540
- Comps found
- 12
Show comp detail 12 sales within ~0.75 mi
| Address | Dist | Beds/Ba | Sqft | Sold | Price | $/sf | Match |
|---|---|---|---|---|---|---|---|
| 9151 Stonebrooke Chase Dr | 0.03mi | 4/3.0 | 2,260 (0%) | 3mo | $291,000 | $129 | 96 |
| 9428 Beryl Ln | 0.22mi | 4/3.0 | 2,260 (0%) | 2mo | $287,800 | $127 | 89 |
| 9384 Beryl Ln | 0.22mi | 4/3.0 | 2,260 (0%) | 2mo | $297,800 | $132 | 88 |
| 9159 Stonebrooke Chase Dr | 0.03mi | 4/2.5 | 2,121 (-6%) | 2mo | $277,000 | $131 | 85 |
| 9437 Beryl Ln | 0.22mi | 4/2.5 | 2,121 (-6%) | 1mo | $272,500 | $128 | 77 |
| 9404 Beryl Ln | 0.22mi | 4/2.5 | 2,121 (-6%) | 1mo | $274,300 | $129 | 77 |
| 9376 Beryl Ln | 0.22mi | 4/2.5 | 2,121 (-6%) | 2mo | $234,990 | $111 | 76 |
| 9349 Beryl Ln | 0.22mi | 4/2.5 | 2,121 (-6%) | 3mo | $219,990 | $104 | 75 |
| 9340 Hard Rock Rd | 0.08mi | 4/2.5 | 2,025 (-10%) | 3mo | $254,900 | $126 | 75 |
| 12859 Lime Stone Ln | 0.11mi | 4/2.5 | 2,025 (-10%) | 3mo | $261,400 | $129 | 73 |
| 9160 Wapiti Trl | 0.75mi | 4/2.5 | 2,442 (+8%) | 1mo | $479,000 | $196 | 49 |
| 9106 Wapiti Trl | 0.57mi | 3/2.5 (-1) | 2,542 (+12%) | 3mo | $450,000 | $177 | 44 |
Match score weights: distance 35% · size 25% · config 20% · recency 20%. Top-matched comps best support the ARV.
Projected returns pro-forma
-3.0% appreciation · 0.0% rent growth · sell at horizon
- IRR
- -23.6%
- Equity multiple
- 0.21×
- Total profit
- $-64,200
- Equity at exit
- $43,470
- IRR
- -30.0%
- Equity multiple
- -0.17×
- Total profit
- $-95,766
- Equity at exit
- $25,207
Cash invested: $81,631 (down + closing). Projections, not guarantees.
Landlord ↔ Tenant lean methodology
- Overall (STATE)
- 87 Strongly Landlord-Friendly
- State Texas
- 87 Strongly Landlord-Friendly · R+5
- County
- — inherits STATE
- City
- — inherits STATE
ZIP-level market 77303
- Home prices YoY
- -22.4%
- Rents YoY
- -0.3%
- Active inventory
- 721
- Price-to-rent
- 9.5×
Monthly cashflow live
- Estimated rent
- $2,411 medium interval (Pro) →
- Mortgage (P&I)
- −$1,529
- Tax est. 1.5%
- −$364 /mo · $4,373/yr
- Insurance
- −$121
- HOA
- −$46
- Vacancy / Maint / Mgmt
- −$506
- Net cashflow
- $-156
Break-even live
Sensitivity live
| Price | -10% $45 | -5% $-56 | +0% $-156 | +5% $-257 | +10% $-358 |
|---|---|---|---|---|---|
| Rent | -10% $-347 | -5% $-252 | +0% $-156 | +5% $-61 | +10% $34 |
| Rate | -1.0pp $-10 | -0.5pp $-82 | base $-156 | +0.5pp $-232 | +1.0pp $-309 |
UW: 25.0% down · 7.5% · 30yr · 1.5% tax · 5.0% vac · 8.0% maint · 8.0% mgmt
Financing live
Cash to close
- Down payment
- $72,885
- Closing costs
- $8,746
- Reserves months
- —
- Total cash needed
- —
Loan-product check · same deal, 3 products live
Conventional
25% down · 7.5% · 30yr
- Down + closing
- —
- Monthly P&I
- —
- Monthly cashflow
- —
- DSCR
- —
- Eligible?
- —
Personal DTI + credit; lowest rate.
DSCR
20% down · 8.5% · 30yr
- Down + closing
- —
- Monthly P&I
- —
- Monthly cashflow
- —
- DSCR
- —
- Eligible?
- —
No personal income docs; deal must DSCR.
Hard money
10% down · 12.0% · 12mo
- Down + closing
- —
- Monthly P&I
- —
- Monthly cashflow
- —
- DSCR
- —
- Eligible?
- —
Short-term bridge; refi at stabilization.
Rent comps 1 comps
| Address | Beds | Baths | Sqft | Rent | $/sqft | DOM | Units | Dist |
|---|---|---|---|---|---|---|---|---|
| 12446 Willis Waukegan Rd Conroe, TX | 5.0 | 3.5 | 2892 | $3,500 | $1.21 | 45d | 1 | 0.49mi |
HOA detail
- Monthly dues
- $46 · $552/yr
Listing history 8 events
-
2026-06-21days on market $274,990 Active 12 DOM
-
2026-06-18days on market $274,990 Active 9 DOM
-
2026-06-17days on market $274,990 Active 8 DOM
-
2026-06-16days on market $274,990 Active 7 DOM
-
2026-06-15days on market $274,990 Active 6 DOM
-
2026-06-13days on market $274,990 Active 4 DOM
-
2026-06-10remarks 699-char remark
-
2026-06-10$274,990 Active 1 DOM
ⓘ Source: listings_history table (triggers on properties + properties_extension) + one-shot
backfill from property_details.listing_events for pre-trigger history.
Nearby sold comps map
Loading sold comps map…
Walkable amenities ~0.75 mi
Loading nearby amenities…
Taxation est. · year 1
- Rental income
- $28,928
- − Mortgage interest
- −$16,331
- − Property taxes
- −$4,373
- − Insurance
- −$1,458
- − Repairs & maintenance
- −$2,314
- − Management
- −$2,314
- − HOA
- −$552
- − Depreciation
- −$8,481
- Taxable loss
- −$6,895
- Est. tax savings @ 24.0%
- +$1,655
- After-tax cash flow
- $-221/yr
For passive investors: Depreciation is non-cash, so a rental often shows a tax loss while cash-flowing — sheltering income. Rental losses are passive: they offset passive income freely, and up to $25,000/yr can offset ordinary (W-2) income if you actively participate and your MAGI is under $100k (phasing out to $0 by $150k); unused losses carry forward. On sale, claimed depreciation is recaptured at up to 25%, and gains may owe capital-gains tax (a 1031 exchange can defer both). Figures are a year-1 estimate at your 24.0% rate — not tax advice; consult a CPA.
Condition & rehab AI · 12 photos
This two-story home is in excellent condition with modern finishes and a spacious layout. It is move-in ready and offers high ROI potential through minor updates.
Value-add opportunities
- Both Painting exterior and interior walls — Enhances curb appeal and interior aesthetics
- Both Replacing LVP flooring with hardwood or tile — Improves durability and adds value
- Both Upgrading kitchen appliances — Modernizes the space and adds value
- Both Adding smart home features — Enhances convenience and adds value
Renovation cost estimate screening
Value-add ROI direction
- Both Painting exterior and interior walls — Enhances curb appeal and interior aesthetics ↑
- Both Replacing LVP flooring with hardwood or tile — Improves durability and adds value ↑
- Both Upgrading kitchen appliances — Modernizes the space and adds value ↑
- Both Adding smart home features — Enhances convenience and adds value ↑
ⓘ Cost ranges are severity-bucket heuristics (US national rule-of-thumb). Get contractor quotes + a written scope before underwriting a rehab budget.
Schools (NCES district)
- District
- Conroe ISD
- NCES district ID
- 4815000
- Math proficiency
- 57% ▼ -6.00%
- Reading proficiency
- 57% ▼ -1.00%
- Median HH income
- $71,541
- Composite
- 50.65/100
- National rank
- #1833
- State rank
- #69 of 826 in TX
Livability — Cut and Shoot
- Score
- 56/100
- State rank
- #1326
- US rank
- #22835
Category grades
Schools grade is shown separately in the Schools card above.
Census & demographics
- County
- Montgomery County · 663,713 people
- Metro
- Houston-The Woodlands-Sugar Land, TX
- Population (ZIP)
- 28,854
- Household income
- $75,348
- Rent vs Own
- Severe rent burden
- 464.0
Population outlook (Montgomery County) Hauer SSP2
- Today (2025)
- 713,896 people
- By 2030
- 805,263 · +12.8%
- By 2040
- 992,708 · +39.1%
- By 2050
- 1,179,590 · +65.2%
- By 2075
- 1,628,084 · +128.1%
- By 2100
- 1,937,880 · +171.5%
Race, ethnicity, and origin ACS 2023
- Neighborhood character
- Diverse neighborhood (Simpson 0.56)
- Race & ethnicity
- White 54% Hispanic / Latino 38% Two or more races 17% Black 4%
- Hispanic origin (detail)
- Mexican 25%
- Common ancestry
- Lithuanian 1% Romanian 1% Slovak 1%
- Foreign-born
- 13% · Canada, Jamaica
- Languages at home
- 69% English-only · Spanish 31%
Political lean MEDSL · Montgomery
- 2024 margin
- Solid R (+45.5) · D 26.8% · R 72.3%
- 2008→2024 swing
- +7.2pp toward D · 2008: -52.7pp · 2024: -45.5pp
- All cycles
- 2024: R+45.5 2020: R+43.8 2016: R+51.4 2012: R+60.7 2008: R+52.7
Not yet ingested
- Civics
- —
Market trends
- HPI YoY
- ▼ -77.71%
- Current HPI
- 269.5367
- Rent YoY
- ▼ -0.31%
- Metro
- Houston-The Woodlands-Sugar Land, TX
- State GDP YoY
- ▲ 3.95%
- F500 in state
- 110
Industry mix (Fortune 500 HQ in TX)
| Industry | F500 HQs | Revenue |
|---|---|---|
| Energy | 16 | $1,198B |
|
||
| Technology | 5 | $198B |
|
||
| Engineering / Construction | 4 | $72B |
|
||
| Energy Services | 3 | $60B |
|
||
| Utilities | 3 | $41B |
|
||
| Healthcare | 2 | $330B |
|
||
Price history
-4.5% since first listed2 events — show timeline
- 2026-06-09 Price Changed $274,990 HARMLS
- 2026-06-09 Listed $288,040 HARMLS
Cash-flow waterfall
monthlySold comps — $/sqft
last 12 mo · ≤1 miLoading sold comps…