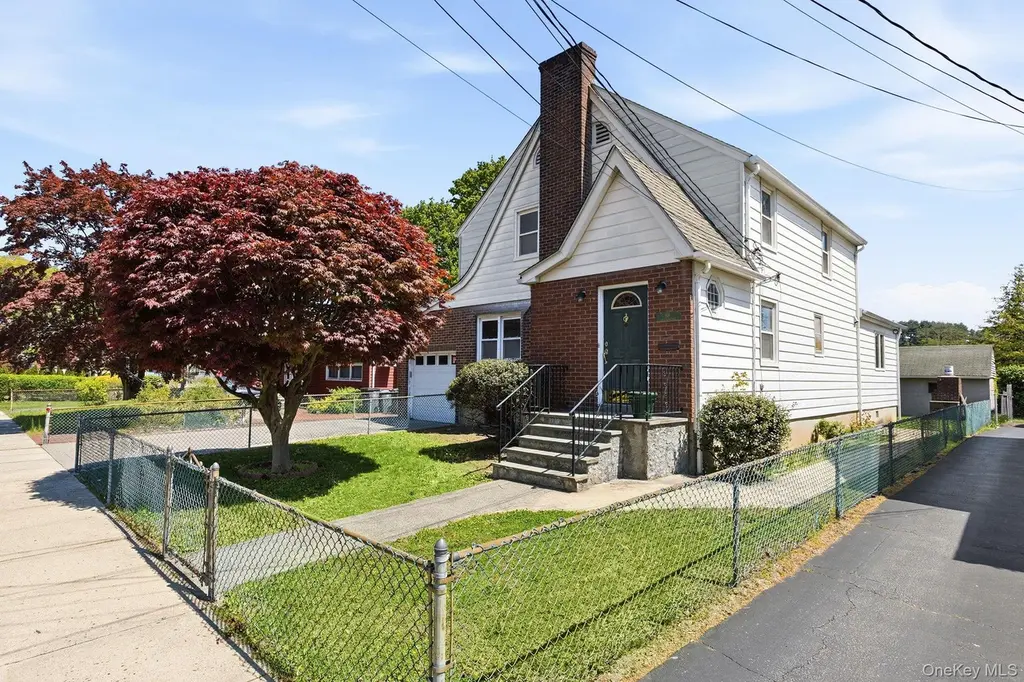
68 Seneca Ave · White Plains, NY
Flood risk 1/10 · Minimal
- FEMA flood zone
- X (unshaded)
- Chance of flooding over 30 yrs
- 0.0%
- Est. flood insurance / yr
- $473 – $860
Fire risk 3/10 · Minor
- Est. fire insurance / yr
- $691 – $1,283
Heat risk 6/10 · Moderate
- Hot days now (above 98°F)
- 7 days/yr
- Hot days in 30 yrs
- 15 days/yr
Wind risk 6/10 · Moderate
- Chance of severe wind over 30 yrs
- 27.0%
Air-quality risk 4/10 · Minor
- Unhealthy air days now
- 4 days/yr
- Unhealthy air days in 30 yrs
- 6 days/yr
Risk factors via First Street. Map © Google.
Why this score? — see what drove the D grade
The composite is a weighted blend of 9 inputs, each scored 0–100. Each bar is that input's sub-score; the figure is the points it added to the 100-point composite (weight × sub-score).
- ARV discount +15.0/15.0
- Cash flow +10.0/30.0
- Schools +4.7/10.0
- Livability +3.6/5.0
- DSCR +2.8/10.0
- Rent growth +2.5/5.0
- Condition / age +2.5/5.0
- 1% rule +1.6/10.0
- Appreciation +0.0/10.0
$725,000
🖨 Deal sheet (PDF) 📄 Offer letter ✓ Due diligence
Listing remarks
Charming Colonial offered for the first time in 61 years! This lovingly maintained 3-bedroom, 1.5-bath home features a classic and functional layout ideal for today’s lifestyle. The first floor includes a formal living room with wood-burning fireplace, dining room, kitchen, den, and a spacious great room with sliders to a large deck—perfect for entertaining or relaxing outdoors. The second level offers three well-proportioned bedrooms and a full bath. Unfinished lower level provides excellent potential for additional space including recreation room, home office, or gym. Well cared for throughout, this home presents a wonderful opportunity for the next owner to bring their own vi
Key facts
- Large deck
- Quiet street
- Short walk to train
Tags
Property features AI
Exterior
- Parking: Attached parking; Driveway; 1-car garage
- Utilities: Electric service by Con-Edison; Public sewer; Public trash collection
- Home design: Single family residence; Two levels
- Construction: Aluminum siding and brick exterior
- Exterior features: Back yard; Level lot; Near schools; Near shops; Not waterfront
Interior
- Kitchen: Dishwasher; Oven; Range; Refrigerator
- Bedrooms: Total rooms: 8
- Flooring: Carpet; Hardwood
- Bathrooms: 1 full bathroom; 1 half bathroom
- Heating & cooling: Hot water heating (natural gas); No central air
- Interior features: Ceiling fans; Entrance foyer; Formal dining room; Pull-down attic stairs; Full unfinished basement with storage space
- Laundry & utility: Laundry in basement
Neighborhood map
What this means for you Summary
Snapshot
- This is a 3-bed/1.0-bath single-family listed at $725k.
Deal economics
- At list price, monthly cash flow is $-438 ($-5k/yr) — negative.
- To cash-flow at today's rent, offer at most $648k (10.7% below list).
- To meet the 1% rule (rent ≥ 1% of price), the offer needs to be $480k (33.8% below list).
- Recommended offer: $480k (33.8% below list) — sets the bar for 1% rule.
- Cap rate 5.6% vs local median 4.3% in White Plains — meaningfully above typical; check what's discounted (condition, days-on-market, listing class) to confirm the premium yield is real.
Location & tenants
- Location reads 71/100 on livability (#410 in NY) — a middle-class / working-renter tenant base. Strengths: commute A+, employment A+, crime A-; Watch: amenities F, cost of living F.
- White Plains City School District (urban): math 49% / reading 54% proficiency, ranked #313 of 590 in NY (top 53%) — acceptable for families but not a draw, mixed tenant base, ~2y average lease.
- Zoned schools: White Plains Middle School (math 36% / reading 53%, grade D, #348 of 729 statewide, top 50%, 1,517 students, 50% FRL); White Plains Senior High School (math 89% / reading 67%, grade A-, #577 of 1,100 statewide, top 52%, 2,220 students, 53% FRL).
- Market conditions: 113 active listings in the ZIP; 16 comparable units currently listed for rent nearby; rentals at typical pace (median 16d on market — plan ~3-4 weeks tenant-placement turnaround); 954 units permitted in Westchester County in 2024 (649 in 5+ unit buildings).
Forward outlook
- Local home prices are declining (-3.0%/yr); year-one equity from $5k of loan paydown is wiped out by about $22k of value loss. Plan a longer hold.
- Westchester County population projected at +10% by 2050 — modest demand growth; plan on rents tracking national, not racing it.
Negotiation context
- It's been on market 46 days — a 3% lower offer ($703k) is reasonable based on typical stale-listing flexibility.
Risks & watch-outs
- Watch-outs: built in 1940 — expect roof / HVAC / electrical / plumbing capex.
- Climate carrying-cost: major wind risk, 27% chance of damaging wind over 30y; extreme-heat days projected 7→15/yr by 2055 (HVAC capex compounding) — expect insurance premiums to compound above CPI over the hold.
Questions for the listing agent
- What do current leases actually rent for vs. the listed asking? Can we see a recent rent roll and the last 12 months of T-12 income?
- It's been on market 46 days. Have you received any prior offers? Is the seller open to a 34% concession, seller financing, or rate buy-down credit?
- Built in 1940 — when were the roof, HVAC, electrical panel, plumbing, and water heater last replaced?
- Is there a deadline driving the sale (1031 exchange, divorce, estate, relocation)? That informs how much negotiation room exists.
- The area grade is low — what's the realistic commute time and amenity access for the typical tenant pool here? Any planned neighborhood developments (good or bad) we should know about?
- What's the average days-on-market for RENTAL listings here right now (not sales)? A rising rental-DOM trend means longer vacancies and softer asking-rent achievability than the comps imply.
- What's the recent tenant-quality profile in this submarket — average credit score on applications, eviction rate, late-payment / NSF rate, and stable-employment percentage? A property-management company in the area should have these aggregated.
- How much new for-sale + rental construction is in the pipeline within 1–3 miles? Heavy new supply typically softens prices + rents 12–24 months out; constrained supply supports both.
Investment metrics
- 1% rule
- 0.66% ✗
- Cap rate
- 5.57%
- Cash-on-cash
- -2.59%
- DSCR
- 0.88
- GRM
- 12.6
CMA / ARV
- ARV (median comp)
- $897,057
- List price
- $725,000
- Delta
- -19.18%
- Verdict
- UNDERPRICED
- Comps
- 20 within 1.0 mi
Show comp detail 12 sales within ~0.75 mi
| Address | Dist | Beds/Ba | Sqft | Sold | Price | $/sf | Match |
|---|---|---|---|---|---|---|---|
| 60 Cloverdale Ave | 0.06mi | 3/2.5 | 2,000 (+2%) | 1mo | $700,000 | $350 | 88 |
| 46 Mcdougal Dr | 0.39mi | 3/2.0 | 1,780 (-9%) | 1mo | $850,811 | $478 | 61 |
| 20 N Washington Ave | 0.35mi | 3/2.5 | 1,740 (-12%) | 0mo | $795,000 | $457 | 58 |
| 30 Maryton Rd | 0.61mi | 3/2.5 | 1,995 (+2%) | 8mo | $800,000 | $401 | 56 |
| 48 Archer Ave | 0.37mi | 3/2.5 | 2,109 (+7%) | 11mo | $920,500 | $436 | 55 |
| 16 Garretson Rd | 0.52mi | 3/1.5 | 1,819 (-7%) | 11mo | $710,000 | $390 | 52 |
| 9 Arborwood Ln | 0.48mi | 3/2.5 | 2,148 (+9%) | 8mo | $800,000 | $372 | 50 |
| 1 Westminster Dr | 0.57mi | 4/3.0 (+1) | 2,000 (+2%) | 11mo | $800,000 | $400 | 48 |
| 43 Garretson Rd | 0.58mi | 3/2.5 | 1,792 (-9%) | 10mo | $539,000 | $301 | 44 |
| 32 Custis Ave | 0.63mi | 3/3.0 | 1,810 (-8%) | 7mo | $865,000 | $478 | 44 |
| 27 Oliver Ave | 0.67mi | 4/2.5 (+1) | 2,200 (+12%) | 9mo | $1,240,000 | $564 | 31 |
| 81 Nethermont Ave | 0.64mi | 4/2.0 (+1) | 1,700 (-14%) | 11mo | $850,000 | $500 | 29 |
Match score weights: distance 35% · size 25% · config 20% · recency 20%. Top-matched comps best support the ARV.
Projected returns pro-forma
-3.0% appreciation · 3.0% rent growth · sell at horizon
- IRR
- -20.7%
- Equity multiple
- 0.28×
- Total profit
- $-145,784
- Equity at exit
- $108,100
- IRR
- -14.1%
- Equity multiple
- 0.19×
- Total profit
- $-164,522
- Equity at exit
- $62,685
Cash invested: $203,000 (down + closing). Projections, not guarantees.
Landlord ↔ Tenant lean methodology
- Overall (STATE)
- 15 Strongly Tenant-Friendly
- State New York
- 15 Strongly Tenant-Friendly · D+10
- County
- — inherits STATE
- City
- — inherits STATE
ZIP-level market 10603
- Home prices YoY
- -24.2%
- Active inventory
- 113
- Price-to-rent
- 12.6×
Monthly cashflow live
- Estimated rent
- $4,800 high interval (Pro) →
- Mortgage (P&I)
- −$3,802
- Tax from tax record
- −$126 /mo · $1,507/yr
- Insurance
- −$302
- HOA
- −$0
- Vacancy / Maint / Mgmt
- −$1,008
- Net cashflow
- $-438
Break-even live
Sensitivity live
| Price | -10% $-28 | -5% $-233 | +0% $-438 | +5% $-1,469 | +10% $-1,720 |
|---|---|---|---|---|---|
| Rent | -10% $-817 | -5% $-628 | +0% $-438 | +5% $-248 | +10% $-59 |
| Rate | -1.0pp $-73 | -0.5pp $-254 | base $-438 | +0.5pp $-626 | +1.0pp $-817 |
UW: 25.0% down · 7.5% · 30yr · 1.5% tax · 5.0% vac · 8.0% maint · 8.0% mgmt
Financing live
Cash to close
- Down payment
- $181,250
- Closing costs
- $21,750
- Reserves months
- —
- Total cash needed
- —
Loan-product check · same deal, 3 products live
Conventional
25% down · 7.5% · 30yr
- Down + closing
- —
- Monthly P&I
- —
- Monthly cashflow
- —
- DSCR
- —
- Eligible?
- —
Personal DTI + credit; lowest rate.
DSCR
20% down · 8.5% · 30yr
- Down + closing
- —
- Monthly P&I
- —
- Monthly cashflow
- —
- DSCR
- —
- Eligible?
- —
No personal income docs; deal must DSCR.
Hard money
10% down · 12.0% · 12mo
- Down + closing
- —
- Monthly P&I
- —
- Monthly cashflow
- —
- DSCR
- —
- Eligible?
- —
Short-term bridge; refi at stabilization.
Rent comps 16 comps
| Address | Beds | Baths | Sqft | Rent | $/sqft | DOM | Units | Dist |
|---|---|---|---|---|---|---|---|---|
| 5 Church St N White Plains, NY | 3.0 | 1.5 | 1238 | $4,500 | $3.63 | 16d | 1 | 0.19mi |
| 499 N Broadway Apt 2L White Plains, NY | 2.0 | 2.0 | 1250 | $3,400 | $2.72 | 44d | 1 | 0.26mi |
| 26 Montross St White Plains, NY | 3.0 | 1.0 | 1528 | $5,650 | $3.70 | 0d | 1 | 0.38mi |
| 45 Washington Ave White Plains, NY | 3.0 | 2.0 | 1319 | $5,500 | $4.17 | 7d | 1 | 0.49mi |
| 115 N Broadway White Plains, NY | 2.0 | 2.5 | 1450 | $3,750 | $2.59 | 44d | 1 | 0.74mi |
| 55 N Broadway Unit 3-15H White Plains, NY | 2.0 | 2.5 | 1310 | $3,850 | $2.94 | 44d | 1 | 1.05mi |
| 3 Terrace Ave White Plains, NY | 4.0 | 2.0 | 1820 | $5,500 | $3.02 | 7d | 1 | 1.08mi |
| 27 Barker Ave White Plains, NY | 2.0 | 1.0–2.0 | 1131 | $5,391 | $4.76 | 0d | 18 | 1.20mi |
| 440 Hamilton Ave White Plains, NY | 2.0 | 1.0–2.0 | 880 | $5,554 | $6.31 | 0d | 30 | 1.21mi |
| 28 Beechwood Ave West Harrison, NY | 3.0 | 1.0 | 1239 | $4,800 | $3.87 | 18d | 1 | 1.25mi |
| 5 Renaissance Sq Apt 21F White Plains, NY | 2.0 | 2.5 | 1534 | $6,850 | $4.47 | 18d | 1 | 1.35mi |
| 507 Main St E West Harrison, NY | 3.0 | 2.0 | 1800 | $5,000 | $2.78 | 8d | 1 | 1.40mi |
| 25 N Lexington Ave White Plains, NY | 3.0 | 1.0–2.0 | 988 | $7,972 | $8.07 | 0d | 26 | 1.41mi |
| 234 Martine Ave White Plains, NY | 3.0 | 2.0 | 1460 | $4,195 | $2.87 | 25d | 1 | 1.48mi |
| 240 Martine Ave Apt 4G White Plains, NY | 3.0 | 2.0 | 1460 | $4,195 | $2.87 | 44d | 1 | 1.49mi |
| 111 Park Ave West Harrison, NY | 3.0 | 3.5 | 2070 | $7,100 | $3.43 | 16d | 1 | 1.50mi |
Listing history 16 events
-
2026-06-21days on market $725,000 Active 46 DOM
-
2026-06-18days on market $725,000 Active 43 DOM
-
2026-06-17days on market $725,000 Active 42 DOM
-
2026-06-16days on market $725,000 Active 41 DOM
-
2026-06-15days on market $725,000 Active 40 DOM
-
2026-06-13days on market $725,000 Active 38 DOM
-
2026-06-13days on market $725,000 Active 37 DOM
-
2026-06-09days on market $725,000 Active 34 DOM
-
2026-06-08days on market $725,000 Active 33 DOM
-
2026-06-07days on market $725,000 Active 32 DOM
-
2026-06-04days on market $725,000 Active 29 DOM
-
2026-06-03days on market $725,000 Active 28 DOM
-
2026-06-02days on market $725,000 Active 27 DOM
-
2026-06-01days on market $725,000 Active 26 DOM
-
2026-05-31days on market $725,000 Active 25 DOM
-
2026-05-06$725,000 Active 1060-char remark
ⓘ Source: listings_history table (triggers on properties + properties_extension) + one-shot
backfill from property_details.listing_events for pre-trigger history.
Tax reassessment forecast NY · Partial reset (capped growth)
- Current annual tax
- $1,507 · $126/mo
- Projected year-2 tax
- $6,880 · $573/mo
- Expected delta
- +$5,373/yr (+$448/mo · 356.5%)
ⓘ Screening estimate from a state-policy table — verify with the county assessor before closing.
Climate risk First Street
- Flood 1/10 Low FEMA zone X (unshaded) · 0% chance over 30 yrs
- Wildfire 3/10 Moderate
- Heat 6/10 Major 7 d/yr ≥98°F today · 15 d/yr by 30 yrs out
- Wind 6/10 Major 27% chance of damaging wind over 30 yrs
- Air quality 4/10 Moderate 4 unhealthy d/yr today · 6 by 30 yrs out
Nearby sold comps map
Loading sold comps map…
Walkable amenities ~0.75 mi
Loading nearby amenities…
Taxation est. · year 1
- Rental income
- $57,595
- − Mortgage interest
- −$40,611
- − Property taxes
- −$1,507
- − Insurance
- −$3,625
- − Repairs & maintenance
- −$4,608
- − Management
- −$4,608
- − Depreciation
- −$21,091
- Taxable loss
- −$18,455
- Est. tax savings @ 24.0%
- +$4,429
- After-tax cash flow
- $-827/yr
For passive investors: Depreciation is non-cash, so a rental often shows a tax loss while cash-flowing — sheltering income. Rental losses are passive: they offset passive income freely, and up to $25,000/yr can offset ordinary (W-2) income if you actively participate and your MAGI is under $100k (phasing out to $0 by $150k); unused losses carry forward. On sale, claimed depreciation is recaptured at up to 25%, and gains may owe capital-gains tax (a 1031 exchange can defer both). Figures are a year-1 estimate at your 24.0% rate — not tax advice; consult a CPA.
Schools (NCES district)
- District
- White Plains City School District
- NCES district ID
- 3631260
- Math proficiency
- 49% ▼ -6.00%
- Reading proficiency
- 54% ▲ 2.00%
- Median HH income
- $78,366
- Composite
- 46.72/100
- National rank
- #2397
- State rank
- #313 of 590 in NY
Livability — White Plains
- Score
- 71/100
- State rank
- #410
- US rank
- #6801
Category grades
Schools grade is shown separately in the Schools card above.
Census & demographics
- Census place
- White Plains, NY
- City population
- 61,281
- Population (ZIP)
- 19,201
Population outlook (Westchester County) Hauer SSP2
- Today (2025)
- 1,028,035 people
- By 2030
- 1,051,636 · +2.3%
- By 2040
- 1,098,520 · +6.9%
- By 2050
- 1,136,044 · +10.5%
- By 2075
- 1,196,925 · +16.4%
- By 2100
- 1,175,147 · +14.3%
Race, ethnicity, and origin ACS 2023
- Neighborhood character
- Highly diverse neighborhood (Simpson 0.71)
- Race & ethnicity
- Hispanic / Latino 35% White 34% Black 21% Two or more races 13% Asian 5%
- Hispanic origin (detail)
- Mexican 4% Puerto Rican 7% Dominican 3%
- Common ancestry
- Hispanic 3% Romanian 2% Lithuanian 1%
- Foreign-born
- 33% · Canada, Jamaica, China
- Languages at home
- 55% English-only · Spanish 31% Other Indo-European 8% French/Haitian/Cajun 2%
Political lean MEDSL · Westchester
- 2024 margin
- Strong D (+26.3) · D 63.1% · R 36.9%
- 2008→2024 swing
- -1.3pp toward R · 2008: 27.6pp · 2024: 26.3pp
- All cycles
- 2024: D+26.3 2020: D+36.3 2016: D+32.8 2012: D+22.2 2008: D+27.6
Not yet ingested
- Civics
- —
Market trends
- HPI YoY
- ▼ -101.72%
- Current HPI
- 317.8177
- Rent YoY
- —
- Metro
- —
- State GDP YoY
- ▲ 2.60%
- F500 in state
- 92
Industry mix (Fortune 500 HQ in NY)
| Industry | F500 HQs | Revenue |
|---|---|---|
| Financial Services | 10 | $950B |
|
||
| Consumer Goods | 9 | $162B |
|
||
| Insurance | 4 | $225B |
|
||
| Telecommunications | 2 | $144B |
|
||
| Pharmaceuticals | 2 | $112B |
|
||
| Media / Entertainment | 2 | $69B |
|
||
Price history
1 event — show timeline
- 2026-05-06 Listed $725,000 OneKey® MLS as Distributed by MLS Grid
Property tax history
-24.9%/yrLatest (2025): $1,507 · +1.0% YoY. Source: county tax records.
Cash-flow waterfall
monthlySold comps — $/sqft
last 12 mo · ≤1 miLoading sold comps…