4 Woodland Ave · Florence, KY
Flood risk 1/10 · Minimal
- FEMA flood zone
- X (unshaded)
- Chance of flooding over 30 yrs
- 0.0%
- Est. flood insurance / yr
- $507 – $1,088
Fire risk 1/10 · Minimal
- Est. fire insurance / yr
- $839 – $1,559
Heat risk 4/10 · Minor
- Hot days now (above 101°F)
- 7 days/yr
- Hot days in 30 yrs
- 19 days/yr
Wind risk 2/10 · Minimal
- Chance of severe wind over 30 yrs
- 2.0%
Air-quality risk 2/10 · Minimal
- Unhealthy air days now
- 1 days/yr
- Unhealthy air days in 30 yrs
- 3 days/yr
Risk factors via First Street. Map © Google.
Why this score? — see what drove the D+ grade
The composite is a weighted blend of 9 inputs, each scored 0–100. Each bar is that input's sub-score; the figure is the points it added to the 100-point composite (weight × sub-score).
- Cash flow +14.2/30.0
- ARV discount +13.1/15.0
- DSCR +4.3/10.0
- Schools +4.1/10.0
- Livability +3.9/5.0
- Rent growth +3.4/5.0
- 1% rule +2.9/10.0
- Condition / age +2.5/5.0
- Appreciation +0.0/10.0
$190,000
🖨 Deal sheet (PDF) 📄 Offer letter ✓ Due diligence
Listing remarks MLS
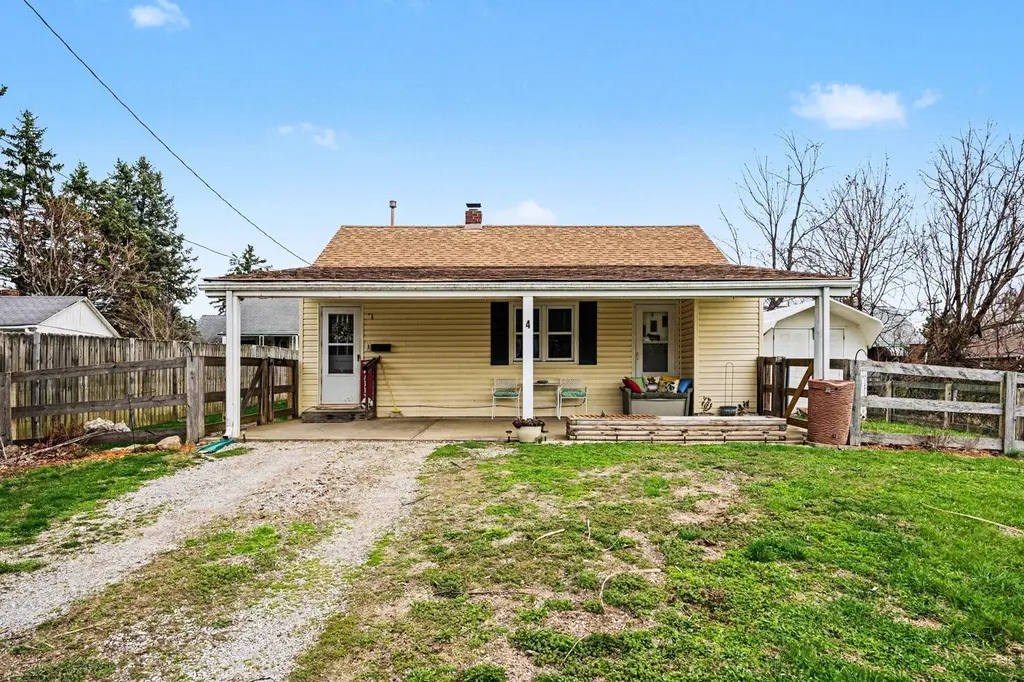
Your search stops here! This lovely well maintained ranch home offers a newer roof, vinyl siding*replacement Gilkey windows*refinished wood flooring*freshly painted*spacious storage shed*covered front porch*study could be used as a 3rd bedroom*flat yard and convenience to everything. All the appliances included and a 1 year warranty. Close to the bus line! Move in condition!
Key facts
- Wood flooring
- Covered front porch
- Flexible study
Tags
Neighborhood map
What this means for you Summary
Snapshot
- This is a 2-bed/1.0-bath single-family listed at $190k.
Deal economics
- At list price, monthly cash flow is $32 ($383/yr) — positive.
- The deal already cash-flows at list — no discount required.
- To meet the 1% rule (rent ≥ 1% of price), the offer needs to be $149k (21.4% below list).
- Recommended offer: $149k (21.4% below list) — sets the bar for 1% rule.
- Cap rate 6.5% vs local median 3.4% in Florence — top-decile yield for the area; either an underpriced asset or a hidden risk that comps aren't pricing in. Stress-test before assuming the spread holds.
Location & tenants
- Location reads 78/100 on livability (#82 in KY, #2,763 nationally) — a middle-class / working-renter tenant base. Strengths: commute A+, cost of living A+, housing A+; Watch: crime C-.
- Boone County (suburban): math 43% / reading 49% proficiency, ranked #12 of 165 in KY (top 7%) — families likely to look elsewhere, expect single-tenant / working-renter base with shorter leases.
- Zoned schools: Hillard Collins Elementary School (math 22% / reading 25%, grade F, #515 of 676 statewide, top 77%, 483 students, 65% FRL); Rector A. Jones Middle School (math 11% / reading 29%, grade F, #206 of 217 statewide, top 95%, 679 students, 74% FRL); Boone County High School (math 21% / reading 32%, grade F, #174 of 254 statewide, top 69%, 1,279 students, 53% FRL) — zoned schools average 64% FRL vs 30% district-wide (35 pts higher); higher-poverty schools than district average — tighter screening recommended.
- Zoned-school proficiency averages 23% at this address vs 46% district-wide (-23 pts) — the specific schools serving this property underperform the Boone County average; the district grade overstates school quality for this exact location.
- Market conditions: Rents rising (+3.4%/yr); 271 active listings in the ZIP; 7 comparable units currently listed for rent nearby; rentals leasing fast (median 0d on market — plan ~1-2 weeks tenant-placement turnaround); solid renter incomes; 1,430 units permitted in Boone County in 2024 (928 in 5+ unit buildings).
Forward outlook
- Local home prices are declining (-3.0%/yr); year-one equity from $1k of loan paydown is wiped out by about $6k of value loss. Plan a longer hold.
- Boone County population projected at +24% by 2050 — long-run rental-demand tailwind backs the buy-and-hold thesis.
Negotiation context
- Only 4 days on market — expect competitive offers; lowballing is unlikely to land.
- 4 sale attempts since 25y ago with the ask held roughly flat each time — persistent listings suggest the price (not the market) is what's stuck; bring a comps-based counter.
- Current owner paid $85k; list at $190k implies a 124% gain — meaningful room to come down on a strong offer.
Risks & watch-outs
- Watch-outs: built in 1955 — expect roof / HVAC / electrical / plumbing capex.
Questions for the listing agent
- Built in 1955 — when were the roof, HVAC, electrical panel, plumbing, and water heater last replaced?
- Is there a deadline driving the sale (1031 exchange, divorce, estate, relocation)? That informs how much negotiation room exists.
- Schools are D-rated, which usually means shorter tenancies and higher turnover. Who's the typical renter profile here, and what's been the actual vacancy rate?
- The area grade is low — what's the realistic commute time and amenity access for the typical tenant pool here? Any planned neighborhood developments (good or bad) we should know about?
- What's the average days-on-market for RENTAL listings here right now (not sales)? A rising rental-DOM trend means longer vacancies and softer asking-rent achievability than the comps imply.
- What's the recent tenant-quality profile in this submarket — average credit score on applications, eviction rate, late-payment / NSF rate, and stable-employment percentage? A property-management company in the area should have these aggregated.
- How much new for-sale + rental construction is in the pipeline within 1–3 miles? Heavy new supply typically softens prices + rents 12–24 months out; constrained supply supports both.
Investment metrics
- 1% rule
- 0.79% ✗
- Cap rate
- 6.49%
- Cash-on-cash
- 0.72%
- DSCR
- 1.03
- GRM
- 10.6
CMA / ARV
- ARV (on-the-fly)
- $217,224
- Comps found
- 10
Show comp detail 10 sales within ~0.75 mi
| Address | Dist | Beds/Ba | Sqft | Sold | Price | $/sf | Match |
|---|---|---|---|---|---|---|---|
| 26 Grand Ave | 0.12mi | 2/1.0 | 957 (+11%) | 11mo | $175,000 | $183 | 67 |
| 110 Valley Dr | 0.37mi | 2/1.0 | 780 (-10%) | 1mo | $210,000 | $269 | 66 |
| 26 Lee St | 0.43mi | 3/1.5 (+1) | 872 (+1%) | 16mo | $245,000 | $281 | 57 |
| 7729 Hollywood Dr | 0.12mi | 3/1.0 (+1) | 944 (+10%) | 23mo | $250,000 | $265 | 55 |
| 3 Circle Dr | 0.49mi | 3/1.0 (+1) | 864 (+0%) | 22mo | $210,000 | $243 | 54 |
| 11 Bell St | 0.44mi | 2/1.0 | 899 (+4%) | 23mo | $200,000 | $222 | 53 |
| 25 Lake Dr | 0.31mi | 3/1.5 (+1) | 972 (+13%) | 8mo | $245,000 | $252 | 51 |
| 10 Utz Dr | 0.69mi | 2/1.0 | 910 (+6%) | 12mo | $235,000 | $258 | 48 |
| 36 Miriam Dr | 0.51mi | 3/1.0 (+1) | 950 (+10%) | 12mo | $209,000 | $220 | 44 |
| 138 Roger Ln | 0.53mi | 3/2.0 (+1) | 952 (+10%) | 7mo | $239,900 | $252 | 43 |
Match score weights: distance 35% · size 25% · config 20% · recency 20%. Top-matched comps best support the ARV.
Projected returns pro-forma
-3.0% appreciation · 3.42% rent growth · sell at horizon
- IRR
- -14.8%
- Equity multiple
- 0.47×
- Total profit
- $-28,201
- Equity at exit
- $28,330
- IRR
- -5.6%
- Equity multiple
- 0.63×
- Total profit
- $-19,638
- Equity at exit
- $16,428
Cash invested: $53,200 (down + closing). Projections, not guarantees.
Landlord ↔ Tenant lean methodology
- Overall (STATE)
- 83 Strongly Landlord-Friendly
- State Kentucky
- 83 Strongly Landlord-Friendly · R+16
- County
- — inherits STATE
- City
- — inherits STATE
ZIP-level market 41042
- Rents YoY
- 3.4%
- Active inventory
- 271
- Price-to-rent
- 10.6×
Monthly cashflow live
- Estimated rent
- $1,493 high interval (Pro) →
- Mortgage (P&I)
- −$996
- Tax from tax record
- −$72 /mo · $864/yr
- Insurance
- −$79
- HOA
- −$0
- Vacancy / Maint / Mgmt
- −$314
- Net cashflow
- $32
Break-even live
Sensitivity live
| Price | -10% $139 | -5% $86 | +0% $32 | +5% $-22 | +10% $-76 |
|---|---|---|---|---|---|
| Rent | -10% $-86 | -5% $-27 | +0% $32 | +5% $91 | +10% $150 |
| Rate | -1.0pp $128 | -0.5pp $80 | base $32 | +0.5pp $-17 | +1.0pp $-67 |
UW: 25.0% down · 7.5% · 30yr · 1.5% tax · 5.0% vac · 8.0% maint · 8.0% mgmt
Financing live
Cash to close
- Down payment
- $47,500
- Closing costs
- $5,700
- Reserves months
- —
- Total cash needed
- —
Loan-product check · same deal, 3 products live
Conventional
25% down · 7.5% · 30yr
- Down + closing
- —
- Monthly P&I
- —
- Monthly cashflow
- —
- DSCR
- —
- Eligible?
- —
Personal DTI + credit; lowest rate.
DSCR
20% down · 8.5% · 30yr
- Down + closing
- —
- Monthly P&I
- —
- Monthly cashflow
- —
- DSCR
- —
- Eligible?
- —
No personal income docs; deal must DSCR.
Hard money
10% down · 12.0% · 12mo
- Down + closing
- —
- Monthly P&I
- —
- Monthly cashflow
- —
- DSCR
- —
- Eligible?
- —
Short-term bridge; refi at stabilization.
Rent comps 7 comps
| Address | Beds | Baths | Sqft | Rent | $/sqft | DOM | Units | Dist |
|---|---|---|---|---|---|---|---|---|
| 7650 Ewing Blvd Florence, KY | 1.0–2.0 | 1.0–2.0 | 915 | $1,465 | $1.60 | 0d | 8 | 0.21mi |
| 7536 Hillcrest Dr Florence, KY | 1.0–3.0 | 1.0–2.0 | 933 | $1,484 | $1.59 | 0d | 16 | 0.31mi |
| 6827 Shenandoah Dr Florence, KY | 1.0 | 1.0 | 750 | $988 | $1.32 | 4d | 5 | 0.87mi |
| 101 Pinehurst Dr Florence, KY | 1.0–2.0 | 1.0 | 815 | $1,399 | $1.72 | 25d | 6 | 0.91mi |
| 8000 Preakness Dr Florence, KY | 1.0–3.0 | 1.0–2.0 | 1110 | $1,642 | $1.48 | 0d | 30 | 1.06mi |
| 6805 Sebree Dr Florence, KY | 1.0–3.0 | 1.0–1.5 | 901 | $1,392 | $1.55 | 0d | 14 | 1.14mi |
| 6700 Hopeful Rd Florence, KY | 1.0–3.0 | 1.5–2.5 | 1165 | $1,880 | $1.61 | 0d | 16 | 1.41mi |
Listing history 11 events
-
2026-03-28status Pending
-
2026-03-24$190,000 Active
-
2017-12-27soldstatus $85,000
-
2017-12-15soldstatus $85,500 377-char remark
Show marketing remark (377 chars)
Your search stops here! This lovely well maintained ranch home offers a newer roof, vinyl siding*replacement Gilkey windows*refinished wood flooring*freshly painted*spacious storage shed*covered front porch*study could be used as a 3rd bedroom*flat yard and convenience to everything. All the appliances included and a 1 year warranty. Close to the bus line! Move in condition!
-
2017-10-31$89,900 377-char remark
Show marketing remark (377 chars)
Your search stops here! This lovely well maintained ranch home offers a newer roof, vinyl siding*replacement Gilkey windows*refinished wood flooring*freshly painted*spacious storage shed*covered front porch*study could be used as a 3rd bedroom*flat yard and convenience to everything. All the appliances included and a 1 year warranty. Close to the bus line! Move in condition!
-
2017-10-12soldstatus $50,000
-
2017-09-27soldstatus $50,000 22-char remark
Show marketing remark (22 chars)
PENDING WHEN SUBMITTED
-
2017-09-08$50,000 22-char remark
Show marketing remark (22 chars)
PENDING WHEN SUBMITTED
-
2003-11-10soldstatus $52,000
-
2002-04-03historical
-
2001-10-03$81,000
ⓘ Source: listings_history table (triggers on properties + properties_extension) + one-shot
backfill from property_details.listing_events for pre-trigger history.
Tax reassessment forecast KY · Resets to sale price
- Current annual tax
- $864 · $72/mo
- Projected year-2 tax
- $1,634 · $136/mo
- Expected delta
- +$770/yr (+$64/mo · 89.2%)
ⓘ Screening estimate from a state-policy table — verify with the county assessor before closing.
Climate risk First Street
- Flood 1/10 Low FEMA zone X (unshaded) · 0% chance over 30 yrs
- Wildfire 1/10 Low
- Heat 4/10 Moderate 7 d/yr ≥101°F today · 19 d/yr by 30 yrs out
- Wind 2/10 Low 2% chance of damaging wind over 30 yrs
- Air quality 2/10 Low 1 unhealthy d/yr today · 3 by 30 yrs out
Nearby sold comps map
Loading sold comps map…
Walkable amenities ~0.75 mi
Loading nearby amenities…
Taxation est. · year 1
- Rental income
- $17,916
- − Mortgage interest
- −$10,643
- − Property taxes
- −$864
- − Insurance
- −$950
- − Repairs & maintenance
- −$1,433
- − Management
- −$1,433
- − Depreciation
- −$5,527
- Taxable loss
- −$2,935
- Est. tax savings @ 24.0%
- +$704
- After-tax cash flow
- $1,087/yr
For passive investors: Depreciation is non-cash, so a rental often shows a tax loss while cash-flowing — sheltering income. Rental losses are passive: they offset passive income freely, and up to $25,000/yr can offset ordinary (W-2) income if you actively participate and your MAGI is under $100k (phasing out to $0 by $150k); unused losses carry forward. On sale, claimed depreciation is recaptured at up to 25%, and gains may owe capital-gains tax (a 1031 exchange can defer both). Figures are a year-1 estimate at your 24.0% rate — not tax advice; consult a CPA.
Schools (NCES district)
- District
- Boone County
- NCES district ID
- 2100510
- Math proficiency
- 43% ▼ -10.00%
- Reading proficiency
- 49% ▼ -12.00%
- Median HH income
- $68,096
- Composite
- 41.18/100
- National rank
- #3550
- State rank
- #12 of 165 in KY
Livability — Florence
- Score
- 78/100
- State rank
- #82
- US rank
- #2763
Category grades
Schools grade is shown separately in the Schools card above.
Census & demographics
- Census place
- Florence, KY
- County
- Boone County · 99,563 people
- City population
- 57,634
- Metro
- Cincinnati, OH-KY-IN
- Population (ZIP)
- 57,634
- Household income
- $79,712
- Rent vs Own
- Severe rent burden
- 1397.0
Population outlook (Boone County) Hauer SSP2
- Today (2025)
- 144,066 people
- By 2030
- 152,005 · +5.5%
- By 2040
- 166,776 · +15.8%
- By 2050
- 178,974 · +24.2%
- By 2075
- 204,515 · +42.0%
- By 2100
- 215,306 · +49.4%
Race, ethnicity, and origin ACS 2023
- Neighborhood character
- Predominantly White (78%)
- Race & ethnicity
- White 78% Hispanic / Latino 8% Black 7% Two or more races 7% Asian 3%
- Hispanic origin (detail)
- Mexican 5%
- Common ancestry
- Romanian 3% Slovak 2% Iranian 2%
- Foreign-born
- 9% · Canada, Vietnam
- Languages at home
- 89% English-only · Spanish 5% French/Haitian/Cajun 2% Other Indo-European 2%
Political lean MEDSL · Boone
- 2024 margin
- Solid R (+37.2) · D 30.6% · R 67.8% · Other 1.7%
- 2008→2024 swing
- -2.7pp toward R · 2008: -34.5pp · 2024: -37.2pp
- All cycles
- 2024: R+37.2 2020: R+35.7 2016: R+41.8 2012: R+38.7 2008: R+34.5
Not yet ingested
- Civics
- —
Market trends
- HPI YoY
- ▼ -195.07%
- Current HPI
- 206.3259
- Rent YoY
- ▲ 3.42%
- Metro
- Cincinnati, OH-KY-IN
- State GDP YoY
- ▲ 1.81%
- F500 in state
- 4
Industry mix (Fortune 500 HQ in KY)
| Industry | F500 HQs | Revenue |
|---|---|---|
| Healthcare | 1 | $118B |
|
||
| Food / Beverage | 1 | $7B |
|
||
Price history
+134.6% since first listed11 events — show timeline
- 2026-03-28 Pending — NKMLS
- 2026-03-24 Listed $190,000 NKMLS
- 2017-12-27 Sold (Public Records) $85,000 Public Records
- 2017-12-15 Sold (MLS) $85,500 NKMLS
- 2017-10-31 Listed $89,900 NKMLS
- 2017-10-12 Sold (Public Records) $50,000 Public Records
- 2017-09-27 Sold (MLS) $50,000 NKMLS
- 2017-09-08 Listed $50,000 NKMLS
- 2003-11-10 Sold (Public Records) $52,000 Public Records
- 2002-04-03 Listing Removed — NKMLS
- 2001-10-03 Listed $81,000 NKMLS
Property tax history
+1.7%/yrLatest (2025): $864 · +1.9% YoY. Source: county tax records.
Cash-flow waterfall
monthlySold comps — $/sqft
last 12 mo · ≤1 miLoading sold comps…