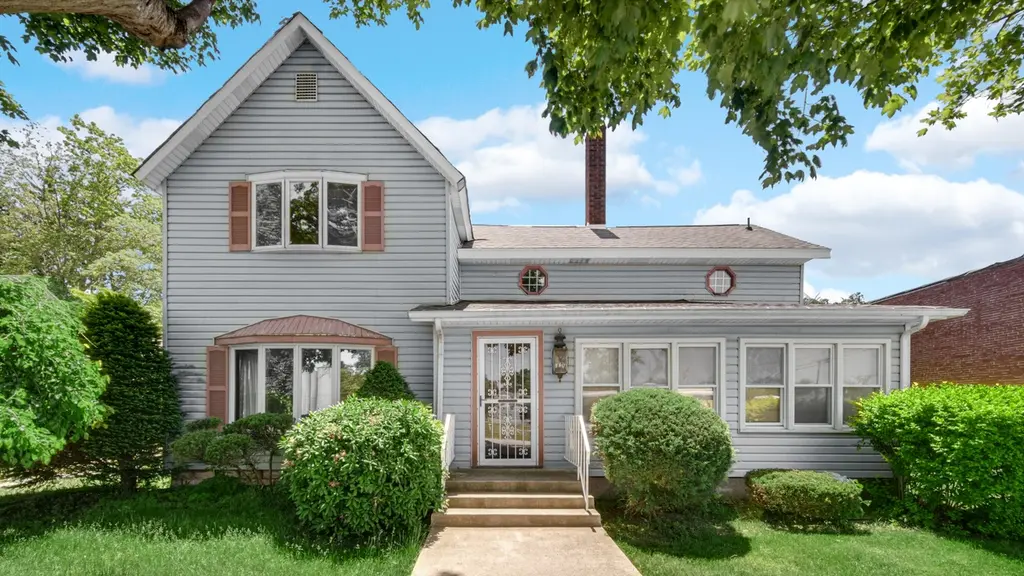
8 E Moore St · Hanna, IN
Flood risk 1/10 · Minimal
- FEMA flood zone
- X (unshaded)
- Chance of flooding over 30 yrs
- 0.0%
- Est. flood insurance / yr
- $473 – $860
Fire risk 1/10 · Minimal
- Est. fire insurance / yr
- $717 – $1,331
Heat risk 2/10 · Minimal
- Hot days now (above 100°F)
- 7 days/yr
- Hot days in 30 yrs
- 16 days/yr
Wind risk 2/10 · Minimal
- Chance of severe wind over 30 yrs
- —
Air-quality risk 1/10 · Minimal
- Unhealthy air days now
- 0 days/yr
- Unhealthy air days in 30 yrs
- 0 days/yr
Risk factors via First Street. Map © Google.
Why this score? — see what drove the C- grade
The composite is a weighted blend of 9 inputs, each scored 0–100. Each bar is that input's sub-score; the figure is the points it added to the 100-point composite (weight × sub-score).
- Cash flow +15.9/30.0
- Appreciation +10.0/10.0
- ARV discount +9.3/15.0
- DSCR +4.9/10.0
- Schools +3.8/10.0
- 1% rule +3.1/10.0
- Livability +2.6/5.0
- Rent growth +2.5/5.0
- Condition / age +2.5/5.0
$239,900
🖨 Deal sheet 📄 Offer letter ✓ Due diligence
Listing remarks
Charming and well-maintained 1.5-story home offering 3 bedrooms and 1.5 baths, blending classic character with thoughtful updates. This inviting property features new carpet, an updated kitchen with modern touches, and a refreshed main bath for added comfort and style. With its functional layout and evident pride of ownership, this home is move-in ready and perfect for everyday living. Nestled in a quaint town and conveniently located close to a park and restaurants.
Key facts
- Move-in ready
- Refreshed main bath
- Close to restaurants
Tags
Property features AI
Finance
- Other: Occupant status: Vacant
Exterior
- Parking: Off-street parking; On-street parking
- Security: Carbon monoxide detector(s); Smoke detector(s)
- Utilities: Electricity connected with 200+ amp service; Natural gas connected; Well water; Septic tank sewer
- Home design: One and one-half stories; Built in 1895; Vinyl siding exterior; Asphalt shingle roof
- Construction: Vinyl siding construction; Asphalt/shingle roof; Interior-entry unfinished basement with storage space
- Exterior features: Covered, enclosed front porch; Patio/porch features; Display windows; Insulated windows; Neighborhood and rural views; Carbon monoxide and smoke detectors
Interior
- Kitchen: Refrigerator; Gas range; Range hood; Dishwasher
- Bedrooms: Primary bedroom; Two additional bedrooms
- Flooring: Hardwood; Tile; Carpet
- Bathrooms: 1 full bathroom; 1 half bathroom
- Heating & cooling: Forced air heating (natural gas); Central air conditioning; Ceiling fans
- Interior features: Ceiling fans; Laminate countertops; High ceilings; Eat-in kitchen; Bonus room; Living room; Dining room; Other flexible living space
- Laundry & utility: Washer hookup (main level); Gas dryer hookup; Washer and dryer included; Gas water heater
Neighborhood map
What this means for you Summary
Snapshot
- This is a 3-bed/1.5-bath single-family listed at $240k.
Deal economics
- At list price, monthly cash flow is $116 ($1k/yr) — positive.
- The deal already cash-flows at list — no discount required.
- To meet the 1% rule (rent ≥ 1% of price), the offer needs to be $195k (18.6% below list).
- Recommended offer: $195k (18.6% below list) — sets the bar for 1% rule.
Location & tenants
- Location reads 52/100 on livability (#650 in IN) — a working-class tenant base; expect higher turnover. Strengths: cost of living A+, crime A; Watch: schools D+, amenities F, commute F.
- South Central Community School Corporation (rural): math 39% / reading 45% proficiency, ranked #101 of 301 in IN (top 34%) — families likely to look elsewhere, expect single-tenant / working-renter base with shorter leases.
- Market conditions: 8 active listings in the ZIP; 216 units permitted in LaPorte County in 2024 (75 in 5+ unit buildings).
Forward outlook
- In year one you build about $26k of equity ($2k loan paydown + $24k appreciation (10.0% local appreciation)).
- LaPorte County population projected to shrink 7% by 2050 — rents likely to lag national; underwrite the cash flow, not the appreciation.
- At projected returns (10.0% appreciation + 3.0% rent growth), your $67k cash investment doubles in ~3 years — after that, you're playing with house money.
- By year 2, paydown + projected appreciation supports a ~$41k cash-out refi (75% LTV) — recoverable capital for the next deal without selling this one.
Negotiation context
- Only 8 days on market — expect competitive offers; lowballing is unlikely to land.
Risks & watch-outs
- Watch-outs: built in 1895 — expect roof / HVAC / electrical / plumbing capex.
Questions for the listing agent
- Built in 1895 — when were the roof, HVAC, electrical panel, plumbing, and water heater last replaced?
- Is there a deadline driving the sale (1031 exchange, divorce, estate, relocation)? That informs how much negotiation room exists.
- Schools are D-rated, which usually means shorter tenancies and higher turnover. Who's the typical renter profile here, and what's been the actual vacancy rate?
- What's the average days-on-market for RENTAL listings here right now (not sales)? A rising rental-DOM trend means longer vacancies and softer asking-rent achievability than the comps imply.
- What's the recent tenant-quality profile in this submarket — average credit score on applications, eviction rate, late-payment / NSF rate, and stable-employment percentage? A property-management company in the area should have these aggregated.
- How much new for-sale + rental construction is in the pipeline within 1–3 miles? Heavy new supply typically softens prices + rents 12–24 months out; constrained supply supports both.
Investment metrics
- 1% rule
- 0.81% ✗
- Cap rate
- 6.87%
- Cash-on-cash
- 2.06%
- DSCR
- 1.09
- GRM
- 10.2
CMA / ARV
- ARV (on-the-fly)
- $249,920
- Comps found
- 3
Show comp detail 3 sales within ~0.75 mi
| Address | Dist | Beds/Ba | Sqft | Sold | Price | $/sf | Match |
|---|---|---|---|---|---|---|---|
| 306 E Wheeler St | 0.23mi | 3/1.0 | 1,620 (-8%) | 11mo | $230,000 | $142 | 65 |
| 111 E Young St | 0.28mi | 3/1.0 | 1,550 (-12%) | 3mo | $315,000 | $203 | 63 |
| 102 E Hopper St | 0.13mi | 3/2.0 | 1,596 (-9%) | 24mo | $217,000 | $136 | 57 |
Match score weights: distance 35% · size 25% · config 20% · recency 20%. Top-matched comps best support the ARV.
Projected returns pro-forma
10.0% appreciation · 3.0% rent growth · sell at horizon
- IRR
- 25.7%
- Equity multiple
- 3.05×
- Total profit
- $137,902
- Equity at exit
- $216,121
- IRR
- 22.6%
- Equity multiple
- 6.96×
- Total profit
- $400,088
- Equity at exit
- $466,073
Cash invested: $67,172 (down + closing). Projections, not guarantees.
Landlord ↔ Tenant lean methodology
- Overall (STATE)
- 90 Strongly Landlord-Friendly
- State Indiana
- 90 Strongly Landlord-Friendly · R+11
- County
- — inherits STATE
- City
- — inherits STATE
ZIP-level market 46340
- Home prices YoY
- 8.7%
- Active inventory
- 8
- Price-to-rent
- 10.2×
Monthly cashflow live
- Estimated rent
- $1,953 medium interval (Pro) →
- Mortgage (P&I)
- −$1,258
- Tax from tax record
- −$69 /mo · $829/yr
- Insurance
- −$100
- HOA
- −$0
- Vacancy / Maint / Mgmt
- −$410
- Net cashflow
- $116
Break-even live
UW: 25.0% down · 7.5% · 30yr · 1.5% tax · 5.0% vac · 8.0% maint · 8.0% mgmt
Financing live
Cash to close
- Down payment
- $59,975
- Closing costs
- $7,197
- Reserves months
- —
- Total cash needed
- —
Loan-product check · same deal, 3 products live
Conventional
25% down · 7.5% · 30yr
- Down + closing
- —
- Monthly P&I
- —
- Monthly cashflow
- —
- DSCR
- —
- Eligible?
- —
Personal DTI + credit; lowest rate.
DSCR
20% down · 8.5% · 30yr
- Down + closing
- —
- Monthly P&I
- —
- Monthly cashflow
- —
- DSCR
- —
- Eligible?
- —
No personal income docs; deal must DSCR.
Hard money
10% down · 12.0% · 12mo
- Down + closing
- —
- Monthly P&I
- —
- Monthly cashflow
- —
- DSCR
- —
- Eligible?
- —
Short-term bridge; refi at stabilization.
Listing history 8 events
-
2026-06-19pricedays on market $239,900 Active 8 DOM
-
2026-06-18days on market $249,000 Active 7 DOM
-
2026-06-17days on market $249,000 Active 6 DOM
-
2026-06-16days on market $249,000 Active 5 DOM
-
2026-06-15days on market $249,000 Active 4 DOM
-
2026-06-14days on market $249,000 Active 2 DOM
-
2026-06-13remarks 471-char remark
-
2026-06-13$249,000 Active 1 DOM
ⓘ Source: listings_history table (triggers on properties + properties_extension) + one-shot
backfill from property_details.listing_events for pre-trigger history.
Tax reassessment forecast IN · Partial reset (capped growth)
- Current annual tax
- $829 · $69/mo
- Projected year-2 tax
- $1,434 · $119/mo
- Expected delta
- +$605/yr (+$50/mo · 73.0%)
ⓘ Screening estimate from a state-policy table — verify with the county assessor before closing.
Climate risk First Street
- Flood 1/10 Low FEMA zone X (unshaded) · 0% chance over 30 yrs
- Wildfire 1/10 Low
- Heat 2/10 Low 7 d/yr ≥100°F today · 16 d/yr by 30 yrs out
- Wind 2/10 Low
- Air quality 1/10 Low 0 unhealthy d/yr today · 0 by 30 yrs out
Nearby sold comps map
Loading sold comps map…
Walkable amenities ~0.75 mi
Loading nearby amenities…
Taxation est. · year 1
- Rental income
- $23,432
- − Mortgage interest
- −$13,438
- − Property taxes
- −$829
- − Insurance
- −$1,200
- − Repairs & maintenance
- −$1,875
- − Management
- −$1,875
- − Depreciation
- −$6,979
- Taxable loss
- −$2,762
- Est. tax savings @ 24.0%
- +$663
- After-tax cash flow
- $2,049/yr
For passive investors: Depreciation is non-cash, so a rental often shows a tax loss while cash-flowing — sheltering income. Rental losses are passive: they offset passive income freely, and up to $25,000/yr can offset ordinary (W-2) income if you actively participate and your MAGI is under $100k (phasing out to $0 by $150k); unused losses carry forward. On sale, claimed depreciation is recaptured at up to 25%, and gains may owe capital-gains tax (a 1031 exchange can defer both). Figures are a year-1 estimate at your 24.0% rate — not tax advice; consult a CPA.
Schools (NCES district)
- District
- South Central Community School Corporation
- NCES district ID
- 1802190
- Math proficiency
- 39% ▼ -3.00%
- Reading proficiency
- 45% ▼ -8.00%
- Median HH income
- $69,255
- Composite
- 37.97/100
- National rank
- #4298
- State rank
- #101 of 301 in IN
Livability — Hanna
- Score
- 52/100
- State rank
- #650
- US rank
- #24903
Category grades
Schools grade is shown separately in the Schools card above.
Census & demographics
- Census place
- Hanna, IN
- Population (ZIP)
- 1,531
Population outlook (LaPorte County) Hauer SSP2
- Today (2025)
- 109,757 people
- By 2030
- 108,288 · -1.3%
- By 2040
- 105,070 · -4.3%
- By 2050
- 102,330 · -6.8%
- By 2075
- 97,009 · -11.6%
- By 2100
- 86,459 · -21.2%
Race, ethnicity, and origin ACS 2023
- Neighborhood character
- Predominantly White (89%)
- Race & ethnicity
- White 89% Two or more races 11% Hispanic / Latino 10%
- Hispanic origin (detail)
- Puerto Rican 9%
- Common ancestry
- Lithuanian 10% Romanian 10% Scotch-Irish 3%
Political lean MEDSL · LaPorte
- 2024 margin
- R (+14.1) · D 42.1% · R 56.2% · Other 1.7%
- 2008→2024 swing
- -19.1pp toward R · 2008: 5.0pp · 2024: -14.1pp
- All cycles
- 2024: R+14.1 2020: R+7.2 2016: R+6.4 2012: D+12.6 2008: D+5.0
Not yet ingested
- Civics
- —
Market trends
- HPI YoY
- ▲ 18.83%
- Current HPI
- 234.7752
- Rent YoY
- —
- Metro
- —
- State GDP YoY
- ▲ 2.90%
- F500 in state
- 18
Industry mix (Fortune 500 HQ in IN)
| Industry | F500 HQs | Revenue |
|---|---|---|
| Industrial Machinery | 2 | $37B |
|
||
| Healthcare | 1 | $177B |
|
||
| Pharmaceuticals | 1 | $45B |
|
||
| Metals / Steel | 1 | $18B |
|
||
| Agriculture | 1 | $17B |
|
||
| Packaging | 1 | $12B |
|
||
Price history
1 event — show timeline
- 2026-06-10 Listed $249,000 NIRA MLS as Distributed by MLS Grid
Property tax history
+6.3%/yrLatest (2024): $829 · +8.4% YoY. Source: county tax records.
Cash-flow waterfall
monthlySold comps — $/sqft
last 12 mo · ≤1 miLoading sold comps…