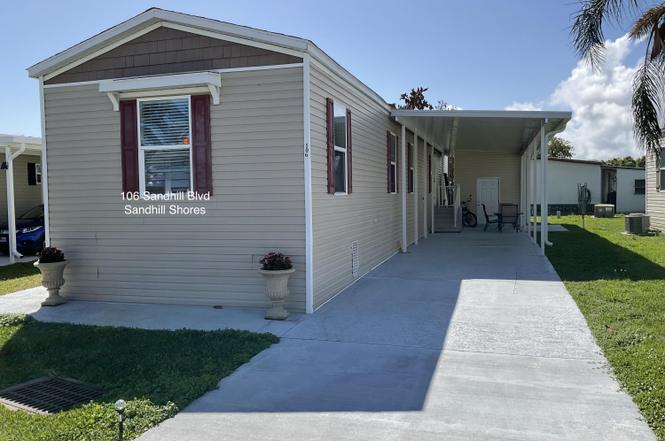
106 Sandhill Blvd · Fort Pierce, FL
Flood risk 1/10 · Minimal
- FEMA flood zone
- X (unshaded)
- Chance of flooding over 30 yrs
- 0.0%
- Est. flood insurance / yr
- $507 – $1,088
Fire risk 3/10 · Minor
- Est. fire insurance / yr
- $947 – $1,759
Heat risk 10/10 · Severe
- Hot days now (above 106°F)
- 7 days/yr
- Hot days in 30 yrs
- 25 days/yr
Wind risk 10/10 · Severe
- Chance of severe wind over 30 yrs
- 99.0%
Air-quality risk 2/10 · Minimal
- Unhealthy air days now
- 1 days/yr
- Unhealthy air days in 30 yrs
- 1 days/yr
Risk factors via First Street. Map © Google.
Why this score? — see what drove the B grade
The composite is a weighted blend of 9 inputs, each scored 0–100. Each bar is that input's sub-score; the figure is the points it added to the 100-point composite (weight × sub-score).
- Cash flow +30.0/30.0
- 1% rule +10.0/10.0
- DSCR +10.0/10.0
- ARV discount +7.5/15.0
- Rent growth +4.4/5.0
- Livability +3.8/5.0
- Schools +3.7/10.0
- Condition / age +2.5/5.0
- Appreciation +0.0/10.0
$99,000
🖨 Deal sheet (PDF) 📄 Offer letter ✓ Due diligence
Listing remarks
Beautiful 3-bedroom, 2-bath home sits in the popular 55+ Sandhill Shores community. Practically turnkey and ready for you to move right in, the home features a lovely open kitchen with a generous island perfect for cooking or casual entertaining, plus a spacious master bedroom suite that includes a walk-in closet and a private ensuite bath with both a separate shower and a relaxing tub. The thoughtful split-bedroom floor plan provides extra privacy for guests or family visits, while the convenient inside laundry makes everyday living easier. Outside, you'll love the large carport that offers plenty of shaded space to sit privately in comfort while still having room to park your car, along w
Key facts
- Generous island
- Walk-in closet
- Separate shower
Tags
Property features AI
Finance
- Other: Rented lot (Sandhill Shores)
- HOA & community: Association with monthly fee ($15) covering grounds and common area maintenance; Community amenities: clubhouse, pool, fitness center, billiard room, game room, community room, picnic area, shuffleboard court; Senior community; Pets allowed
Exterior
- Parking: Attached carport (covered) with 1 carport space and 1 open parking space
- Utilities: Public water; Public sewer; Three-phase electric service; Cable available
- Home design: Manufactured home; One-story; Faces south; Resale condition
- Construction: Modular construction
- Exterior features: Not waterfront
Interior
- Kitchen: Dishwasher; Electric range; Refrigerator
- Bedrooms: 3 bedrooms (all on main level)
- Flooring: Laminate; Vinyl
- Bathrooms: 2 full bathrooms (main level)
- Heating & cooling: Central electric heating; Central electric air conditioning
- Interior features: Kitchen island; Walk-in closet(s); Split bedroom layout; Furnished
- Laundry & utility: Laundry closet inside; Electric water heater
Neighborhood map
What this means for you Summary
Snapshot
- This is a 3-bed/2.0-bath manufactured listed at $99k.
Deal economics
- At list price, monthly cash flow is $879 ($11k/yr) — positive.
- The deal already cash-flows at list — no discount required.
- Meets the 1% rule at list price ($2k rent vs $99k).
- Recommended offer: $90k (9.0% below list) — sets the bar for market timing.
- Cap rate 16.9% vs local median 3.7% in Fort Pierce — top-decile yield for the area; either an underpriced asset or a hidden risk that comps aren't pricing in. Stress-test before assuming the spread holds.
Location & tenants
- Location reads 76/100 on livability (#226 in FL, #3,360 nationally) — a middle-class / working-renter tenant base. Strengths: commute A+, cost of living A+, housing A+; Watch: crime D+, amenities F, employment F.
- St. Lucie (urban): math 40% / reading 48% proficiency, ranked #51 of 73 in FL (top 70%) — families likely to look elsewhere, expect single-tenant / working-renter base with shorter leases.
- Zoned schools: Weatherbee Elementary School (math 32% / reading 32%, grade F, #1,797 of 2,144 statewide, top 86%, 672 students, 90% FRL); Dan Mccarty Middle School (math 23% / reading 23%, grade F, #542 of 571 statewide, top 95%, 747 students, 88% FRL); Fort Pierce Central High School (math 15% / reading 45%, grade F, #441 of 667 statewide, top 67%, 3,091 students, 62% FRL) — zoned schools average 80% FRL vs 59% district-wide (21 pts higher); higher-poverty schools than district average — tighter screening recommended.
- Zoned-school proficiency averages 28% at this address vs 44% district-wide (-16 pts) — the specific schools serving this property underperform the St. Lucie average; the district grade overstates school quality for this exact location.
- Market conditions: Rents rising fast (+7.4%/yr); 336 active listings in the ZIP; 27 comparable units currently listed for rent nearby; rentals at typical pace (median 25d on market — plan ~3-4 weeks tenant-placement turnaround); 4,868 units permitted in St. Lucie County in 2024 (268 in 5+ unit buildings).
- This rent runs 44% of the median local income ($54k/yr) — at the standard rent-burdened threshold; future hikes will face affordability resistance.
Forward outlook
- Local home prices are declining (-3.0%/yr); year-one equity from $684 of loan paydown is wiped out by about $3k of value loss. Plan a longer hold.
- St. Lucie County population projected at +20% by 2050 — long-run rental-demand tailwind backs the buy-and-hold thesis.
- At projected returns (-3.0% appreciation + 7.4% rent growth), your $28k cash investment doubles in ~3 years — after that, you're playing with house money.
Negotiation context
- It's been on market 105 days — a 9% lower offer ($90k) is reasonable based on typical stale-listing flexibility.
- 2 sale attempts since 3y ago with the ask held roughly flat each time — persistent listings suggest the price (not the market) is what's stuck; bring a comps-based counter.
Risks & watch-outs
- Climate carrying-cost: severe wind risk, 99% chance of damaging wind over 30y; extreme-heat days projected 7→25/yr by 2055 (HVAC capex compounding) — expect insurance premiums to compound above CPI over the hold.
Questions for the listing agent
- It's been on market 105 days. Have you received any prior offers? Is the seller open to a 9% concession, seller financing, or rate buy-down credit?
- What does the HOA fee cover, when was the last increase, and are there any pending special assessments or reserve-fund shortfalls?
- Why hasn't it sold? Are there any deal-killer items the seller is aware of (foundation, flood, title, zoning, code violations)?
- Is there a deadline driving the sale (1031 exchange, divorce, estate, relocation)? That informs how much negotiation room exists.
- Schools are D-rated, which usually means shorter tenancies and higher turnover. Who's the typical renter profile here, and what's been the actual vacancy rate?
- Crime grade is D in this area — have there been break-ins, vandalism, or insurance claims at this property in the last 3 years? What carrier currently insures it and at what premium?
- What's the average days-on-market for RENTAL listings here right now (not sales)? A rising rental-DOM trend means longer vacancies and softer asking-rent achievability than the comps imply.
- What's the recent tenant-quality profile in this submarket — average credit score on applications, eviction rate, late-payment / NSF rate, and stable-employment percentage? A property-management company in the area should have these aggregated.
- How much new for-sale + rental construction is in the pipeline within 1–3 miles? Heavy new supply typically softens prices + rents 12–24 months out; constrained supply supports both.
Investment metrics
- 1% rule
- 2.02% ✓
- Cap rate
- 16.94%
- Cash-on-cash
- 38.03%
- DSCR
- 2.69
- GRM
- 4.1
CMA / ARV
- ARV (on-the-fly)
- $1,216
- Comps found
- 1
Show comp detail 1 sale within ~0.75 mi
| Address | Dist | Beds/Ba | Sqft | Sold | Price | $/sf | Match |
|---|---|---|---|---|---|---|---|
| 137 Sandhill Blvd | 0.35mi | 2/2.0 (-1) | 1,200 (-1%) | 17mo | $1,000 | $1 | 62 |
Match score weights: distance 35% · size 25% · config 20% · recency 20%. Top-matched comps best support the ARV.
Projected returns pro-forma
-3.0% appreciation · 7.42% rent growth · sell at horizon
- IRR
- 39.1%
- Equity multiple
- 2.78×
- Total profit
- $49,230
- Equity at exit
- $14,761
- IRR
- 47.7%
- Equity multiple
- 6.66×
- Total profit
- $156,790
- Equity at exit
- $8,560
Cash invested: $27,720 (down + closing). Projections, not guarantees.
Landlord ↔ Tenant lean methodology
- Overall (STATE)
- 87 Strongly Landlord-Friendly
- State Florida
- 87 Strongly Landlord-Friendly · R+3
- County
- — inherits STATE
- City
- — inherits STATE
ZIP-level market 34982
- Home prices YoY
- -33.4%
- Rents YoY
- 7.4%
- Active inventory
- 336
- Price-to-rent
- 4.1×
Monthly cashflow live
- Estimated rent
- $1,997 high interval (Pro) →
- Mortgage (P&I)
- −$519
- Tax est. 1.5%
- −$124 /mo · $1,485/yr
- Insurance
- −$41
- HOA
- −$15
- Vacancy / Maint / Mgmt
- −$419
- Net cashflow
- $879
Break-even live
Sensitivity live
| Price | -10% $947 | -5% $913 | +0% $879 | +5% $844 | +10% $810 |
|---|---|---|---|---|---|
| Rent | -10% $721 | -5% $800 | +0% $879 | +5% $957 | +10% $1,036 |
| Rate | -1.0pp $928 | -0.5pp $904 | base $879 | +0.5pp $853 | +1.0pp $827 |
UW: 25.0% down · 7.5% · 30yr · 1.5% tax · 5.0% vac · 8.0% maint · 8.0% mgmt
Financing live
Cash to close
- Down payment
- $24,750
- Closing costs
- $2,970
- Reserves months
- —
- Total cash needed
- —
Loan-product check · same deal, 3 products live
Conventional
25% down · 7.5% · 30yr
- Down + closing
- —
- Monthly P&I
- —
- Monthly cashflow
- —
- DSCR
- —
- Eligible?
- —
Personal DTI + credit; lowest rate.
DSCR
20% down · 8.5% · 30yr
- Down + closing
- —
- Monthly P&I
- —
- Monthly cashflow
- —
- DSCR
- —
- Eligible?
- —
No personal income docs; deal must DSCR.
Hard money
10% down · 12.0% · 12mo
- Down + closing
- —
- Monthly P&I
- —
- Monthly cashflow
- —
- DSCR
- —
- Eligible?
- —
Short-term bridge; refi at stabilization.
Rent comps 27 comps
| Address | Beds | Baths | Sqft | Rent | $/sqft | DOM | Units | Dist |
|---|---|---|---|---|---|---|---|---|
| 1772 N Dovetail Dr Unit C Fort Pierce, FL | 2.0 | 2.0 | 1230 | $2,100 | $1.71 | 24d | 1 | 0.05mi |
| 1804 Blue Heron Ln Unit C Fort Pierce, FL | 2.0 | 2.0 | 1286 | $1,900 | $1.48 | 24d | 1 | 0.08mi |
| 1747 N Dovetail Dr Unit A Fort Pierce, FL | 2.0 | 2.0 | 1286 | $2,100 | $1.63 | 24d | 1 | 0.17mi |
| 3200 S US Highway 1 Fort Pierce, FL | 2.0–3.0 | 1.0–2.0 | 1144 | $1,945 | $1.70 | 15d | 1 | 0.19mi |
| 1739 N Dovetail Dr Fort Pierce, FL | 2.0 | 2.0 | 1230 | $1,750 | $1.42 | 24d | 1 | 0.20mi |
| 1829 Sandhill Crane Dr Unit B2 Fort Pierce, FL | 2.0 | 2.0 | 1334 | $2,000 | $1.50 | 24d | 1 | 0.26mi |
| 916 Savannas Point Dr Fort Pierce, FL | 2.0 | 2.0 | 1120 | $2,100 | $1.88 | 15d | 1 | 0.39mi |
| 3030 S US Highway 1 Fort Pierce, FL | 3.0 | 2.0 | 1184 | $1,774 | $1.50 | 15d | 1 | 0.49mi |
| 1219 S Lakes End Dr Unit 2 Fort Pierce, FL | 2.0 | 2.0 | 1186 | $1,500 | $1.26 | 15d | 1 | 0.71mi |
| 605 Ixoria Ave Fort Pierce, FL | 2.0 | 2.0 | 744 | $1,450 | $1.95 | 15d | 2 | 0.74mi |
| 605 Ixoria Ave #15 Fort Pierce, FL | 2.0 | 2.0 | 744 | $1,500 | $2.02 | 24d | 1 | 0.76mi |
| 410 Palm Ave Apt B Fort Pierce, FL | 2.0 | 1.0 | 800 | $1,400 | $1.75 | 15d | 1 | 0.80mi |
| 617 Ixoria Ave Unit 2A Fort Pierce, FL | 2.0 | 2.5 | 764 | $1,500 | $1.96 | 24d | 1 | 0.82mi |
| 800 Kanner Dr Unit B Fort Pierce, FL | 2.0 | 1.0 | 900 | $1,550 | $1.72 | 15d | 1 | 0.82mi |
| 3300 S 7th St Unit B Fort Pierce, FL | 2.0 | 1.0 | 800 | $1,595 | $1.99 | 24d | 1 | 0.83mi |
| 802 N Lake Dr Unit B Fort Pierce, FL | 2.0 | 1.0 | 1000 | $1,550 | $1.55 | 24d | 1 | 0.84mi |
| 115 Maple Ave Fort Pierce, FL | 3.0 | 1.0 | 1008 | $1,999 | $1.98 | 24d | 1 | 0.87mi |
| 2625 Heathcote Dr Unit 2647 Fort Pierce, FL | 2.0 | 2.0 | 1000 | $1,700 | $1.70 | 22d | 1 | 0.89mi |
| 2625 Heathcote Dr Unit 2623 Fort Pierce, FL | 2.0 | 2.0 | 1000 | $1,700 | $1.70 | 24d | 1 | 0.89mi |
| 2625 Heathcote Dr Unit 2631 Fort Pierce, FL | 2.0 | 2.0 | 1000 | $1,700 | $1.70 | 15d | 1 | 0.89mi |
| 2902 Oleander Blvd Fort Pierce, FL | 3.0 | 2.0 | 1276 | $2,700 | $2.12 | 24d | 1 | 0.98mi |
| 928 Fra Mar Pl Fort Pierce, FL | 3.0 | 1.0 | 1440 | $2,000 | $1.39 | 24d | 1 | 1.03mi |
| 947 Fra Mar Pl Fort Pierce, FL | 2.0 | 1.0 | 768 | $1,700 | $2.21 | 24d | 1 | 1.09mi |
| 4166 Gator Trace Villas Cir Unit B Fort Pierce, FL | 3.0 | 2.0 | 1336 | $2,200 | $1.65 | 24d | 1 | 1.26mi |
| 2050 Oleander Blvd Unit 703 Fort Pierce, FL | 2.0 | 2.0 | 1014 | $1,800 | $1.78 | 24d | 1 | 1.41mi |
| 4215 Gator Trace Ave Unit G Fort Pierce, FL | 2.0 | 2.0 | 1200 | $2,200 | $1.83 | 24d | 1 | 1.41mi |
| 2016 Golfview Ct Fort Pierce, FL | 2.0 | 1.0 | 1055 | $1,750 | $1.66 | 24d | 1 | 1.42mi |
HOA detail
- Monthly dues
- $15 · $180/yr
Listing history 20 events
-
2026-06-18days on market $99,000 Active 105 DOM
-
2026-06-17days on market $99,000 Active 104 DOM
-
2026-06-16days on market $99,000 Active 103 DOM
-
2026-06-15days on market $99,000 Active 102 DOM
-
2026-06-14days on market $99,000 Active 100 DOM
-
2026-06-13days on market $99,000 Active 99 DOM
-
2026-06-10days on market $99,000 Active 97 DOM
-
2026-06-09days on market $99,000 Active 96 DOM
-
2026-06-08days on market $99,000 Active 95 DOM
-
2026-06-07days on market $99,000 Active 94 DOM
-
2026-06-05days on market $99,000 Active 91 DOM
-
2026-06-03days on market $99,000 Active 90 DOM
-
2026-06-02days on market $99,000 Active 89 DOM
-
2026-06-01days on market $99,000 Active 88 DOM
-
2026-05-31days on market $99,000 Active 87 DOM
-
2026-05-30days on market $99,000 Active 86 DOM
-
2026-03-05$99,000 Active
-
2023-03-30historical
-
2023-03-20price $102,000
-
2023-03-05$105,000 Active
ⓘ Source: listings_history table (triggers on properties + properties_extension) + one-shot
backfill from property_details.listing_events for pre-trigger history.
Climate risk First Street
- Flood 1/10 Low FEMA zone X (unshaded) · 0% chance over 30 yrs
- Wildfire 3/10 Moderate
- Heat 10/10 Extreme 7 d/yr ≥106°F today · 25 d/yr by 30 yrs out
- Wind 10/10 Extreme 99% chance of damaging wind over 30 yrs
- Air quality 2/10 Low 1 unhealthy d/yr today · 1 by 30 yrs out
Nearby sold comps map
Loading sold comps map…
Walkable amenities ~0.75 mi
Loading nearby amenities…
Taxation est. · year 1
- Rental income
- $23,965
- − Mortgage interest
- −$5,546
- − Property taxes
- −$1,485
- − Insurance
- −$495
- − Repairs & maintenance
- −$1,917
- − Management
- −$1,917
- − HOA
- −$180
- − Depreciation
- −$2,880
- Taxable income
- $9,545
- Est. tax owed @ 24.0%
- −$2,291
- After-tax cash flow
- $8,252/yr
For passive investors: Depreciation is non-cash, so a rental often shows a tax loss while cash-flowing — sheltering income. Rental losses are passive: they offset passive income freely, and up to $25,000/yr can offset ordinary (W-2) income if you actively participate and your MAGI is under $100k (phasing out to $0 by $150k); unused losses carry forward. On sale, claimed depreciation is recaptured at up to 25%, and gains may owe capital-gains tax (a 1031 exchange can defer both). Figures are a year-1 estimate at your 24.0% rate — not tax advice; consult a CPA.
Schools (NCES district)
- District
- St. Lucie
- NCES district ID
- 1201770
- Math proficiency
- 40% ▼ -11.00%
- Reading proficiency
- 48% ▼ -4.00%
- Median HH income
- $44,737
- Composite
- 37.28/100
- National rank
- #4449
- State rank
- #51 of 73 in FL
Livability — Fort Pierce
- Score
- 76/100
- State rank
- #226
- US rank
- #3360
Category grades
Schools grade is shown separately in the Schools card above.
Census & demographics
- Census place
- Fort Pierce, FL
- County
- Saint Lucie County · 337,150 people
- City population
- 27,447
- Metro
- Port St. Lucie, FL
- Population (ZIP)
- 31,143
- Household income
- $54,082
- Rent vs Own
- Severe rent burden
- 1086.0
Population outlook (St. Lucie County) Hauer SSP2
- Today (2025)
- 338,016 people
- By 2030
- 355,687 · +5.2%
- By 2040
- 385,521 · +14.1%
- By 2050
- 406,106 · +20.1%
- By 2075
- 441,054 · +30.5%
- By 2100
- 436,885 · +29.2%
Race, ethnicity, and origin ACS 2023
- Neighborhood character
- Majority White (62%)
- Race & ethnicity
- White 62% Hispanic / Latino 22% Two or more races 12% Black 12%
- Hispanic origin (detail)
- Mexican 10% Puerto Rican 3% Cuban 3%
- Common ancestry
- Italian 7% Hispanic 2% Lithuanian 1%
- Foreign-born
- 12% · Canada
- Languages at home
- 80% English-only · Spanish 16% French/Haitian/Cajun 3%
Political lean MEDSL · St. Lucie
- 2024 margin
- Lean R (+9.1) · D 45.1% · R 54.2%
- 2008→2024 swing
- -21.2pp toward R · 2008: 12.1pp · 2024: -9.1pp
- All cycles
- 2024: R+9.1 2020: R+1.6 2016: R+2.5 2012: D+7.9 2008: D+12.1
Not yet ingested
- Civics
- —
Market trends
- HPI YoY
- ▼ -199.47%
- Current HPI
- 397.2649
- Rent YoY
- ▲ 7.42%
- Metro
- Port St. Lucie, FL
- State GDP YoY
- ▲ 3.28%
- F500 in state
- 36
Industry mix (Fortune 500 HQ in FL)
| Industry | F500 HQs | Revenue |
|---|---|---|
| Industrial Technology | 2 | $29B |
|
||
| Insurance | 2 | $17B |
|
||
| Retail | 1 | $60B |
|
||
| Technology Distribution | 1 | $58B |
|
||
| Homebuilding | 1 | $35B |
|
||
| Technology Manufacturing | 1 | $35B |
|
||
Price history
-5.7% since first listed4 events — show timeline
- 2026-03-05 Listed $99,000 Beaches MLS
- 2023-03-30 Listing Removed — Beaches MLS
- 2023-03-20 Price Changed $102,000 Beaches MLS
- 2023-03-05 Listed $105,000 Beaches MLS
Cash-flow waterfall
monthlySold comps — $/sqft
last 12 mo · ≤1 miLoading sold comps…