2468 Country Manor St · Country Squire Lakes, IN
Flood risk 1/10 · Minimal
- FEMA flood zone
- X (unshaded)
- Chance of flooding over 30 yrs
- 0.0%
- Est. flood insurance / yr
- $507 – $1,088
Fire risk 1/10 · Minimal
- Est. fire insurance / yr
- $717 – $1,331
Heat risk 4/10 · Minor
- Hot days now (above 103°F)
- 7 days/yr
- Hot days in 30 yrs
- 19 days/yr
Wind risk 2/10 · Minimal
- Chance of severe wind over 30 yrs
- 1.0%
Air-quality risk 1/10 · Minimal
- Unhealthy air days now
- 0 days/yr
- Unhealthy air days in 30 yrs
- 0 days/yr
Risk factors via First Street. Map © Google.
Why this score? — see what drove the C+ grade
The composite is a weighted blend of 9 inputs, each scored 0–100. Each bar is that input's sub-score; the figure is the points it added to the 100-point composite (weight × sub-score).
- Cash flow +30.0/30.0
- 1% rule +10.0/10.0
- DSCR +10.0/10.0
- Schools +3.0/10.0
- Livability +3.0/5.0
- Rent growth +2.5/5.0
- Condition / age +2.5/5.0
- ARV discount +0.0/15.0
- Appreciation +0.0/10.0
$74,999
🖨 Deal sheet 📄 Offer letter ✓ Due diligence
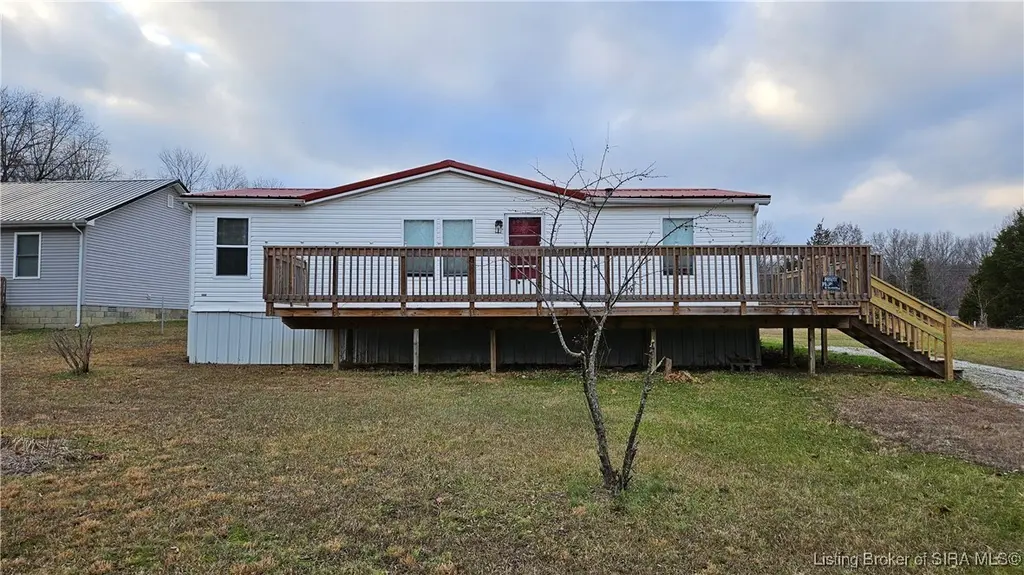
Listing remarks
Welcome to 2468 Country Manor Street. This spacious manufactured home is located in the Country Squire Lakes subdivision in North Vernon. Come enjoy the lakes for fishing and quiet country living. Perfect for investors, or first-time home buyers who don’t mind putting in a little work, this property has great bones and just needs a light cosmetic refresh inside. A lovely deck that nearly spans the width of the home greets you as you walk up. Heading inside, into the living room, you will immediately notice the abundant natural light and half vaulted ceilings that are throughout the home. Off the living room is a large eat-in kitchen with ample cabinet space, white appliances, and the
Key facts
- Large eat-in kitchen
- Lovely deck
- Lakes for fishing
Tags
Property features AI
Finance
- Financial info: Annual association fee
- HOA & community: Homeowners association with annual fee; Association amenities include clubhouse, playground, and water access; Community features include clubhouse, lake, and playground
Exterior
- Utilities: Public water (connected); Public sewer
- Home design: Double wide mobile home; One story; Metal roof
- Construction: Vinyl siding; Block foundation
- Exterior features: Deck; Shed(s); Handicap accessible; Paved road access
Interior
- Kitchen: Oven; Range; Refrigerator; Eat-in kitchen layout
- Bedrooms: Bedrooms located on the main level
- Flooring: Laminate flooring in living areas, kitchen, and some baths; Carpet in bedrooms and other rooms
- Bathrooms: 2 full bathrooms
- Heating & cooling: Central air conditioning; Forced air heating
- Interior features: Ceiling fans; Eat-in kitchen; Garden/roman tub; Primary bedroom with bath on main level; Separate shower; Vaulted ceilings; Window treatments and blinds
- Laundry & utility: Main-level laundry in a laundry closet
Neighborhood map
What this means for you Summary
Snapshot
- This is a 3-bed/2.0-bath manufactured listed at $75k.
Deal economics
- At list price, monthly cash flow is $582 ($7k/yr) — positive.
- The deal already cash-flows at list — no discount required.
- Meets the 1% rule at list price ($1k rent vs $75k).
- Recommended offer: $70k (6.0% below list) — sets the bar for market timing.
- Cap rate 15.6% vs local median 6.0% in Country Squire Lakes — top-decile yield for the area; either an underpriced asset or a hidden risk that comps aren't pricing in. Stress-test before assuming the spread holds.
Location & tenants
- Location reads 59/100 on livability (#566 in IN) — a working-class tenant base; expect higher turnover. Strengths: cost of living A+, housing A+, crime A-; Watch: health & safety D, schools F, amenities F.
- Jennings County School Corporation (rural): math 32% / reading 38% proficiency, ranked #194 of 301 in IN (top 64%) — families likely to look elsewhere, expect single-tenant / working-renter base with shorter leases.
- Market conditions: 160 active listings in the ZIP; 84 units permitted in Jennings County in 2024 (0 in 5+ unit buildings).
Forward outlook
- Local home prices are declining (-3.0%/yr); year-one equity from $518 of loan paydown is wiped out by about $2k of value loss. Plan a longer hold.
- Jennings County population projected at -21% by 2050 — secular population decline; favor cash flow + early exit over multi-decade hold.
- At projected returns (-3.0% appreciation + 3.0% rent growth), your $21k cash investment doubles in ~4 years — after that, you're playing with house money.
Negotiation context
- It's been on market 77 days — a 6% lower offer ($70k) is reasonable based on typical stale-listing flexibility.
- 4 sale attempts; this cycle's ask has dropped $19k (20%) from the opening price — seller is motivated, your offer sets the floor, not the list.
Questions for the listing agent
- It's been on market 77 days. Have you received any prior offers? Is the seller open to a 6% concession, seller financing, or rate buy-down credit?
- What does the HOA fee cover, when was the last increase, and are there any pending special assessments or reserve-fund shortfalls?
- Why hasn't it sold? Are there any deal-killer items the seller is aware of (foundation, flood, title, zoning, code violations)?
- Is there a deadline driving the sale (1031 exchange, divorce, estate, relocation)? That informs how much negotiation room exists.
- Schools are F-rated, which usually means shorter tenancies and higher turnover. Who's the typical renter profile here, and what's been the actual vacancy rate?
- What's the average days-on-market for RENTAL listings here right now (not sales)? A rising rental-DOM trend means longer vacancies and softer asking-rent achievability than the comps imply.
- What's the recent tenant-quality profile in this submarket — average credit score on applications, eviction rate, late-payment / NSF rate, and stable-employment percentage? A property-management company in the area should have these aggregated.
- How much new for-sale + rental construction is in the pipeline within 1–3 miles? Heavy new supply typically softens prices + rents 12–24 months out; constrained supply supports both.
Investment metrics
- 1% rule
- 1.79% ✓
- Cap rate
- 15.60%
- Cash-on-cash
- 33.24%
- DSCR
- 2.48
- GRM
- 4.7
CMA / ARV
- ARV (on-the-fly)
- $55,680
- Comps found
- 2
Show comp detail 2 sales within ~0.75 mi
| Address | Dist | Beds/Ba | Sqft | Sold | Price | $/sf | Match |
|---|---|---|---|---|---|---|---|
| 3503 Penny Ln | 0.62mi | 2/2.0 (-1) | 952 (-1%) | 12mo | $55,000 | $58 | 55 |
| 319 Honeylocust Pl | 0.74mi | 2/1.0 (-1) | 980 (+2%) | 3mo | $23,000 | $23 | 50 |
Match score weights: distance 35% · size 25% · config 20% · recency 20%. Top-matched comps best support the ARV.
Projected returns pro-forma
-3.0% appreciation · 3.0% rent growth · sell at horizon
- IRR
- 28.5%
- Equity multiple
- 2.19×
- Total profit
- $24,894
- Equity at exit
- $11,183
- IRR
- 35.9%
- Equity multiple
- 4.30×
- Total profit
- $69,365
- Equity at exit
- $6,485
Cash invested: $21,000 (down + closing). Projections, not guarantees.
Landlord ↔ Tenant lean methodology
- Overall (STATE)
- 90 Strongly Landlord-Friendly
- State Indiana
- 90 Strongly Landlord-Friendly · R+11
- County
- — inherits STATE
- City
- — inherits STATE
ZIP-level market 47265
- Home prices YoY
- -31.5%
- Active inventory
- 160
- Price-to-rent
- 4.7×
Monthly cashflow live
- Estimated rent
- $1,339 medium interval (Pro) →
- Mortgage (P&I)
- −$393
- Tax from tax record
- −$25 /mo · $296/yr
- Insurance
- −$31
- HOA
- −$27
- Vacancy / Maint / Mgmt
- −$281
- Net cashflow
- $582
Break-even live
UW: 25.0% down · 7.5% · 30yr · 1.5% tax · 5.0% vac · 8.0% maint · 8.0% mgmt
Financing live
Cash to close
- Down payment
- $18,750
- Closing costs
- $2,250
- Reserves months
- —
- Total cash needed
- —
Loan-product check · same deal, 3 products live
Conventional
25% down · 7.5% · 30yr
- Down + closing
- —
- Monthly P&I
- —
- Monthly cashflow
- —
- DSCR
- —
- Eligible?
- —
Personal DTI + credit; lowest rate.
DSCR
20% down · 8.5% · 30yr
- Down + closing
- —
- Monthly P&I
- —
- Monthly cashflow
- —
- DSCR
- —
- Eligible?
- —
No personal income docs; deal must DSCR.
Hard money
10% down · 12.0% · 12mo
- Down + closing
- —
- Monthly P&I
- —
- Monthly cashflow
- —
- DSCR
- —
- Eligible?
- —
Short-term bridge; refi at stabilization.
HOA detail
- Monthly dues
- $27 · $324/yr
Listing history 6 events
-
2026-06-19days on market $74,999 Active 77 DOM
-
2026-06-18days on market $74,999 Active 76 DOM
-
2026-06-09days on market $74,999 Active 75 DOM
-
2026-06-08days on market $74,999 Active 74 DOM
-
2026-06-07remarks 693-char remark
-
2026-06-07$74,999 Active 73 DOM
ⓘ Source: listings_history table (triggers on properties + properties_extension) + one-shot
backfill from property_details.listing_events for pre-trigger history.
Tax reassessment forecast IN · Partial reset (capped growth)
- Current annual tax
- $296 · $25/mo
- Projected year-2 tax
- $467 · $39/mo
- Expected delta
- +$171/yr (+$14/mo · 57.5%)
ⓘ Screening estimate from a state-policy table — verify with the county assessor before closing.
Climate risk First Street
- Flood 1/10 Low FEMA zone X (unshaded) · 0% chance over 30 yrs
- Wildfire 1/10 Low
- Heat 4/10 Moderate 7 d/yr ≥103°F today · 19 d/yr by 30 yrs out
- Wind 2/10 Low 100% chance of damaging wind over 30 yrs
- Air quality 1/10 Low 0 unhealthy d/yr today · 0 by 30 yrs out
Nearby sold comps map
Loading sold comps map…
Walkable amenities ~0.75 mi
Loading nearby amenities…
Taxation est. · year 1
- Rental income
- $16,071
- − Mortgage interest
- −$4,201
- − Property taxes
- −$296
- − Insurance
- −$375
- − Repairs & maintenance
- −$1,286
- − Management
- −$1,286
- − HOA
- −$324
- − Depreciation
- −$2,182
- Taxable income
- $6,121
- Est. tax owed @ 24.0%
- −$1,469
- After-tax cash flow
- $5,512/yr
For passive investors: Depreciation is non-cash, so a rental often shows a tax loss while cash-flowing — sheltering income. Rental losses are passive: they offset passive income freely, and up to $25,000/yr can offset ordinary (W-2) income if you actively participate and your MAGI is under $100k (phasing out to $0 by $150k); unused losses carry forward. On sale, claimed depreciation is recaptured at up to 25%, and gains may owe capital-gains tax (a 1031 exchange can defer both). Figures are a year-1 estimate at your 24.0% rate — not tax advice; consult a CPA.
Schools (NCES district)
- District
- Jennings County School Corporation
- NCES district ID
- 1805190
- Math proficiency
- 32% ▼ -11.00%
- Reading proficiency
- 38% ▼ -6.00%
- Median HH income
- $45,418
- Composite
- 29.89/100
- National rank
- #6394
- State rank
- #194 of 301 in IN
Livability — Country Squire Lakes
- Score
- 59/100
- State rank
- #566
- US rank
- #20238
Category grades
Schools grade is shown separately in the Schools card above.
Census & demographics
- Census place
- Country Squire Lakes, IN
- Population (ZIP)
- 20,981
Population outlook (Jennings County) Hauer SSP2
- Today (2025)
- 26,584 people
- By 2030
- 25,591 · -3.7%
- By 2040
- 23,423 · -11.9%
- By 2050
- 20,973 · -21.1%
- By 2075
- 15,445 · -41.9%
- By 2100
- 10,714 · -59.7%
Race, ethnicity, and origin ACS 2023
- Neighborhood character
- Predominantly White (92%)
- Race & ethnicity
- White 92% Hispanic / Latino 4% Two or more races 3%
- Common ancestry
- Slovak 2% Romanian 1% Italian 1%
- Foreign-born
- 1% · Canada
- Languages at home
- 96% English-only · Spanish 2% German/W. Germanic 1%
Political lean MEDSL · Jennings
- 2024 margin
- Solid R (+58.8) · D 19.7% · R 78.5% · Other 1.8%
- 2008→2024 swing
- -50.8pp toward R · 2008: -8.0pp · 2024: -58.8pp
- All cycles
- 2024: R+58.8 2020: R+56.9 2016: R+52.7 2012: R+22.4 2008: R+8.0
Not yet ingested
- Civics
- —
Market trends
- HPI YoY
- ▼ -107.36%
- Current HPI
- 233.0275
- Rent YoY
- —
- Metro
- —
- State GDP YoY
- ▲ 2.90%
- F500 in state
- 18
Industry mix (Fortune 500 HQ in IN)
| Industry | F500 HQs | Revenue |
|---|---|---|
| Industrial Machinery | 2 | $37B |
|
||
| Healthcare | 1 | $177B |
|
||
| Pharmaceuticals | 1 | $45B |
|
||
| Metals / Steel | 1 | $18B |
|
||
| Agriculture | 1 | $17B |
|
||
| Packaging | 1 | $12B |
|
||
Price history
-16.6% since first listed11 events — show timeline
- 2026-06-05 Relisted — SIRA
- 2026-03-20 Delisted — SIRA
- 2026-03-10 Price Changed $74,999 SIRA
- 2026-03-02 Price Changed $79,999 SIRA
- 2026-02-23 Price Changed $84,999 SIRA
- 2026-02-03 Price Changed $89,999 SIRA
- 2026-01-08 Listed $93,999 SIRA
- 2025-12-09 Listing Removed — MIBOR as Distributed by MLS Grid
- 2025-09-29 Relisted — MIBOR as Distributed by MLS Grid
- 2025-09-14 Pending — MIBOR as Distributed by MLS Grid
- 2025-09-09 Listed $89,900 MIBOR as Distributed by MLS Grid
Property tax history
+15.6%/yrLatest (2024): $296 · +985.6% YoY. Source: county tax records.
Cash-flow waterfall
monthlySold comps — $/sqft
last 12 mo · ≤1 miLoading sold comps…