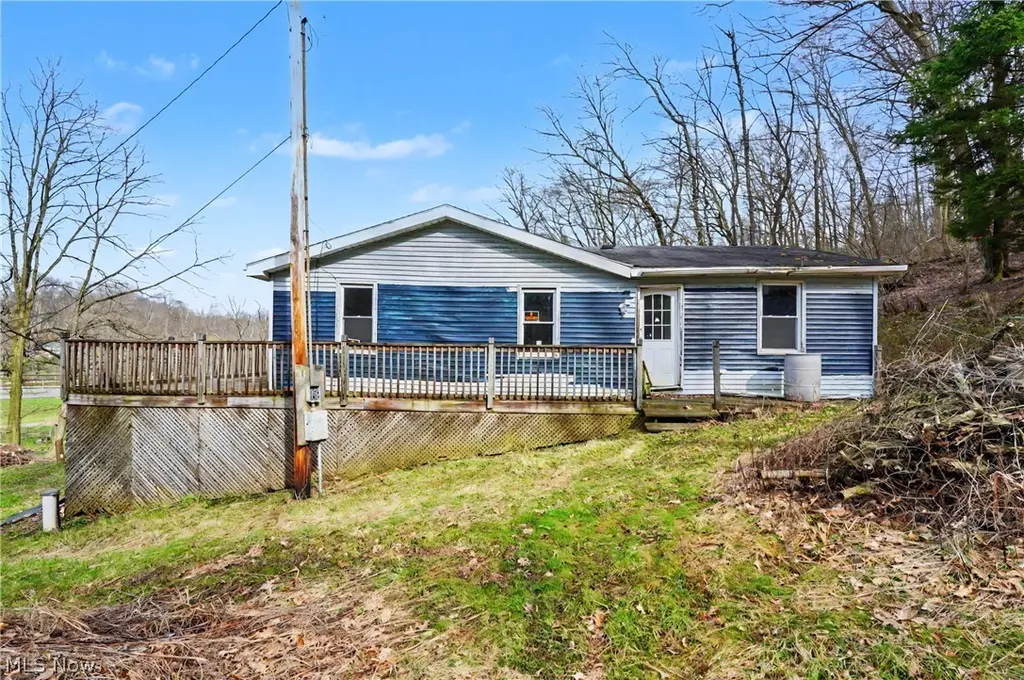
8177 West Rd · Salem, OH
Flood risk 9/10 · Severe
- FEMA flood zone
- X (unshaded)
- Chance of flooding over 30 yrs
- 0.99%
- Est. flood insurance / yr
- $473 – $860
Fire risk 1/10 · Minimal
- Est. fire insurance / yr
- $713 – $1,323
Heat risk 2/10 · Minimal
- Hot days now (above 97°F)
- 7 days/yr
- Hot days in 30 yrs
- 17 days/yr
Wind risk 1/10 · Minimal
- Chance of severe wind over 30 yrs
- —
Air-quality risk 2/10 · Minimal
- Unhealthy air days now
- 1 days/yr
- Unhealthy air days in 30 yrs
- 2 days/yr
Risk factors via First Street. Map © Google.
Why this score? — see what drove the B grade
The composite is a weighted blend of 9 inputs, each scored 0–100. Each bar is that input's sub-score; the figure is the points it added to the 100-point composite (weight × sub-score).
- Cash flow +30.0/30.0
- 1% rule +10.0/10.0
- DSCR +10.0/10.0
- ARV discount +7.5/15.0
- Schools +7.1/10.0
- Livability +3.4/5.0
- Rent growth +2.5/5.0
- Condition / age +2.5/5.0
- Appreciation +0.0/10.0
$24,900
🖨 Deal sheet 📄 Offer letter ✓ Due diligence
Listing remarks MLS
Opportunity awaits with this affordable ranch in the South Range School District! Situated on a . 29-acre lot, this 2-bedroom, 1-bath home offers 960 sq ft —providing plenty of potential for renovation or investment. The property has a fairly new WELL and SEPTIC system installed. This home could optionally be torn down and a new home or garage could be built with well and septic in place. Ideal for investors, flippers, or buyers looking to build equity, this home is being sold as-is and priced accordingly. Enjoy a rural setting, sitting well off the road with nice views and with convenient access to Route 14 and Salem, Boardman, and surrounding areas. Whether you’re looking for your next project or a budget-friendly opportunity, this property offers strong potential at an affordable price.
Key facts
- 0.29 acre lot
- Built 1900
- Listed 76 days
Neighborhood map
What this means for you Summary
Snapshot
- This is a 2-bed/1.0-bath single-family listed at $25k.
Deal economics
- At list price, monthly cash flow is $470 ($6k/yr) — positive.
- The deal already cash-flows at list — no discount required.
- Meets the 1% rule at list price ($942 rent vs $25k).
- Recommended offer: $23k (6.0% below list) — sets the bar for market timing.
- Cap rate 31.6% vs local median 3.0% in Salem — top-decile yield for the area; either an underpriced asset or a hidden risk that comps aren't pricing in. Stress-test before assuming the spread holds.
Location & tenants
- Location reads 68/100 on livability (#538 in OH) — a middle-class / working-renter tenant base. Strengths: cost of living A+, housing A, schools B+; Watch: amenities F, commute F, employment F.
- South Range Local (rural): math 83% / reading 84% proficiency, ranked #39 of 656 in OH (top 6%) — strong family-tenant draw, lease renewals of 3-5y typical.
- Market conditions: 86 active listings in the ZIP; 147 units permitted in Mahoning County in 2024 (0 in 5+ unit buildings).
Forward outlook
- Local home prices are declining (-3.0%/yr); year-one equity from $172 of loan paydown is wiped out by about $747 of value loss. Plan a longer hold.
- Mahoning County population projected at -14% by 2050 — secular population decline; favor cash flow + early exit over multi-decade hold.
- At projected returns (-3.0% appreciation + 3.0% rent growth), your $7k cash investment doubles in ~2 years — after that, you're playing with house money.
Negotiation context
- It's been on market 77 days — a 6% lower offer ($23k) is reasonable based on typical stale-listing flexibility.
- 8 sale attempts since 24y ago; this cycle's ask has dropped $4k (14%) from the opening price — seller is motivated, your offer sets the floor, not the list.
- Current owner paid $14k; list at $25k implies a 78% gain — meaningful room to come down on a strong offer.
Risks & watch-outs
- Watch-outs: property tax is 3.7% of price; flood insurance adds $56/mo; built in 1900 — expect roof / HVAC / electrical / plumbing capex.
- Climate carrying-cost: severe flood risk — expect insurance premiums to compound above CPI over the hold.
Questions for the listing agent
- It's been on market 77 days. Have you received any prior offers? Is the seller open to a 6% concession, seller financing, or rate buy-down credit?
- Built in 1900 — when were the roof, HVAC, electrical panel, plumbing, and water heater last replaced?
- Property tax is high relative to price — has the assessment been appealed recently, and will the sale trigger a re-assessment?
- What's the actual annual flood-insurance premium (NFIP or private), and is the property in a SFHA with mandatory coverage?
- Why hasn't it sold? Are there any deal-killer items the seller is aware of (foundation, flood, title, zoning, code violations)?
- Is there a deadline driving the sale (1031 exchange, divorce, estate, relocation)? That informs how much negotiation room exists.
- Schools are B-rated — typically a magnet for longer-tenancy family renters. What's the average tenant stay here, and is there a school-zone premium baked into asking?
- What's the average days-on-market for RENTAL listings here right now (not sales)? A rising rental-DOM trend means longer vacancies and softer asking-rent achievability than the comps imply.
- What's the recent tenant-quality profile in this submarket — average credit score on applications, eviction rate, late-payment / NSF rate, and stable-employment percentage? A property-management company in the area should have these aggregated.
- How much new for-sale + rental construction is in the pipeline within 1–3 miles? Heavy new supply typically softens prices + rents 12–24 months out; constrained supply supports both.
Investment metrics
- 1% rule
- 3.78% ✓
- Cap rate
- 31.63%
- Cash-on-cash
- 90.48%
- DSCR
- 5.03
- GRM
- 2.2
CMA / ARV
- ARV (median comp)
- $164,190
- List price
- $24,900
- Delta
- -84.83%
- Verdict
- UNDERPRICED
- Comps
- 20 within 2.0 mi
Projected returns pro-forma
-3.0% appreciation · 3.0% rent growth · sell at horizon
- IRR
- 81.2%
- Equity multiple
- 4.73×
- Total profit
- $25,986
- Equity at exit
- $3,713
- IRR
- 84.6%
- Equity multiple
- 9.82×
- Total profit
- $61,497
- Equity at exit
- $2,153
Cash invested: $6,972 (down + closing). Projections, not guarantees.
Landlord ↔ Tenant lean methodology
- Overall (STATE)
- 73 Landlord-Friendly
- State Ohio
- 73 Landlord-Friendly · R+6
- County
- — inherits STATE
- City
- — inherits STATE
ZIP-level market 44460
- Home prices YoY
- -32.5%
- Active inventory
- 86
- Price-to-rent
- 2.2×
Monthly cashflow live
- Estimated rent
- $942 medium interval (Pro) →
- Mortgage (P&I)
- −$131
- Tax from tax record
- −$77 /mo · $927/yr
- Insurance
- −$10
- Flood insurance flood zone
- −$56 /mo · $666/yr
- HOA
- −$0
- Vacancy / Maint / Mgmt
- −$198
- Net cashflow
- $470
Break-even live
UW: 25.0% down · 7.5% · 30yr · 1.5% tax · 5.0% vac · 8.0% maint · 8.0% mgmt
Financing live
Cash to close
- Down payment
- $6,225
- Closing costs
- $747
- Reserves months
- —
- Total cash needed
- —
Loan-product check · same deal, 3 products live
Conventional
25% down · 7.5% · 30yr
- Down + closing
- —
- Monthly P&I
- —
- Monthly cashflow
- —
- DSCR
- —
- Eligible?
- —
Personal DTI + credit; lowest rate.
DSCR
20% down · 8.5% · 30yr
- Down + closing
- —
- Monthly P&I
- —
- Monthly cashflow
- —
- DSCR
- —
- Eligible?
- —
No personal income docs; deal must DSCR.
Hard money
10% down · 12.0% · 12mo
- Down + closing
- —
- Monthly P&I
- —
- Monthly cashflow
- —
- DSCR
- —
- Eligible?
- —
Short-term bridge; refi at stabilization.
Listing history 39 events
-
2026-06-19days on market $24,900 Active 77 DOM
-
2026-06-18days on market $24,900 Active 76 DOM
-
2026-06-17days on market $24,900 Active 75 DOM
-
2026-06-16days on market $24,900 Active 74 DOM
-
2026-06-15days on market $24,900 Active 73 DOM
-
2026-06-14days on market $24,900 Active 71 DOM
-
2026-06-13days on market $24,900 Active 70 DOM
-
2026-06-10days on market $24,900 Active 68 DOM
-
2026-06-09days on market $24,900 Active 67 DOM
-
2026-06-08days on market $24,900 Active 66 DOM
-
2026-06-07days on market $24,900 Active 65 DOM
-
2026-06-05days on market $24,900 Active 62 DOM
-
2026-06-02days on market $24,900 Active 60 DOM
-
2026-06-01days on market $24,900 Active 59 DOM
-
2026-05-31days on market $24,900 Active 58 DOM
-
2026-05-30days on market $24,900 Active 57 DOM
-
2026-04-22price $24,900 812-char remark
Show marketing remark (812 chars)
Opportunity awaits with this affordable ranch in the South Range School District! Situated on a . 29-acre lot, this 2-bedroom, 1-bath home offers 960 sq ft —providing plenty of potential for renovation or investment. The property has a fairly new WELL and SEPTIC system installed. This home could optionally be torn down and a new home or garage could be built with well and septic in place. Ideal for investors, flippers, or buyers looking to build equity, this home is being sold as-is and priced accordingly. Enjoy a rural setting, sitting well off the road with nice views and with convenient access to Route 14 and Salem, Boardman, and surrounding areas. Whether you’re looking for your next project or a budget-friendly opportunity, this property offers strong potential at an affordable price.
-
2026-04-01$29,000 Active 812-char remark
Show marketing remark (812 chars)
Opportunity awaits with this affordable ranch in the South Range School District! Situated on a . 29-acre lot, this 2-bedroom, 1-bath home offers 960 sq ft —providing plenty of potential for renovation or investment. The property has a fairly new WELL and SEPTIC system installed. This home could optionally be torn down and a new home or garage could be built with well and septic in place. Ideal for investors, flippers, or buyers looking to build equity, this home is being sold as-is and priced accordingly. Enjoy a rural setting, sitting well off the road with nice views and with convenient access to Route 14 and Salem, Boardman, and surrounding areas. Whether you’re looking for your next project or a budget-friendly opportunity, this property offers strong potential at an affordable price.
-
2024-05-30soldstatus $14,000 Closed 134-char remark
Show marketing remark (134 chars)
Ranch home located in South Range LSD. Property sold as is. No guarantees. No warranties. Must be pre-approved or show proof of funds.
-
2024-05-23status Pending 134-char remark
Show marketing remark (134 chars)
Ranch home located in South Range LSD. Property sold as is. No guarantees. No warranties. Must be pre-approved or show proof of funds.
-
2024-04-30historical Contingent 134-char remark
Show marketing remark (134 chars)
Ranch home located in South Range LSD. Property sold as is. No guarantees. No warranties. Must be pre-approved or show proof of funds.
-
2024-04-19$14,900 Active 134-char remark
Show marketing remark (134 chars)
Ranch home located in South Range LSD. Property sold as is. No guarantees. No warranties. Must be pre-approved or show proof of funds.
-
2024-02-11historical
-
2024-01-19$19,900 Active
-
2023-12-05historical
-
2023-09-07status Active
-
2023-09-03historical
-
2023-08-25price $19,900
-
2023-07-18price $21,900
-
2023-06-05$25,000 Active
-
2005-03-31soldstatus $42,900
-
2005-03-30soldstatus $42,900
-
2004-08-27$42,900
-
2003-12-09soldstatus $8,500
-
2003-10-28historical
-
2003-07-25$9,900
-
2002-10-28$29,000
-
1999-04-16soldstatus $30,200
-
1989-12-20soldstatus $10,000
ⓘ Source: listings_history table (triggers on properties + properties_extension) + one-shot
backfill from property_details.listing_events for pre-trigger history.
Tax reassessment forecast OH · Partial reset (capped growth)
- Current annual tax
- $927 · $77/mo
- Projected year-2 tax
- $927 · $77/mo
- Expected delta
- $0/yr ($0/mo · 0.0%)
ⓘ Screening estimate from a state-policy table — verify with the county assessor before closing.
Climate risk First Street
- Flood 9/10 Extreme FEMA zone X (unshaded) · 99% chance over 30 yrs
- Wildfire 1/10 Low
- Heat 2/10 Low 7 d/yr ≥97°F today · 17 d/yr by 30 yrs out
- Wind 1/10 Low
- Air quality 2/10 Low 1 unhealthy d/yr today · 2 by 30 yrs out
Nearby sold comps map
Loading sold comps map…
Walkable amenities ~0.75 mi
Loading nearby amenities…
Taxation est. · year 1
- Rental income
- $11,299
- − Mortgage interest
- −$1,395
- − Property taxes
- −$927
- − Insurance
- −$791
- − Repairs & maintenance
- −$904
- − Management
- −$904
- − Depreciation
- −$724
- Taxable income
- $5,654
- Est. tax owed @ 24.0%
- −$1,357
- After-tax cash flow
- $4,285/yr
For passive investors: Depreciation is non-cash, so a rental often shows a tax loss while cash-flowing — sheltering income. Rental losses are passive: they offset passive income freely, and up to $25,000/yr can offset ordinary (W-2) income if you actively participate and your MAGI is under $100k (phasing out to $0 by $150k); unused losses carry forward. On sale, claimed depreciation is recaptured at up to 25%, and gains may owe capital-gains tax (a 1031 exchange can defer both). Figures are a year-1 estimate at your 24.0% rate — not tax advice; consult a CPA.
Schools (NCES district)
- District
- South Range Local
- NCES district ID
- 3904836
- Math proficiency
- 83% ▼ -6.00%
- Reading proficiency
- 84% ▼ -2.00%
- Median HH income
- $56,953
- Composite
- 71.23/100
- National rank
- #234
- State rank
- #39 of 656 in OH
Livability — Salem
- Score
- 68/100
- State rank
- #538
- US rank
- #9073
Category grades
Schools grade is shown separately in the Schools card above.
Census & demographics
- County
- Columbiana · 99,532 people
- City population
- 25,289
- Population (ZIP)
- 25,289
- Household income
- $59,882
- Rent vs Own
- Severe rent burden
- 9.0
Population outlook (Mahoning County) Hauer SSP2
- Today (2025)
- 223,932 people
- By 2030
- 218,387 · -2.5%
- By 2040
- 205,367 · -8.3%
- By 2050
- 193,606 · -13.5%
- By 2075
- 173,694 · -22.4%
- By 2100
- 151,147 · -32.5%
Race, ethnicity, and origin ACS 2023
- Neighborhood character
- Predominantly White (96%)
- Race & ethnicity
- White 96% Two or more races 2%
- Common ancestry
- Slovak 4% Lithuanian 3% Romanian 2%
- Foreign-born
- 1% · Canada
- Languages at home
- 98% English-only · Spanish 1%
Political lean MEDSL · Mahoning
- 2024 margin
- Lean R (+9.4) · D 44.9% · R 54.4%
- 2008→2024 swing
- -36.1pp toward R · 2008: 26.6pp · 2024: -9.4pp
- All cycles
- 2024: R+9.4 2020: R+1.9 2016: D+3.0 2012: D+27.7 2008: D+26.6
Not yet ingested
- Civics
- —
Market trends
- HPI YoY
- ▼ -102.42%
- Current HPI
- 212.8922
- Rent YoY
- —
- Metro
- —
- State GDP YoY
- ▲ 1.98%
- F500 in state
- 48
Industry mix (Fortune 500 HQ in OH)
| Industry | F500 HQs | Revenue |
|---|---|---|
| Insurance | 3 | $145B |
|
||
| Industrial Machinery | 3 | $49B |
|
||
| Financial Services | 3 | $24B |
|
||
| Consumer Goods | 2 | $93B |
|
||
| Aerospace / Defense | 2 | $47B |
|
||
| Utilities | 2 | $33B |
|
||
Price history
+149.0% since first listed23 events — show timeline
- 2026-04-22 Price Changed $24,900 MLSNOW
- 2026-04-01 Listed $29,000 MLSNOW
- 2024-05-30 Sold (MLS) $14,000 MLSNOW
- 2024-05-23 Pending — MLSNOW
- 2024-04-30 Contingent — MLSNOW
- 2024-04-19 Listed $14,900 MLSNOW
- 2024-02-11 Listing Removed — MLSNOW
- 2024-01-19 Listed $19,900 MLSNOW
- 2023-12-05 Listing Removed — MLSNOW
- 2023-09-07 Relisted — MLSNOW
- 2023-09-03 Listing Removed — MLSNOW
- 2023-08-25 Price Changed $19,900 MLSNOW
- 2023-07-18 Price Changed $21,900 MLSNOW
- 2023-06-05 Listed $25,000 MLSNOW
- 2005-03-31 Sold (Public Records) $42,900 Public Records
- 2005-03-30 Sold (MLS) $42,900 MLSNOW
- 2004-08-27 Listed $42,900 MLSNOW
- 2003-12-09 Sold (MLS) $8,500 MLSNOW
- 2003-10-28 Listing Removed — MLSNOW
- 2003-07-25 Listed $9,900 MLSNOW
- 2002-10-28 Listed $29,000 MLSNOW
- 1999-04-16 Sold (Public Records) $30,200 Public Records
- 1989-12-20 Sold (Public Records) $10,000 Public Records
Property tax history
+1.1%/yrLatest (2025): $927 · +1.8% YoY. Source: county tax records.
Cash-flow waterfall
monthlySold comps — $/sqft
last 12 mo · ≤1 miLoading sold comps…