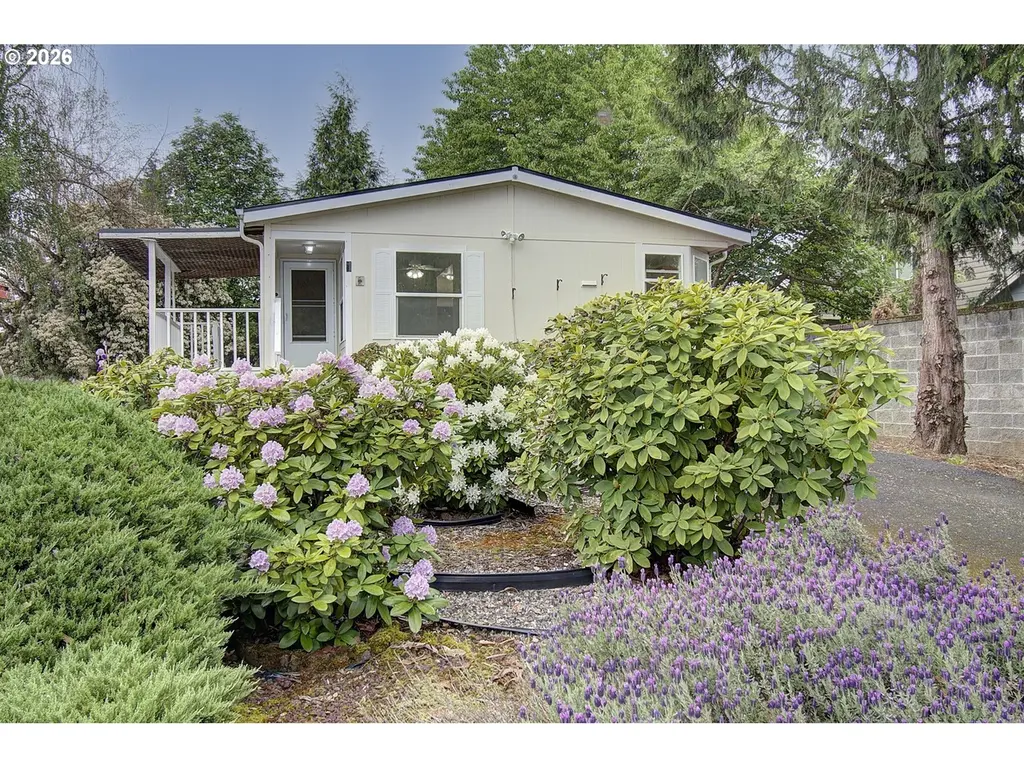
10400 NE 72nd Ave #1 · Barberton, WA
Flood risk No data
- FEMA flood zone
- —
- Chance of flooding over 30 yrs
- —
- Est. flood insurance / yr
- —
Fire risk No data
- Est. fire insurance / yr
- —
Heat risk No data
- Hot days now (above threshold)
- —
- Hot days in 30 yrs
- —
Wind risk No data
- Chance of severe wind over 30 yrs
- —
Air-quality risk No data
- Unhealthy air days now
- —
- Unhealthy air days in 30 yrs
- —
Risk factors via First Street. Map © Google.
Why this score? — see what drove the B grade
The composite is a weighted blend of 9 inputs, each scored 0–100. Each bar is that input's sub-score; the figure is the points it added to the 100-point composite (weight × sub-score).
- Cash flow +30.0/30.0
- 1% rule +10.0/10.0
- DSCR +10.0/10.0
- ARV discount +7.5/15.0
- Schools +5.0/10.0
- Livability +3.6/5.0
- Rent growth +2.7/5.0
- Condition / age +2.5/5.0
- Appreciation +0.0/10.0
$110,000
🖨 Deal sheet (PDF) 📄 Offer letter ✓ Due diligence
Listing remarks
Affordable and move-in ready with the big-ticket items already done! This 3-bedroom, 2-bath home in a peaceful 55+ park features 1,290 sq ft of comfortable living space with major updates completed in the last two years, including the roof, furnace, water heater, and flooring. Fresh interior paint and brand-new bedroom carpet give the home a bright, clean feel. Just bring your personal style and finishing touches to make this home truly shine!
Key facts
- Major updates
- Move in ready
- Fresh interior paint
Tags
Property features AI
Finance
- Other: Homesite #1 (GPS friendly)
- Financial info: Land lease monthly fee applies
- HOA & community: Located in Hillcrest Manor park; Senior community; Land lease in effect (rent charged monthly)
Exterior
- Parking: Driveway parking
- Utilities: Electric hot water; Electric fuel; Public water and shared well; Shared septic
- Home design: Manufactured home located in a park; Single-level/main living on one level; No notable view
- Construction: Built in 2000; Composition roof; Skirting foundation
- Exterior features: Lap siding and T-111 siding; Level lot; Paved road access
Interior
- Kitchen: Dishwasher; Kitchen with laminate flooring
- Bedrooms: Primary bedroom on the main level with private bathroom, bathtub and shower, closet; Second bedroom on the main level with closet and wall-to-wall carpet; Third bedroom on the main level with closet and wall-to-wall carpet
- Flooring: Laminate flooring; Wall-to-wall carpet
- Bathrooms: Two full bathrooms (both on the main level)
- Heating & cooling: Forced air heating; No central air
- Interior features: Laminate flooring in main living areas; Wall-to-wall carpet in bedrooms; Laundry area on the main level; Crawl space basement
- Laundry & utility: Main-level laundry
Neighborhood map
What this means for you Summary
Snapshot
- This is a 2-bed/2.0-bath manufactured listed at $110k.
Deal economics
- At list price, monthly cash flow is $967 ($12k/yr) — positive.
- The deal already cash-flows at list — no discount required.
- Meets the 1% rule at list price ($2k rent vs $110k).
- Recommended offer: $107k (3.0% below list) — sets the bar for market timing.
- Cap rate 16.8% vs local median 2.5% in Barberton — top-decile yield for the area; either an underpriced asset or a hidden risk that comps aren't pricing in. Stress-test before assuming the spread holds.
Location & tenants
- Location reads 72/100 on livability (#223 in WA) — a middle-class / working-renter tenant base. Strengths: employment A+, housing A+, crime A-; Watch: amenities F, commute F, cost of living F.
- Battle Ground School District (suburban): math 48% / reading 60% proficiency, ranked #92 of 291 in WA (top 32%) — acceptable for families but not a draw, mixed tenant base, ~2y average lease.
- Zoned schools: Pleasant Valley Primary (556 students, 42% FRL); Pleasant Valley Middle (396 students, 45% FRL); Prairie High School (1,603 students, 41% FRL).
- Market conditions: Rents flat; 332 active listings in the ZIP; 10 comparable units currently listed for rent nearby; rentals at typical pace (median 14d on market — plan ~3-4 weeks tenant-placement turnaround); solid renter incomes; 3,547 units permitted in Clark County in 2024 (1,361 in 5+ unit buildings).
Forward outlook
- Local home prices are declining (-3.0%/yr); year-one equity from $761 of loan paydown is wiped out by about $3k of value loss. Plan a longer hold.
- Clark County population projected at +29% by 2050 — long-run rental-demand tailwind backs the buy-and-hold thesis.
- At projected returns (-3.0% appreciation + 0.8% rent growth), your $31k cash investment doubles in ~4 years — after that, you're playing with house money.
Negotiation context
- It's been on market 44 days — a 3% lower offer ($107k) is reasonable based on typical stale-listing flexibility.
- 2 sale attempts since 29y ago; this cycle's ask has dropped $15k (12%) from the opening price — seller is motivated, your offer sets the floor, not the list.
- Current owner paid $7k; list at $110k implies a 1471% gain — meaningful room to come down on a strong offer.
Questions for the listing agent
- It's been on market 44 days. Have you received any prior offers? Is the seller open to a 3% concession, seller financing, or rate buy-down credit?
- Is there a deadline driving the sale (1031 exchange, divorce, estate, relocation)? That informs how much negotiation room exists.
- Schools are D-rated, which usually means shorter tenancies and higher turnover. Who's the typical renter profile here, and what's been the actual vacancy rate?
- What's the average days-on-market for RENTAL listings here right now (not sales)? A rising rental-DOM trend means longer vacancies and softer asking-rent achievability than the comps imply.
- What's the recent tenant-quality profile in this submarket — average credit score on applications, eviction rate, late-payment / NSF rate, and stable-employment percentage? A property-management company in the area should have these aggregated.
- How much new for-sale + rental construction is in the pipeline within 1–3 miles? Heavy new supply typically softens prices + rents 12–24 months out; constrained supply supports both.
Investment metrics
- 1% rule
- 1.88% ✓
- Cap rate
- 16.84%
- Cash-on-cash
- 37.66%
- DSCR
- 2.68
- GRM
- 4.4
CMA / ARV
- ARV (median comp)
- $283,739
- List price
- $110,000
- Delta
- -61.23%
- Verdict
- UNDERPRICED
- Comps
- 2 within 2.0 mi
Projected returns pro-forma
-3.0% appreciation · 0.78% rent growth · sell at horizon
- IRR
- 31.2%
- Equity multiple
- 2.27×
- Total profit
- $39,200
- Equity at exit
- $16,401
- IRR
- 37.2%
- Equity multiple
- 4.10×
- Total profit
- $95,596
- Equity at exit
- $9,511
Cash invested: $30,800 (down + closing). Projections, not guarantees.
Landlord ↔ Tenant lean methodology
- Overall (STATE)
- 28 Tenant-Leaning
- State Washington
- 28 Tenant-Leaning · D+8
- County
- — inherits STATE
- City
- — inherits STATE
ZIP-level market 98686
- Rents YoY
- 0.8%
- Active inventory
- 332
- Price-to-rent
- 4.4×
Monthly cashflow live
- Estimated rent
- $2,063 high interval (Pro) →
- Mortgage (P&I)
- −$577
- Tax from tax record
- −$40 /mo · $482/yr
- Insurance
- −$46
- HOA
- −$0
- Vacancy / Maint / Mgmt
- −$433
- Net cashflow
- $967
Break-even live
Sensitivity live
| Price | -10% $1,029 | -5% $998 | +0% $967 | +5% $935 | +10% $904 |
|---|---|---|---|---|---|
| Rent | -10% $804 | -5% $885 | +0% $967 | +5% $1,048 | +10% $1,129 |
| Rate | -1.0pp $1,022 | -0.5pp $995 | base $967 | +0.5pp $938 | +1.0pp $909 |
UW: 25.0% down · 7.5% · 30yr · 1.5% tax · 5.0% vac · 8.0% maint · 8.0% mgmt
Financing live
Cash to close
- Down payment
- $27,500
- Closing costs
- $3,300
- Reserves months
- —
- Total cash needed
- —
Loan-product check · same deal, 3 products live
Conventional
25% down · 7.5% · 30yr
- Down + closing
- —
- Monthly P&I
- —
- Monthly cashflow
- —
- DSCR
- —
- Eligible?
- —
Personal DTI + credit; lowest rate.
DSCR
20% down · 8.5% · 30yr
- Down + closing
- —
- Monthly P&I
- —
- Monthly cashflow
- —
- DSCR
- —
- Eligible?
- —
No personal income docs; deal must DSCR.
Hard money
10% down · 12.0% · 12mo
- Down + closing
- —
- Monthly P&I
- —
- Monthly cashflow
- —
- DSCR
- —
- Eligible?
- —
Short-term bridge; refi at stabilization.
Rent comps 10 comps
| Address | Beds | Baths | Sqft | Rent | $/sqft | DOM | Units | Dist |
|---|---|---|---|---|---|---|---|---|
| 7101 NE 109th St Vancouver, WA | 1.0–2.0 | 1.0–2.0 | 784 | $1,900 | $2.42 | 9d | 6 | 0.25mi |
| 7105 NE 123rd St Vancouver, WA | 1.0–2.0 | 1.0–2.0 | 859 | $1,875 | $2.18 | 14d | 3 | 0.97mi |
| 10601 NE 45th Ave Vancouver, WA | 3.0 | 2.0 | 1409 | $2,750 | $1.95 | 45d | 1 | 1.09mi |
| 7011 NE 126th St Vancouver, WA | 1.0–3.0 | 1.0–2.0 | 905 | $2,235 | $2.47 | 25d | 23 | 1.14mi |
| 6914 NE 126th St Vancouver, WA | 1.0–3.0 | 1.0–2.0 | 910 | $2,168 | $2.38 | 0d | 78 | 1.21mi |
| 7700 NE 72nd Ave Vancouver, WA | 1.0–2.0 | 1.0–2.0 | 978 | $3,190 | $3.26 | 0d | 7 | 1.25mi |
| 8515 NE Saint Johns Rd Unit A09 Vancouver, WA | 1.0 | 1.0 | 801 | $1,495 | $1.87 | 25d | 1 | 1.36mi |
| 8515 NE Saint Johns Rd Unit B22 Vancouver, WA | 1.0 | 1.0 | 801 | $1,495 | $1.87 | 45d | 1 | 1.36mi |
| 8515 NE Saint Johns Rd Unit B29 Vancouver, WA | 1.0 | 1.0 | 801 | $1,495 | $1.87 | 4d | 1 | 1.36mi |
| 6901 NE 131st Way Vancouver, WA | 2.0–3.0 | 2.0 | 1155 | $1,749 | $1.51 | 0d | 5 | 1.44mi |
Listing history 16 events
-
2026-06-21days on market $110,000 Active 44 DOM
-
2026-06-18days on market $110,000 Active 41 DOM
-
2026-06-17days on market $110,000 Active 40 DOM
-
2026-06-16days on market $110,000 Active 39 DOM
-
2026-06-15days on market $110,000 Active 38 DOM
-
2026-06-13days on market $110,000 Active 36 DOM
-
2026-06-09days on market $110,000 Active 32 DOM
-
2026-06-08days on market $110,000 Active 31 DOM
-
2026-06-07days on market $110,000 Active 30 DOM
-
2026-06-03days on market $110,000 Active 26 DOM
-
2026-06-02days on market $110,000 Active 25 DOM
-
2026-06-01days on market $110,000 Active 24 DOM
-
2026-05-31days on market $110,000 Active 23 DOM
-
2026-05-08$125,000 Active 447-char remark
-
1998-04-17soldstatus $7,000
-
1997-04-08$14,900
ⓘ Source: listings_history table (triggers on properties + properties_extension) + one-shot
backfill from property_details.listing_events for pre-trigger history.
Tax reassessment forecast WA · Resets to sale price
- Current annual tax
- $482 · $40/mo
- Projected year-2 tax
- $1,078 · $90/mo
- Expected delta
- +$596/yr (+$50/mo · 123.7%)
ⓘ Screening estimate from a state-policy table — verify with the county assessor before closing.
Nearby sold comps map
Loading sold comps map…
Walkable amenities ~0.75 mi
Loading nearby amenities…
Taxation est. · year 1
- Rental income
- $24,750
- − Mortgage interest
- −$6,162
- − Property taxes
- −$482
- − Insurance
- −$550
- − Repairs & maintenance
- −$1,980
- − Management
- −$1,980
- − Depreciation
- −$3,200
- Taxable income
- $10,397
- Est. tax owed @ 24.0%
- −$2,495
- After-tax cash flow
- $9,103/yr
For passive investors: Depreciation is non-cash, so a rental often shows a tax loss while cash-flowing — sheltering income. Rental losses are passive: they offset passive income freely, and up to $25,000/yr can offset ordinary (W-2) income if you actively participate and your MAGI is under $100k (phasing out to $0 by $150k); unused losses carry forward. On sale, claimed depreciation is recaptured at up to 25%, and gains may owe capital-gains tax (a 1031 exchange can defer both). Figures are a year-1 estimate at your 24.0% rate — not tax advice; consult a CPA.
Schools (NCES district)
- District
- Battle Ground School District
- NCES district ID
- 5300380
- Math proficiency
- 48% ▼ -1.00%
- Reading proficiency
- 60% ▼ -1.00%
- Median HH income
- $69,646
- Composite
- 49.81/100
- National rank
- #4201
- State rank
- #92 of 291 in WA
Livability — Barberton
- Score
- 72/100
- State rank
- #223
- US rank
- #6415
Category grades
Schools grade is shown separately in the Schools card above.
Census & demographics
- Census place
- Barberton, WA
- County
- Clark County · 513,189 people
- City population
- 20,553
- Metro
- Portland-Vancouver-Hillsboro, OR-WA
- Population (ZIP)
- 21,243
- Household income
- $107,801
- Rent vs Own
- Severe rent burden
- 364.0
Population outlook (Clark County) Hauer SSP2
- Today (2025)
- 529,610 people
- By 2030
- 563,242 · +6.4%
- By 2040
- 625,905 · +18.2%
- By 2050
- 681,558 · +28.7%
- By 2075
- 805,967 · +52.2%
- By 2100
- 877,450 · +65.7%
Race, ethnicity, and origin ACS 2023
- Neighborhood character
- Predominantly White (74%)
- Race & ethnicity
- White 74% Two or more races 10% Hispanic / Latino 9% Asian 6% Black 2%
- Hispanic origin (detail)
- Mexican 6%
- Common ancestry
- Portuguese 6% Slovak 4% Lithuanian 4%
- Foreign-born
- 10% · Canada, Vietnam, South Korea
- Languages at home
- 87% English-only · Spanish 4% Russian/Polish/Slavic 2% Other Indo-European 1%
Political lean MEDSL · Clark
- 2024 margin
- Lean D (+7.0) · D 52.1% · R 45.1% · Other 2.8%
- 2008→2024 swing
- +0.9pp no change · 2008: 6.1pp · 2024: 7.0pp
- All cycles
- 2024: D+7.0 2020: D+5.1 2016: D+0.1 2012: D+0.1 2008: D+6.1
Not yet ingested
- Civics
- —
Market trends
- HPI YoY
- ▼ -274.58%
- Current HPI
- 286.8751
- Rent YoY
- ▲ 0.78%
- Metro
- Portland-Vancouver-Hillsboro, OR-WA
- State GDP YoY
- ▲ 4.65%
- F500 in state
- 22
Industry mix (Fortune 500 HQ in WA)
| Industry | F500 HQs | Revenue |
|---|---|---|
| Retail | 2 | $269B |
|
||
| Technology / Retail | 1 | $638B |
|
||
| Technology | 1 | $245B |
|
||
| Telecommunications | 1 | $38B |
|
||
| Food / Beverage | 1 | $36B |
|
||
| Automotive / Trucks | 1 | $34B |
|
||
Price history
+638.3% since first listed4 events — show timeline
- 2026-05-29 Price Changed $110,000 RMLS
- 2026-05-08 Listed $125,000 RMLS
- 1998-04-17 Sold (MLS) $7,000 RMLS
- 1997-04-08 Listed $14,900 RMLS
Property tax history
-0.2%/yrLatest (2026): $482 · +9.6% YoY. Source: county tax records.
Cash-flow waterfall
monthlySold comps — $/sqft
last 12 mo · ≤1 miLoading sold comps…