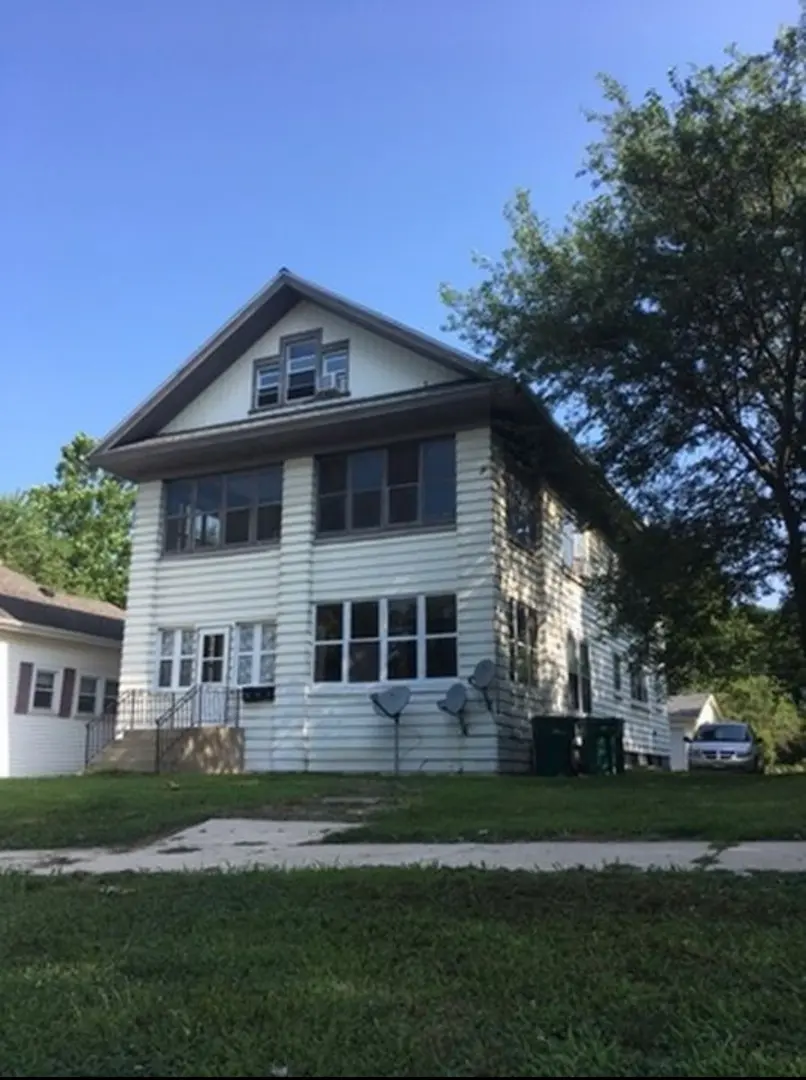
220 7th St · Streator, IL
Flood risk 1/10 · Minimal
- FEMA flood zone
- X (unshaded)
- Chance of flooding over 30 yrs
- 0.0%
- Est. flood insurance / yr
- $473 – $860
Fire risk 1/10 · Minimal
- Est. fire insurance / yr
- $804 – $1,492
Heat risk 3/10 · Minor
- Hot days now (above 104°F)
- 7 days/yr
- Hot days in 30 yrs
- 17 days/yr
Wind risk 2/10 · Minimal
- Chance of severe wind over 30 yrs
- 1.0%
Air-quality risk 2/10 · Minimal
- Unhealthy air days now
- 1 days/yr
- Unhealthy air days in 30 yrs
- 1 days/yr
Risk factors via First Street. Map © Google.
Why this score? — see what drove the C grade
The composite is a weighted blend of 9 inputs, each scored 0–100. Each bar is that input's sub-score; the figure is the points it added to the 100-point composite (weight × sub-score).
- Cash flow +19.1/30.0
- ARV discount +15.0/15.0
- 1% rule +6.6/10.0
- DSCR +6.0/10.0
- Livability +3.2/5.0
- Rent growth +2.5/5.0
- Condition / age +2.5/5.0
- Schools +1.3/10.0
- Appreciation +0.0/10.0
$145,000
🖨 Deal sheet (PDF) 📄 Offer letter ✓ Due diligence
Listing remarks
Great investment opportunity in the heart of Streator! This 3-unit residential property offers strong income potential at an attractive price point. The building features a spacious 3-bedroom, 1-bath unit, a 2-bedroom, 1-bath unit, and a 1-bedroom, 1-bath unit-providing flexibility for investors or owner-occupants alike. Whether you're looking to expand your portfolio or start investing in multi-unit properties, this is a fantastic opportunity with plenty of upside potential. Conveniently located near local shopping, dining, parks, and major roadways. Don't miss your chance to own an income-producing property in a growing community! Seller is related to Listing Agent
Key facts
- Spacious unit
- Conveniently located
- 7,000 sq ft lot
Tags
Neighborhood map
What this means for you Summary
Snapshot
- This is a 6-bed/3.0-bath single-family listed at $145k.
Deal economics
- At list price, monthly cash flow is $153 ($2k/yr) — positive.
- The deal already cash-flows at list — no discount required.
- Meets the 1% rule at list price ($2k rent vs $145k).
- Recommended offer: $141k (3.0% below list) — sets the bar for market timing.
Location & tenants
- Location reads 63/100 on livability (#752 in IL) — a middle-class / working-renter tenant base. Strengths: cost of living A+, health & safety A+, housing B+; Watch: amenities F, commute F, employment F.
- Streator Twp Hsd 40 (town): math 11% / reading 19% proficiency, ranked #513 of 620 in IL (top 83%) — low school quality limits family demand, transient renter base, plan for 1-2y turnover.
- Zoned schools: Streator Twp High School (math 11% / reading 19%, grade F, #462 of 693 statewide, top 68%, 809 students, 0% FRL).
- Market conditions: 87 active listings in the ZIP; 82 units permitted in LaSalle County in 2024 (0 in 5+ unit buildings).
- This rent runs 34% of the median local income ($59k/yr) — at the standard rent-burdened threshold; future hikes will face affordability resistance.
Forward outlook
- Local home prices are declining (-3.0%/yr); year-one equity from $1k of loan paydown is wiped out by about $4k of value loss. Plan a longer hold.
- LaSalle County population projected at -16% by 2050 — secular population decline; favor cash flow + early exit over multi-decade hold.
Negotiation context
- It's been on market 35 days — a 3% lower offer ($141k) is reasonable based on typical stale-listing flexibility.
- 2 sale attempts since 7y ago; this cycle's ask has dropped $10k (6%) from the opening price — seller is motivated, your offer sets the floor, not the list.
- Current owner paid $55k; list at $145k implies a 164% gain — meaningful room to come down on a strong offer.
Risks & watch-outs
- Watch-outs: property tax is 2.9% of price; built in 1900 — expect roof / HVAC / electrical / plumbing capex.
Questions for the listing agent
- It's been on market 35 days. Have you received any prior offers? Is the seller open to a 3% concession, seller financing, or rate buy-down credit?
- Built in 1900 — when were the roof, HVAC, electrical panel, plumbing, and water heater last replaced?
- Property tax is high relative to price — has the assessment been appealed recently, and will the sale trigger a re-assessment?
- Is there a deadline driving the sale (1031 exchange, divorce, estate, relocation)? That informs how much negotiation room exists.
- Schools are F-rated, which usually means shorter tenancies and higher turnover. Who's the typical renter profile here, and what's been the actual vacancy rate?
- What's the average days-on-market for RENTAL listings here right now (not sales)? A rising rental-DOM trend means longer vacancies and softer asking-rent achievability than the comps imply.
- What's the recent tenant-quality profile in this submarket — average credit score on applications, eviction rate, late-payment / NSF rate, and stable-employment percentage? A property-management company in the area should have these aggregated.
- How much new for-sale + rental construction is in the pipeline within 1–3 miles? Heavy new supply typically softens prices + rents 12–24 months out; constrained supply supports both.
Investment metrics
- 1% rule
- 1.16% ✓
- Cap rate
- 7.56%
- Cash-on-cash
- 4.52%
- DSCR
- 1.20
- GRM
- 7.2
CMA / ARV
- ARV (on-the-fly)
- $187,264
- Comps found
- 1
Show comp detail 1 sale within ~0.75 mi
| Address | Dist | Beds/Ba | Sqft | Sold | Price | $/sf | Match |
|---|---|---|---|---|---|---|---|
| 122 W 10th St | 0.26mi | 5/2.0 (-1) | 2,556 (+4%) | 14mo | $195,000 | $76 | 61 |
Match score weights: distance 35% · size 25% · config 20% · recency 20%. Top-matched comps best support the ARV.
Projected returns pro-forma
-3.0% appreciation · 3.0% rent growth · sell at horizon
- IRR
- -9.2%
- Equity multiple
- 0.66×
- Total profit
- $-13,635
- Equity at exit
- $21,620
- IRR
- 0.4%
- Equity multiple
- 1.03×
- Total profit
- $1,185
- Equity at exit
- $12,537
Cash invested: $40,600 (down + closing). Projections, not guarantees.
Landlord ↔ Tenant lean methodology
- Overall (STATE)
- 43 Moderately Tenant-Leaning
- State Illinois
- 43 Moderately Tenant-Leaning · D+7
- County
- — inherits STATE
- City
- — inherits STATE
ZIP-level market 61364
- Home prices YoY
- -31.1%
- Active inventory
- 87
- Price-to-rent
- 7.2×
Monthly cashflow live
- Estimated rent
- $1,676 medium interval (Pro) →
- Mortgage (P&I)
- −$760
- Tax from tax record
- −$351 /mo · $4,208/yr
- Insurance
- −$60
- HOA
- −$0
- Vacancy / Maint / Mgmt
- −$352
- Net cashflow
- $153
Break-even live
Sensitivity live
| Price | -10% $235 | -5% $194 | +0% $153 | +5% $112 | +10% $71 |
|---|---|---|---|---|---|
| Rent | -10% $20 | -5% $87 | +0% $153 | +5% $219 | +10% $285 |
| Rate | -1.0pp $226 | -0.5pp $190 | base $153 | +0.5pp $115 | +1.0pp $77 |
UW: 25.0% down · 7.5% · 30yr · 1.5% tax · 5.0% vac · 8.0% maint · 8.0% mgmt
Financing live
Cash to close
- Down payment
- $36,250
- Closing costs
- $4,350
- Reserves months
- —
- Total cash needed
- —
Loan-product check · same deal, 3 products live
Conventional
25% down · 7.5% · 30yr
- Down + closing
- —
- Monthly P&I
- —
- Monthly cashflow
- —
- DSCR
- —
- Eligible?
- —
Personal DTI + credit; lowest rate.
DSCR
20% down · 8.5% · 30yr
- Down + closing
- —
- Monthly P&I
- —
- Monthly cashflow
- —
- DSCR
- —
- Eligible?
- —
No personal income docs; deal must DSCR.
Hard money
10% down · 12.0% · 12mo
- Down + closing
- —
- Monthly P&I
- —
- Monthly cashflow
- —
- DSCR
- —
- Eligible?
- —
Short-term bridge; refi at stabilization.
Listing history 24 events
-
2026-06-19days on market $145,000 Active 35 DOM
-
2026-06-18days on market $145,000 Active 34 DOM
-
2026-06-18price $145,000 Active 33 DOM
-
2026-06-17days on market $155,000 Active 33 DOM
-
2026-06-16days on market $155,000 Active 32 DOM
-
2026-06-15days on market $155,000 Active 31 DOM
-
2026-06-14days on market $155,000 Active 29 DOM
-
2026-06-12days on market $155,000 Active 28 DOM
-
2026-06-09days on market $155,000 Active 25 DOM
-
2026-06-08days on market $155,000 Active 24 DOM
-
2026-06-07days on market $155,000 Active 23 DOM
-
2026-06-05days on market $155,000 Active 20 DOM
-
2026-06-03days on market $155,000 Active 19 DOM
-
2026-06-02days on market $155,000 Active 18 DOM
-
2026-06-01days on market $155,000 Active 17 DOM
-
2026-05-31days on market $155,000 Active 16 DOM
-
2026-05-30days on market $155,000 Active 15 DOM
-
2026-05-13$155,000 Active
-
2019-09-01historical
-
2019-07-25New
-
2009-03-18soldstatus $55,000
-
2006-03-15soldstatus $60,000
-
1997-09-25soldstatus $45,000
-
1997-09-25soldstatus $45,000
ⓘ Source: listings_history table (triggers on properties + properties_extension) + one-shot
backfill from property_details.listing_events for pre-trigger history.
Tax reassessment forecast IL · Partial reset (capped growth)
- Current annual tax
- $4,208 · $351/mo
- Projected year-2 tax
- $4,208 · $351/mo
- Expected delta
- $0/yr ($0/mo · 0.0%)
ⓘ Screening estimate from a state-policy table — verify with the county assessor before closing.
Climate risk First Street
- Flood 1/10 Low FEMA zone X (unshaded) · 0% chance over 30 yrs
- Wildfire 1/10 Low
- Heat 3/10 Moderate 7 d/yr ≥104°F today · 17 d/yr by 30 yrs out
- Wind 2/10 Low 100% chance of damaging wind over 30 yrs
- Air quality 2/10 Low 1 unhealthy d/yr today · 1 by 30 yrs out
Nearby sold comps map
Loading sold comps map…
Walkable amenities ~0.75 mi
Loading nearby amenities…
Taxation est. · year 1
- Rental income
- $20,116
- − Mortgage interest
- −$8,122
- − Property taxes
- −$4,208
- − Insurance
- −$725
- − Repairs & maintenance
- −$1,609
- − Management
- −$1,609
- − Depreciation
- −$4,218
- Taxable loss
- −$376
- Est. tax savings @ 24.0%
- +$90
- After-tax cash flow
- $1,924/yr
For passive investors: Depreciation is non-cash, so a rental often shows a tax loss while cash-flowing — sheltering income. Rental losses are passive: they offset passive income freely, and up to $25,000/yr can offset ordinary (W-2) income if you actively participate and your MAGI is under $100k (phasing out to $0 by $150k); unused losses carry forward. On sale, claimed depreciation is recaptured at up to 25%, and gains may owe capital-gains tax (a 1031 exchange can defer both). Figures are a year-1 estimate at your 24.0% rate — not tax advice; consult a CPA.
Schools (NCES district)
- District
- Streator Twp Hsd 40
- NCES district ID
- 1738100
- Math proficiency
- 11% ▼ -4.00%
- Reading proficiency
- 19% ▼ -1.00%
- Median HH income
- $43,002
- Composite
- 13.07/100
- National rank
- #9561
- State rank
- #513 of 620 in IL
Livability — Streator
- Score
- 63/100
- State rank
- #752
- US rank
- #15266
Category grades
Schools grade is shown separately in the Schools card above.
Census & demographics
- Census place
- Streator, IL
- County
- La Salle County · 41,676 people
- City population
- 17,963
- Metro
- Ottawa, IL
- Population (ZIP)
- 17,963
- Household income
- $59,060
- Rent vs Own
- Severe rent burden
- 450.0
Population outlook (LaSalle County) Hauer SSP2
- Today (2025)
- 107,080 people
- By 2030
- 104,196 · -2.7%
- By 2040
- 97,413 · -9.0%
- By 2050
- 90,294 · -15.7%
- By 2075
- 76,252 · -28.8%
- By 2100
- 61,339 · -42.7%
Race, ethnicity, and origin ACS 2023
- Neighborhood character
- Predominantly White (83%)
- Race & ethnicity
- White 83% Hispanic / Latino 11% Two or more races 4% Black 3%
- Hispanic origin (detail)
- Mexican 10%
- Common ancestry
- Romanian 3% Lithuanian 2% Slovak 2%
- Foreign-born
- 3% · Canada
- Languages at home
- 93% English-only · Spanish 6%
Political lean MEDSL · LaSalle
- 2024 margin
- R (+18.5) · D 40.1% · R 58.6% · Other 1.3%
- 2008→2024 swing
- -29.6pp toward R · 2008: 11.1pp · 2024: -18.5pp
- All cycles
- 2024: R+18.5 2020: R+14.3 2016: R+14.4 2012: R+0.4 2008: D+11.1
Not yet ingested
- Civics
- —
Market trends
- HPI YoY
- ▼ -105.28%
- Current HPI
- 233.5533
- Rent YoY
- —
- Metro
- Ottawa, IL
- State GDP YoY
- ▲ 1.59%
- F500 in state
- 60
Industry mix (Fortune 500 HQ in IL)
| Industry | F500 HQs | Revenue |
|---|---|---|
| Insurance | 4 | $201B |
|
||
| Consumer Goods | 4 | $87B |
|
||
| Industrial Machinery | 3 | $64B |
|
||
| Healthcare | 2 | $55B |
|
||
| Retail / Pharmacy | 1 | $148B |
|
||
| Agriculture / Food | 1 | $86B |
|
||
Price history
+244.4% since first listed7 events — show timeline
- 2026-05-13 Listed $155,000 MRED as Distributed by MLS Grid
- 2019-09-01 Listing Removed — MRED as Distributed by MLS Grid
- 2019-07-25 Listed — MRED as Distributed by MLS Grid
- 2009-03-18 Sold (Public Records) $55,000 Public Records
- 2006-03-15 Sold (Public Records) $60,000 Public Records
- 1997-09-25 Sold (Public Records) $45,000 Public Records
- 1997-09-25 Sold (Public Records) $45,000 Public Records
Property tax history
+4.9%/yrLatest (2024): $4,208 · +37.9% YoY. Source: county tax records.
Cash-flow waterfall
monthlySold comps — $/sqft
last 12 mo · ≤1 miLoading sold comps…