1505 Ward Rd Unit C121 · Baytown, TX
Flood risk 4/10 · Minor
- FEMA flood zone
- X (unshaded)
- Chance of flooding over 30 yrs
- 0.23%
- Est. flood insurance / yr
- $507 – $1,088
Fire risk 3/10 · Minor
- Est. fire insurance / yr
- $1,222 – $2,270
Heat risk 9/10 · Severe
- Hot days now (above 110°F)
- 7 days/yr
- Hot days in 30 yrs
- 25 days/yr
Wind risk 9/10 · Severe
- Chance of severe wind over 30 yrs
- 99.0%
Air-quality risk 2/10 · Minimal
- Unhealthy air days now
- 1 days/yr
- Unhealthy air days in 30 yrs
- 1 days/yr
Risk factors via First Street. Map © Google.
Why this score? — see what drove the D+ grade
The composite is a weighted blend of 9 inputs, each scored 0–100. Each bar is that input's sub-score; the figure is the points it added to the 100-point composite (weight × sub-score).
- Cash flow +13.9/30.0
- 1% rule +10.0/10.0
- ARV discount +9.6/15.0
- DSCR +4.2/10.0
- Livability +3.5/5.0
- Schools +3.2/10.0
- Rent growth +2.8/5.0
- Condition / age +2.2/5.0
- Appreciation +0.0/10.0
$68,000
🖨 Deal sheet 📄 Offer letter ✓ Due diligence
Listing remarks
This is a downstairs condominium in Walnut Ridge. It is a 2 bedroom 2 bath unit. The living room has a corner fireplace. The electric range, refrigerator, washer & dryer are included. There is a community pool & a BBQ area to enjoy. This could be a good home for a first-time homebuyer, college student of someone wanting to downsize. This unit comes with 2 assigned parking spaces (1 covered parking & 1 uncovered). Guest parking is also available. Short drive to Hwy 99.
Key facts
- Guest parking
- Community pool
- Bbq area
Tags
Property features AI
Finance
- HOA & community: Walnut Ridge community; Community pool; Curbs; Monthly association fee of $430 covering grounds and structure maintenance, recreation facilities, water and sewer
Exterior
- Parking: Has carport (1 space); Detached carport; Additional assigned parking
- Utilities: Public water; Public sewer
- Home design: Residential property; Single-story; Faces south; Entry level: First floor
- Construction: Built in 1971; Brick and wood siding exterior; Composition roof; Slab foundation
- Exterior features: Partial fencing; Concrete road access; Private in-ground pool (association); Fence
Interior
- Kitchen: Electric oven / electric range; Free-standing range; Oven; Refrigerator; Breakfast bar
- Bedrooms: Primary bedroom on first floor (13 x 11); Additional bedroom on first floor (13 x 11); Total rooms: 5
- Flooring: Carpet; Vinyl
- Bathrooms: 2 full bathrooms
- Heating & cooling: Central heating (electric); Central air conditioning (electric)
- Interior features: Breakfast bar; Kitchen and family room combo; Window treatments / coverings; Ceiling fan(s); Combined living and dining area; Wood-burning fireplace (1)
- Laundry & utility: Washer and dryer included; Electric dryer hookup
Neighborhood map
What this means for you Summary
Snapshot
- This is a 2-bed/2.0-bath condo listed at $68k. Condition is rated fair.
Deal economics
- At list price, monthly cash flow is $8 ($96/yr) — positive.
- The deal already cash-flows at list — no discount required.
- Meets the 1% rule at list price ($1k rent vs $68k).
- Recommended offer: $66k (3.0% below list) — sets the bar for market timing.
- Cap rate 6.4% vs local median 4.2% in Baytown — top-decile yield for the area; either an underpriced asset or a hidden risk that comps aren't pricing in. Stress-test before assuming the spread holds.
Location & tenants
- Location reads 69/100 on livability (#412 in TX) — a middle-class / working-renter tenant base. Strengths: cost of living A+, housing A+; Watch: employment D+, crime F, amenities F.
- Goose Creek CISD (urban): math 37% / reading 36% proficiency, ranked #473 of 826 in TX (top 57%) — families likely to look elsewhere, expect single-tenant / working-renter base with shorter leases; 61% free/reduced lunch — lower-income household profile, screen leases tightly.
- Zoned schools: Cedar Bayou J H (math 46% / reading 32%, grade F, #690 of 1,662 statewide, top 42%, 969 students, 81% FRL); High Point School (12 students, 75% FRL) — zoned schools average 78% FRL vs 61% district-wide (17 pts higher); higher-poverty schools than district average — tighter screening recommended.
- Market conditions: Rents rising (+1.3%/yr); 271 active listings in the ZIP; 25 comparable units currently listed for rent nearby; rentals lingering (median 44d on market — plan ~5-8 weeks vacancy on turnover, expect pricing pressure); 56% of comp listings sitting > 30 days — soft ceiling on asking rent; 29,883 units permitted in Harris County in 2024 (8,621 in 5+ unit buildings).
Forward outlook
- Local home prices are declining (-3.0%/yr); year-one equity from $470 of loan paydown is wiped out by about $2k of value loss. Plan a longer hold.
- Harris County population projected at +47% by 2050 — long-run rental-demand tailwind backs the buy-and-hold thesis.
Negotiation context
- It's been on market 52 days — a 3% lower offer ($66k) is reasonable based on typical stale-listing flexibility.
Risks & watch-outs
- Watch-outs: HOA is 37% of rent.
- Climate carrying-cost: severe wind risk, 99% chance of damaging wind over 30y; extreme-heat days projected 7→25/yr by 2055 (HVAC capex compounding) — expect insurance premiums to compound above CPI over the hold.
Questions for the listing agent
- It's been on market 52 days. Have you received any prior offers? Is the seller open to a 3% concession, seller financing, or rate buy-down credit?
- Have any recent inspections been done? Can we get a copy of the seller's disclosures and any deferred-maintenance estimates?
- Built in 1971 — when were the roof, HVAC, electrical panel, plumbing, and water heater last replaced?
- What does the HOA fee cover, when was the last increase, and are there any pending special assessments or reserve-fund shortfalls?
- Any open or pending special assessments — roof, HVAC, plumbing, elevator, façade? What's the per-unit balance and payoff schedule, and is the seller paying it off at close or rolling it to the buyer?
- Is there a deadline driving the sale (1031 exchange, divorce, estate, relocation)? That informs how much negotiation room exists.
- Schools are D-rated, which usually means shorter tenancies and higher turnover. Who's the typical renter profile here, and what's been the actual vacancy rate?
- Crime grade is F in this area — have there been break-ins, vandalism, or insurance claims at this property in the last 3 years? What carrier currently insures it and at what premium?
- The area grade is low — what's the realistic commute time and amenity access for the typical tenant pool here? Any planned neighborhood developments (good or bad) we should know about?
- What's the average days-on-market for RENTAL listings here right now (not sales)? A rising rental-DOM trend means longer vacancies and softer asking-rent achievability than the comps imply.
- What's the recent tenant-quality profile in this submarket — average credit score on applications, eviction rate, late-payment / NSF rate, and stable-employment percentage? A property-management company in the area should have these aggregated.
- How much new apartment / multifamily construction is in the pipeline within 1–3 miles? Heavy new supply (>2% of stock underway) typically softens rents 12–24 months out; light construction supports rent growth.
Investment metrics
- 1% rule
- 1.69% ✓
- Cap rate
- 6.43%
- Cash-on-cash
- 0.50%
- DSCR
- 1.02
- GRM
- 4.9
CMA / ARV
- ARV (median comp)
- $71,367
- List price
- $68,000
- Delta
- -4.72%
- Verdict
- FAIR
- Comps
- 20 within 1.0 mi
Projected returns pro-forma
-3.0% appreciation · 1.3% rent growth · sell at horizon
- IRR
- -18.7%
- Equity multiple
- 0.36×
- Total profit
- $-12,163
- Equity at exit
- $10,139
- IRR
- -18.4%
- Equity multiple
- 0.14×
- Total profit
- $-16,460
- Equity at exit
- $5,879
Cash invested: $19,040 (down + closing). Projections, not guarantees.
Landlord ↔ Tenant lean methodology
- Overall (STATE)
- 87 Strongly Landlord-Friendly
- State Texas
- 87 Strongly Landlord-Friendly · R+5
- County
- — inherits STATE
- City
- — inherits STATE
ZIP-level market 77520
- Rents YoY
- 1.3%
- Active inventory
- 271
- Price-to-rent
- 4.9×
Monthly cashflow live
- Estimated rent
- $1,149 high interval (Pro) →
- Mortgage (P&I)
- −$357
- Tax est. 1.5%
- −$85 /mo · $1,020/yr
- Insurance
- −$28
- HOA
- −$430
- Vacancy / Maint / Mgmt
- −$241
- Net cashflow
- $8
Break-even live
UW: 25.0% down · 7.5% · 30yr · 1.5% tax · 5.0% vac · 8.0% maint · 8.0% mgmt
Financing live
Cash to close
- Down payment
- $17,000
- Closing costs
- $2,040
- Reserves months
- —
- Total cash needed
- —
Loan-product check · same deal, 3 products live
Conventional
25% down · 7.5% · 30yr
- Down + closing
- —
- Monthly P&I
- —
- Monthly cashflow
- —
- DSCR
- —
- Eligible?
- —
Personal DTI + credit; lowest rate.
DSCR
20% down · 8.5% · 30yr
- Down + closing
- —
- Monthly P&I
- —
- Monthly cashflow
- —
- DSCR
- —
- Eligible?
- —
No personal income docs; deal must DSCR.
Hard money
10% down · 12.0% · 12mo
- Down + closing
- —
- Monthly P&I
- —
- Monthly cashflow
- —
- DSCR
- —
- Eligible?
- —
Short-term bridge; refi at stabilization.
Rent comps 25 comps
| Address | Beds | Baths | Sqft | Rent | $/sqft | DOM | Units | Dist |
|---|---|---|---|---|---|---|---|---|
| 2300 Taft Cir Baytown, TX | 1.0–3.0 | 1.0–2.0 | 1070 | $878 | $0.82 | 1d | 19 | 0.42mi |
| 1717 James Bowie Dr Baytown, TX | 2.0 | 2.0 | 950 | $1,200 | $1.26 | 43d | 1 | 0.61mi |
| 1507 Barcelona Way Baytown, TX | 2.0 | 2.0 | 1070 | $1,075 | $1.00 | 43d | 1 | 0.65mi |
| 1502 Beaumont Rd Baytown, TX | 2.0 | 1.0 | 1010 | $1,000 | $0.99 | 43d | 1 | 0.65mi |
| 1510 Beaumont Rd Baytown, TX | 2.0 | 1.0 | 1010 | $1,100 | $1.09 | 43d | 1 | 0.67mi |
| 1512 Beaumont Rd Baytown, TX | 3.0 | 2.0 | 1112 | $1,200 | $1.08 | 43d | 1 | 0.68mi |
| 1525 Barcelona Way Baytown, TX | 3.0 | 2.0 | 1112 | $1,250 | $1.12 | 24d | 1 | 0.69mi |
| 2500 E James Ave Baytown, TX | 2.0–3.0 | 1.0–2.0 | 1093 | $1,030 | $0.94 | 1d | 18 | 0.70mi |
| 2399 James Bowie Dr Unit APG Baytown, TX | 2.0 | 1.0 | 950 | $1,275 | $1.34 | 24d | 1 | 0.81mi |
| 2399 James Bowie Dr Baytown, TX | 2.0 | 1.0 | 950 | $1,275 | $1.34 | 18d | 1 | 0.81mi |
| 2104 James Bowie Dr Baytown, TX | 2.0 | 1.0 | 997 | $1,350 | $1.35 | 43d | 1 | 0.82mi |
| 2111 Cedar Bayou Rd Baytown, TX | 1.0 | 1.0 | 684 | $950 | $1.39 | 43d | 1 | 0.86mi |
| 2 Rodney Ln Baytown, TX | 2.0–3.0 | 1.0–1.5 | 1025 | $1,249 | $1.22 | 1d | 6 | 0.88mi |
| 2700 Ward Rd Baytown, TX | 1.0–2.0 | 1.0 | 683 | $955 | $1.40 | 17d | 8 | 0.94mi |
| 2700 Ward Rd Baytown, TX | 1.0–3.0 | 1.0–2.0 | 822 | $1,060 | $1.29 | 1d | 32 | 0.94mi |
| 2706 Ward Rd Baytown, TX | 3.0 | 2.0 | 1059 | $1,200 | $1.13 | 43d | 1 | 0.94mi |
| 301 Tri City Beach Rd Baytown, TX | 1.0–2.0 | 1.0 | 792 | $1,350 | $1.70 | 43d | 1 | 1.03mi |
| 105 E Adoue St Baytown, TX | 3.0 | 1.0 | 1040 | $1,200 | $1.15 | 43d | 1 | 1.04mi |
| 2509 Cedar Bayou Rd Baytown, TX | 1.0 | 1.0 | 600 | $1,200 | $2.00 | 43d | 1 | 1.07mi |
| 211 E Sterling Ave Unit 2 Baytown, TX | 1.0 | 1.0 | 640 | $725 | $1.13 | 24d | 1 | 1.14mi |
| 211 E Sterling Ave Unit 1 Baytown, TX | 1.0 | 1.0 | 640 | $725 | $1.13 | 43d | 1 | 1.14mi |
| 1706 Bob Smith Rd Baytown, TX | 2.0 | 2.0 | 900 | $1,075 | $1.19 | 43d | 1 | 1.31mi |
| 508 Forrest St Baytown, TX | 2.0 | 1.0 | 980 | $1,299 | $1.33 | 5d | 1 | 1.45mi |
| 510 Williams Ave Baytown, TX | 1.0–2.0 | 1.0 | 699 | $1,599 | $2.29 | 2d | 5 | 1.47mi |
| 516 William Ave Baytown, TX | 2.0 | 1.0 | 931 | $1,250 | $1.34 | 43d | 1 | 1.47mi |
HOA detail condo
- Monthly dues
- $430 · $5,160/yr
- Likely covers
- electricpoolparking
- Assessments
- None detected in remarks — confirm with the listing agent.
Listing history 13 events
-
2026-06-18days on market $68,000 Active 52 DOM
-
2026-06-17days on market $68,000 Active 51 DOM
-
2026-06-16days on market $68,000 Active 50 DOM
-
2026-06-15days on market $68,000 Active 49 DOM
-
2026-06-13days on market $68,000 Active 47 DOM
-
2026-06-09days on market $68,000 Active 43 DOM
-
2026-06-07days on market $68,000 Active 41 DOM
-
2026-06-04days on market $68,000 Active 38 DOM
-
2026-06-03days on market $68,000 Active 37 DOM
-
2026-06-02days on market $68,000 Active 36 DOM
-
2026-06-01days on market $68,000 Active 35 DOM
-
2026-05-31days on market $68,000 Active 34 DOM
-
2026-04-27$68,000 Active 489-char remark
ⓘ Source: listings_history table (triggers on properties + properties_extension) + one-shot
backfill from property_details.listing_events for pre-trigger history.
Climate risk First Street
- Flood 4/10 Moderate FEMA zone X (unshaded) · 23% chance over 30 yrs
- Wildfire 3/10 Moderate
- Heat 9/10 Extreme 7 d/yr ≥110°F today · 25 d/yr by 30 yrs out
- Wind 9/10 Extreme 99% chance of damaging wind over 30 yrs
- Air quality 2/10 Low 1 unhealthy d/yr today · 1 by 30 yrs out
Nearby sold comps map
Loading sold comps map…
Walkable amenities ~0.75 mi
Loading nearby amenities…
Taxation est. · year 1
- Rental income
- $13,791
- − Mortgage interest
- −$3,809
- − Property taxes
- −$1,020
- − Insurance
- −$340
- − Repairs & maintenance
- −$1,103
- − Management
- −$1,103
- − HOA
- −$5,160
- − Depreciation
- −$1,978
- Taxable loss
- −$723
- Est. tax savings @ 24.0%
- +$173
- After-tax cash flow
- $269/yr
For passive investors: Depreciation is non-cash, so a rental often shows a tax loss while cash-flowing — sheltering income. Rental losses are passive: they offset passive income freely, and up to $25,000/yr can offset ordinary (W-2) income if you actively participate and your MAGI is under $100k (phasing out to $0 by $150k); unused losses carry forward. On sale, claimed depreciation is recaptured at up to 25%, and gains may owe capital-gains tax (a 1031 exchange can defer both). Figures are a year-1 estimate at your 24.0% rate — not tax advice; consult a CPA.
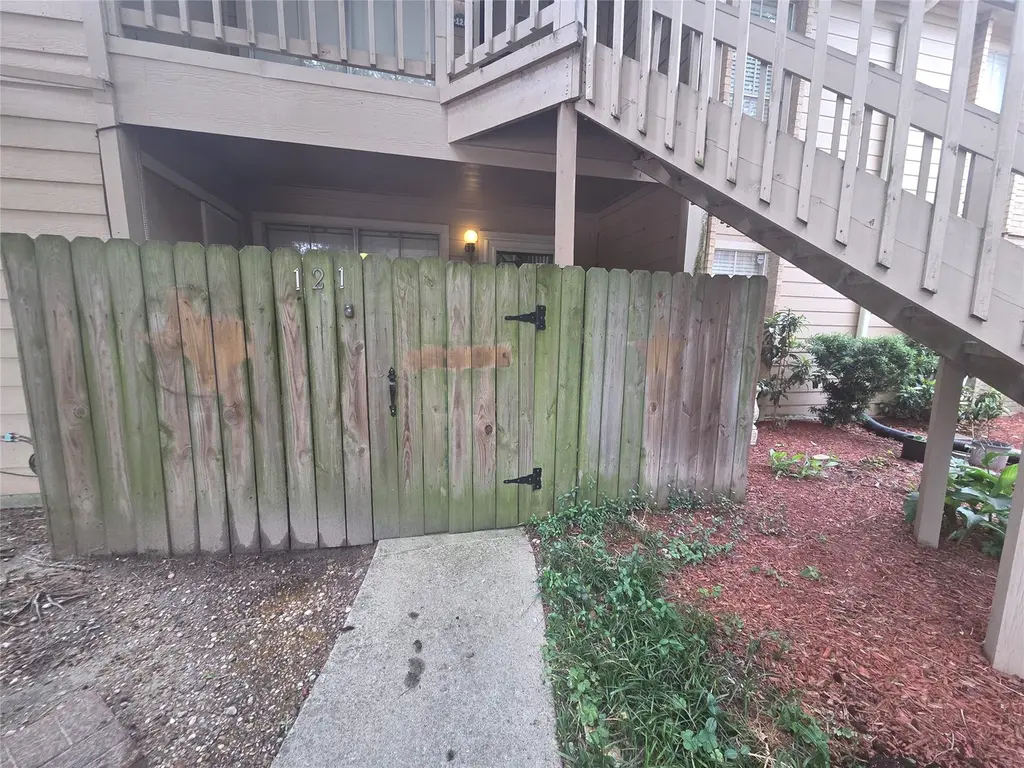
Condition & rehab AI · 6 photos
This 2-bedroom, 2-bathroom condo requires moderate renovations, focusing on the exterior and interior updates to improve its condition and value.
Repairs flagged
- Major Wooden fence — Significant rot and damage
- Major Concrete walkway — Cracks and potential structural issues
- Minor Landscaping — Sparse vegetation
Value-add opportunities
- Both Paint interior walls — Enhances curb appeal and interior aesthetics
- Both Replace countertops — Improves functionality and resale value
- Both Upgrade fixtures — Enhances overall look and functionality
Renovation cost estimate screening
| Repair item | Severity | Est. cost |
|---|---|---|
| Wooden fence · Significant rot and damage | Major | $15,000–50,000 |
| Concrete walkway · Cracks and potential structural issues | Major | $15,000–50,000 |
| Landscaping · Sparse vegetation | Minor | $500–3,000 |
| Total estimated repair cost · 3 items | $30,500–103,000 |
Value-add ROI direction
- Both Paint interior walls — Enhances curb appeal and interior aesthetics ↑
- Both Replace countertops — Improves functionality and resale value ↑
- Both Upgrade fixtures — Enhances overall look and functionality ↑
ⓘ Cost ranges are severity-bucket heuristics (US national rule-of-thumb). Get contractor quotes + a written scope before underwriting a rehab budget.
Schools (NCES district)
- District
- Goose Creek CISD
- NCES district ID
- 4821150
- Math proficiency
- 37% ▼ -11.00%
- Reading proficiency
- 36% ▼ -4.00%
- Median HH income
- $52,468
- Composite
- 31.84/100
- National rank
- #5877
- State rank
- #473 of 826 in TX
Livability — Baytown
- Score
- 69/100
- State rank
- #412
- US rank
- #8494
Category grades
Schools grade is shown separately in the Schools card above.
Census & demographics
- Census place
- Baytown, TX
- County
- Harris County · 4,702,590 people
- City population
- 135,579
- Metro
- Houston-The Woodlands-Sugar Land, TX
- Population (ZIP)
- 36,355
- Household income
- $54,278
- Rent vs Own
- Severe rent burden
- 1559.0
Population outlook (Harris County) Hauer SSP2
- Today (2025)
- 5,571,493 people
- By 2030
- 6,089,821 · +9.3%
- By 2040
- 7,142,806 · +28.2%
- By 2050
- 8,185,864 · +46.9%
- By 2075
- 10,574,329 · +89.8%
- By 2100
- 12,109,958 · +117.4%
Race, ethnicity, and origin ACS 2023
- Neighborhood character
- Diverse neighborhood (Simpson 0.60)
- Race & ethnicity
- Hispanic / Latino 55% White 30% Two or more races 19% Black 10% Asian 2%
- Hispanic origin (detail)
- Mexican 48%
- Common ancestry
- Italian 1% Lithuanian 1% Romanian 1%
- Foreign-born
- 21% · Canada, Vietnam
- Languages at home
- 55% English-only · Spanish 43% Other Asian/Pacific 1% Other Indo-European 1%
Political lean MEDSL · Harris
- 2024 margin
- Lean D (+5.5) · D 52.0% · R 46.4% · Other 1.6%
- 2008→2024 swing
- +3.9pp toward D · 2008: 1.6pp · 2024: 5.5pp
- All cycles
- 2024: D+5.5 2020: D+13.3 2016: D+12.4 2012: D+0.1 2008: D+1.6
Not yet ingested
- Civics
- —
Market trends
- HPI YoY
- ▼ -143.36%
- Current HPI
- 262.066
- Rent YoY
- ▲ 1.30%
- Metro
- Houston-The Woodlands-Sugar Land, TX
- State GDP YoY
- ▲ 3.95%
- F500 in state
- 110
Industry mix (Fortune 500 HQ in TX)
| Industry | F500 HQs | Revenue |
|---|---|---|
| Energy | 16 | $1,198B |
|
||
| Technology | 5 | $198B |
|
||
| Engineering / Construction | 4 | $72B |
|
||
| Energy Services | 3 | $60B |
|
||
| Utilities | 3 | $41B |
|
||
| Healthcare | 2 | $330B |
|
||
Price history
1 event — show timeline
- 2026-04-27 Listed $68,000 HARMLS
Cash-flow waterfall
monthlySold comps — $/sqft
last 12 mo · ≤1 miLoading sold comps…