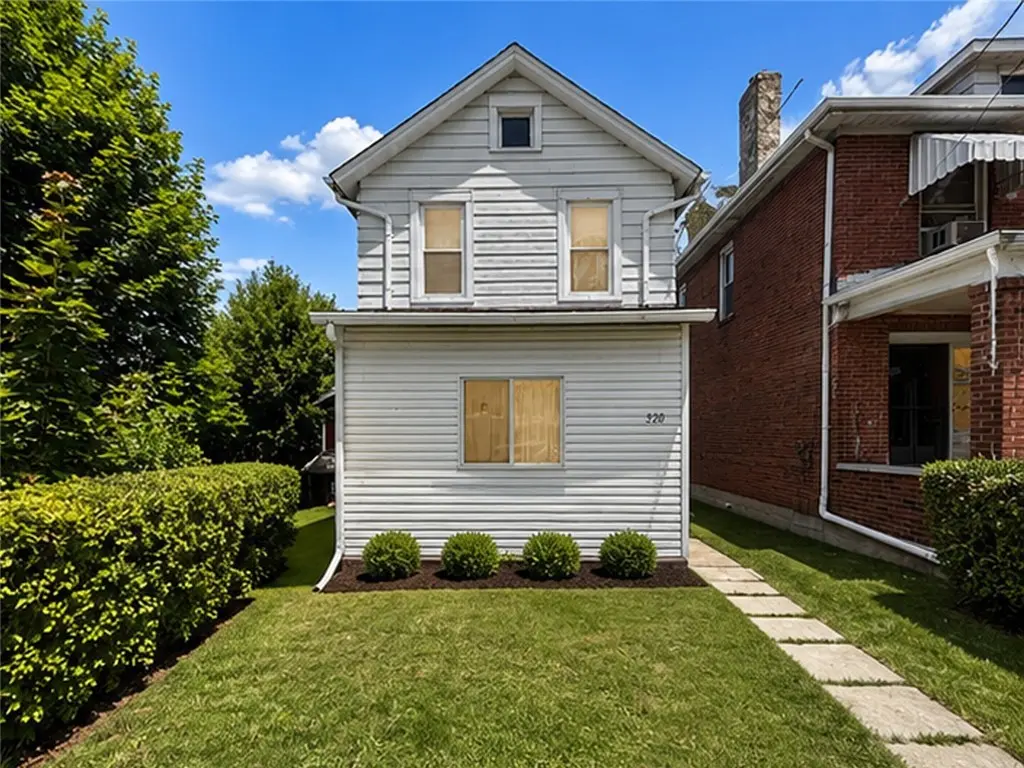
320 N 3rd · Clairton, PA
Flood risk 1/10 · Minimal
- FEMA flood zone
- X (unshaded)
- Chance of flooding over 30 yrs
- 0.0%
- Est. flood insurance / yr
- $473 – $860
Fire risk 1/10 · Minimal
- Est. fire insurance / yr
- $511 – $949
Heat risk 4/10 · Minor
- Hot days now (above 96°F)
- 7 days/yr
- Hot days in 30 yrs
- 19 days/yr
Wind risk 2/10 · Minimal
- Chance of severe wind over 30 yrs
- —
Air-quality risk 5/10 · Moderate
- Unhealthy air days now
- 8 days/yr
- Unhealthy air days in 30 yrs
- 8 days/yr
Risk factors via First Street. Map © Google.
Why this score? — see what drove the C+ grade
The composite is a weighted blend of 9 inputs, each scored 0–100. Each bar is that input's sub-score; the figure is the points it added to the 100-point composite (weight × sub-score).
- Cash flow +30.0/30.0
- DSCR +10.0/10.0
- 1% rule +9.9/10.0
- Rent growth +5.0/5.0
- Livability +3.2/5.0
- Condition / age +2.5/5.0
- Schools +1.1/10.0
- ARV discount +0.0/15.0
- Appreciation +0.0/10.0
$89,900
🖨 Deal sheet (PDF) 📄 Offer letter ✓ Due diligence
Listing remarks MLS
Welcome to your new home in Clairton! This beautifully remodeled two-story residence features three bedrooms and one modern updated bathroom. The heart of the home is the eat in kitchen, perfect for culinary adventures and family gatherings. Enjoy the charm of redone hardwood flooring throughout, adding warmth and elegance to each room. The flat, fenced backyard offers an ideal space for outdoor activities, gardening, or simply relaxing. Full basement for storage and an enclosed front porch area adds extra space for entertaining. Conveniently located close to Route 51, you’ll have easy access to shopping, restaurants, and all the amenities you need. Don’t miss this opportunity to own a piece of Clairton's charm. Schedule your tour today!
Key facts
- Eat in kitchen
- Full basement
- Refreshed flooring
Tags
Property features AI
Exterior
- Parking: On-street parking; 2 parking spaces (total)
- Utilities: Public water; Public sewer
- Home design: 2-story residence; Aluminum siding; Asphalt roof; Resale property
- Construction: Aluminum siding construction; Asphalt roof
- Exterior features: Lot roughly 125 x 25; Small lot (0.07 acres)
Interior
- Kitchen: Convection oven; Cooktop; Refrigerator; Some gas appliances
- Bedrooms: Bedroom on upper level (9x10); Bedroom on main level (13x7); Bonus room on main level (13x6)
- Flooring: Laminate flooring; Carpet
- Bathrooms: 1 full bathroom
- Heating & cooling: Forced air heating (gas)
- Interior features: Multi-pane windows; Full basement with walk-out access
Neighborhood map
What this means for you Summary
Snapshot
- This is a 3-bed/1.0-bath single-family listed at $90k.
Deal economics
- At list price, monthly cash flow is $450 ($5k/yr) — positive.
- The deal already cash-flows at list — no discount required.
- Meets the 1% rule at list price ($1k rent vs $90k).
Location & tenants
- Location reads 63/100 on livability (#1,308 in PA) — a middle-class / working-renter tenant base. Strengths: cost of living A+, housing A; Watch: crime C-, health & safety D+, schools F.
- Clairton City SD (suburban): math 7% / reading 21% proficiency, ranked #520 of 539 in PA (top 96%) — low school quality limits family demand, transient renter base, plan for 1-2y turnover; 82% free/reduced lunch — lower-income household profile, screen leases tightly.
- Market conditions: Rents rising fast (+10.5%/yr); 94 active listings in the ZIP; 20 comparable units currently listed for rent nearby; rentals lingering (median 45d on market — plan ~5-8 weeks vacancy on turnover, expect pricing pressure); 55% of comp listings sitting > 30 days — soft ceiling on asking rent; solid renter incomes; 2,996 units permitted in Allegheny County in 2024 (1,588 in 5+ unit buildings).
Forward outlook
- Local home prices are declining (-3.0%/yr); year-one equity from $622 of loan paydown is wiped out by about $3k of value loss. Plan a longer hold.
- At projected returns (-3.0% appreciation + 8.0% rent growth), your $25k cash investment doubles in ~5 years — after that, you're playing with house money.
Negotiation context
- Only 13 days on market — expect competitive offers; lowballing is unlikely to land.
- 5 sale attempts since 4y ago with the ask held roughly flat each time — persistent listings suggest the price (not the market) is what's stuck; bring a comps-based counter.
- Current owner paid $73k; 23% above their basis — modest negotiation headroom, anchor on the comps not their cost.
Risks & watch-outs
- Watch-outs: built in 1921 — expect roof / HVAC / electrical / plumbing capex.
Questions for the listing agent
- Built in 1921 — when were the roof, HVAC, electrical panel, plumbing, and water heater last replaced?
- Is there a deadline driving the sale (1031 exchange, divorce, estate, relocation)? That informs how much negotiation room exists.
- Schools are F-rated, which usually means shorter tenancies and higher turnover. Who's the typical renter profile here, and what's been the actual vacancy rate?
- What's the average days-on-market for RENTAL listings here right now (not sales)? A rising rental-DOM trend means longer vacancies and softer asking-rent achievability than the comps imply.
- What's the recent tenant-quality profile in this submarket — average credit score on applications, eviction rate, late-payment / NSF rate, and stable-employment percentage? A property-management company in the area should have these aggregated.
- How much new for-sale + rental construction is in the pipeline within 1–3 miles? Heavy new supply typically softens prices + rents 12–24 months out; constrained supply supports both.
Investment metrics
- 1% rule
- 1.49% ✓
- Cap rate
- 12.30%
- Cash-on-cash
- 21.44%
- DSCR
- 1.95
- GRM
- 5.6
CMA / ARV
- ARV (on-the-fly)
- $65,536
- Comps found
- 9
Show comp detail 9 sales within ~0.75 mi
| Address | Dist | Beds/Ba | Sqft | Sold | Price | $/sf | Match |
|---|---|---|---|---|---|---|---|
| 320 N 3rd | 0.00mi | 3/1.0 | 1,024 (0%) | 22mo | $73,000 | $71 | 82 |
| 416 Walnut Ave | 0.17mi | 3/1.0 | 1,100 (+7%) | 4mo | $70,000 | $64 | 77 |
| 412 N 4th St | 0.08mi | 3/1.0 | 1,080 (+6%) | 13mo | $77,000 | $71 | 76 |
| 526 State Route 885 | 0.34mi | 3/2.0 | 992 (-3%) | 5mo | $152,000 | $153 | 71 |
| 423 N 3rd St | 0.09mi | 2/2.0 (-1) | 1,050 (+2%) | 23mo | $99,500 | $95 | 63 |
| 449 Carnegie Ave | 0.29mi | 3/1.5 | 932 (-9%) | 10mo | $52,000 | $56 | 61 |
| 811 N State | 0.43mi | 2/1.0 (-1) | 960 (-6%) | 6mo | $35,000 | $36 | 60 |
| 1029 Pennsylvania Ave | 0.65mi | 2/1.0 (-1) | 1,000 (-2%) | 18mo | $63,000 | $63 | 46 |
| 624 Park Ave | 0.71mi | 2/1.5 (-1) | 896 (-12%) | 3mo | $45,000 | $50 | 37 |
Match score weights: distance 35% · size 25% · config 20% · recency 20%. Top-matched comps best support the ARV.
Projected returns pro-forma
-3.0% appreciation · 8.0% rent growth · sell at horizon
- IRR
- 19.5%
- Equity multiple
- 1.84×
- Total profit
- $21,144
- Equity at exit
- $13,404
- IRR
- 31.0%
- Equity multiple
- 4.47×
- Total profit
- $87,459
- Equity at exit
- $7,773
Cash invested: $25,172 (down + closing). Projections, not guarantees.
Landlord ↔ Tenant lean methodology
- Overall (STATE)
- 62 Landlord-Friendly
- State Pennsylvania
- 62 Landlord-Friendly · EVEN
- County
- — inherits STATE
- City
- — inherits STATE
ZIP-level market 15025
- Home prices YoY
- -34.4%
- Rents YoY
- 10.5%
- Active inventory
- 94
- Price-to-rent
- 5.6×
Monthly cashflow live
- Estimated rent
- $1,335 high interval (Pro) →
- Mortgage (P&I)
- −$471
- Tax from tax record
- −$96 /mo · $1,157/yr
- Insurance
- −$37
- HOA
- −$0
- Vacancy / Maint / Mgmt
- −$280
- Net cashflow
- $450
Break-even live
Sensitivity live
| Price | -10% $501 | -5% $475 | +0% $450 | +5% $424 | +10% $399 |
|---|---|---|---|---|---|
| Rent | -10% $344 | -5% $397 | +0% $450 | +5% $502 | +10% $555 |
| Rate | -1.0pp $495 | -0.5pp $473 | base $450 | +0.5pp $426 | +1.0pp $403 |
UW: 25.0% down · 7.5% · 30yr · 1.5% tax · 5.0% vac · 8.0% maint · 8.0% mgmt
Financing live
Cash to close
- Down payment
- $22,475
- Closing costs
- $2,697
- Reserves months
- —
- Total cash needed
- —
Loan-product check · same deal, 3 products live
Conventional
25% down · 7.5% · 30yr
- Down + closing
- —
- Monthly P&I
- —
- Monthly cashflow
- —
- DSCR
- —
- Eligible?
- —
Personal DTI + credit; lowest rate.
DSCR
20% down · 8.5% · 30yr
- Down + closing
- —
- Monthly P&I
- —
- Monthly cashflow
- —
- DSCR
- —
- Eligible?
- —
No personal income docs; deal must DSCR.
Hard money
10% down · 12.0% · 12mo
- Down + closing
- —
- Monthly P&I
- —
- Monthly cashflow
- —
- DSCR
- —
- Eligible?
- —
Short-term bridge; refi at stabilization.
Rent comps 20 comps
| Address | Beds | Baths | Sqft | Rent | $/sqft | DOM | Units | Dist |
|---|---|---|---|---|---|---|---|---|
| 507 N 6th St Clairton, PA | 2.0 | 1.5 | 1120 | $1,250 | $1.12 | 44d | 1 | 0.22mi |
| 185 Carnegie Ave Clairton, PA | 3.0 | 1.0 | 1404 | $1,295 | $0.92 | 44d | 1 | 0.25mi |
| 231 Connecticut Ave Clairton, PA | 3.0 | 1.0 | 1064 | $1,150 | $1.08 | 44d | 1 | 0.55mi |
| 441 Ohio Ave Clairton, PA | 2.0 | 1.0 | 852 | $950 | $1.12 | 21d | 1 | 0.56mi |
| 701-703 Waddell Ave Clairton, PA | 4.0 | 1.0 | 1200 | $1,850 | $1.54 | 2d | 1 | 0.78mi |
| 1044 Delaware Ave Glassport, PA | 3.0 | 1.0 | 1200 | $1,350 | $1.12 | 21d | 1 | 0.82mi |
| 505 Wylie Ave Clairton, PA | 2.0 | 1.0 | 791 | $1,500 | $1.90 | 2d | 1 | 1.07mi |
| 833 Vermont Ave Glassport, PA | 3.0 | 1.0 | 1290 | $1,395 | $1.08 | 24d | 1 | 1.07mi |
| 350 Wylie Ave Unit 1 Clairton, PA | 2.0 | 1.0 | 1152 | $1,050 | $0.91 | 44d | 1 | 1.17mi |
| 753 East Dr Clairton, PA | 3.0 | 1.0 | 1000 | $1,100 | $1.10 | 44d | 1 | 1.22mi |
| 127 Constitution Cir Clairton, PA | 2.0 | 1.0 | 972 | $1,275 | $1.31 | 2d | 1 | 1.27mi |
| 127 Constitution Cir Clairton, PA | 2.0 | 1.0 | 1063 | $1,275 | $1.20 | 11d | 1 | 1.27mi |
| 642 Ohio Ave Unit 1 Glassport, PA | 2.0 | 1.0 | 700 | $1,200 | $1.71 | 44d | 1 | 1.29mi |
| 809 3rd St Unit 194 Clairton, PA | 2.0 | 1.5 | 1244 | $1,081 | $0.87 | 44d | 1 | 1.35mi |
| 809 3rd St Unit 624 Clairton, PA | 2.0 | 1.5 | 1240 | $1,008 | $0.81 | 44d | 1 | 1.35mi |
| 526 Ohio Ave Unit 3 Glassport, PA | 2.0 | 1.0 | 800 | $900 | $1.12 | 44d | 1 | 1.43mi |
| 866 Vankirk St Unit 1 Clairton, PA | 2.0 | 1.5 | 1440 | $1,200 | $0.83 | 44d | 1 | 1.44mi |
| 511 Payne Hill Rd Clairton, PA | 1.0–3.0 | 1.0–2.0 | 1026 | $1,900 | $1.85 | 2d | 1 | 1.46mi |
| 874 Vankirk St Clairton, PA | 3.0 | 1.5 | 1296 | $1,150 | $0.89 | 44d | 1 | 1.46mi |
| 601 Farnsworth Ave Clairton, PA | 2.0 | 1.0 | 1004 | $995 | $0.99 | 5d | 1 | 1.48mi |
Listing history 9 events
-
2026-06-18days on market $89,900 Active 13 DOM
-
2026-06-17days on market $89,900 Active 12 DOM
-
2026-06-16days on market $89,900 Active 11 DOM
-
2026-06-15days on market $89,900 Active 10 DOM
-
2026-06-13days on market $89,900 Active 8 DOM
-
2026-06-09days on market $89,900 Active 4 DOM
-
2026-06-08days on market $89,900 Active 3 DOM
-
2026-06-07remarks 699-char remark
-
2026-06-07$89,900 Active 2 DOM
ⓘ Source: listings_history table (triggers on properties + properties_extension) + one-shot
backfill from property_details.listing_events for pre-trigger history.
Tax reassessment forecast PA · Partial reset (capped growth)
- Current annual tax
- $1,157 · $96/mo
- Projected year-2 tax
- $1,289 · $107/mo
- Expected delta
- +$132/yr (+$11/mo · 11.4%)
ⓘ Screening estimate from a state-policy table — verify with the county assessor before closing.
Climate risk First Street
- Flood 1/10 Low FEMA zone X (unshaded) · 0% chance over 30 yrs
- Wildfire 1/10 Low
- Heat 4/10 Moderate 7 d/yr ≥96°F today · 19 d/yr by 30 yrs out
- Wind 2/10 Low
- Air quality 5/10 Major 8 unhealthy d/yr today · 8 by 30 yrs out
Nearby sold comps map
Loading sold comps map…
Walkable amenities ~0.75 mi
Loading nearby amenities…
Taxation est. · year 1
- Rental income
- $16,026
- − Mortgage interest
- −$5,036
- − Property taxes
- −$1,157
- − Insurance
- −$450
- − Repairs & maintenance
- −$1,282
- − Management
- −$1,282
- − Depreciation
- −$2,615
- Taxable income
- $4,204
- Est. tax owed @ 24.0%
- −$1,009
- After-tax cash flow
- $4,388/yr
For passive investors: Depreciation is non-cash, so a rental often shows a tax loss while cash-flowing — sheltering income. Rental losses are passive: they offset passive income freely, and up to $25,000/yr can offset ordinary (W-2) income if you actively participate and your MAGI is under $100k (phasing out to $0 by $150k); unused losses carry forward. On sale, claimed depreciation is recaptured at up to 25%, and gains may owe capital-gains tax (a 1031 exchange can defer both). Figures are a year-1 estimate at your 24.0% rate — not tax advice; consult a CPA.
Schools (NCES district)
- District
- Clairton City SD
- NCES district ID
- 4206030
- Math proficiency
- 7% ▼ -11.00%
- Reading proficiency
- 21% ▼ -12.00%
- Median HH income
- $30,250
- Composite
- 11.0/100
- National rank
- #9742
- State rank
- #520 of 539 in PA
Livability — Clairton
- Score
- 63/100
- State rank
- #1308
- US rank
- #16085
Category grades
Schools grade is shown separately in the Schools card above.
Census & demographics
- Census place
- Clairton, PA
- County
- Allegheny County · 1,022,028 people
- City population
- 16,939
- Metro
- Pittsburgh, PA
- Population (ZIP)
- 16,939
- Household income
- $76,531
- Rent vs Own
- Severe rent burden
- 572.0
Population outlook (Allegheny County) Hauer SSP2
- Today (2025)
- 1,250,282 people
- By 2030
- 1,256,482 · +0.5%
- By 2040
- 1,256,318 · +0.5%
- By 2050
- 1,244,169 · -0.5%
- By 2075
- 1,197,693 · -4.2%
- By 2100
- 1,093,187 · -12.6%
Race, ethnicity, and origin ACS 2023
- Neighborhood character
- Predominantly White (74%)
- Race & ethnicity
- White 74% Black 18% Two or more races 4% Asian 2% Hispanic / Latino 2%
- Common ancestry
- Romanian 6% Lithuanian 2% Slovak 1%
- Foreign-born
- 4% · China, Canada, India
- Languages at home
- 96% English-only · Other Indo-European 1% Chinese 1% Spanish 1%
Political lean MEDSL · Allegheny
- 2024 margin
- Strong D (+20.3) · D 59.7% · R 39.4%
- 2008→2024 swing
- +4.8pp toward D · 2008: 15.5pp · 2024: 20.3pp
- All cycles
- 2024: D+20.3 2020: D+20.4 2016: D+16.4 2012: D+14.4 2008: D+15.5
Not yet ingested
- Civics
- —
Market trends
- HPI YoY
- ▼ -96.35%
- Current HPI
- 183.858
- Rent YoY
- ▲ 10.47%
- Metro
- Pittsburgh, PA
- State GDP YoY
- ▲ 1.68%
- F500 in state
- 34
Industry mix (Fortune 500 HQ in PA)
| Industry | F500 HQs | Revenue |
|---|---|---|
| Healthcare | 2 | $309B |
|
||
| Insurance | 2 | $27B |
|
||
| Telecommunications / Media | 1 | $124B |
|
||
| Industrial Distribution | 1 | $22B |
|
||
| Financial Services | 1 | $20B |
|
||
| Chemicals / Materials | 1 | $18B |
|
||
Price history
+1184.3% since first listed23 events — show timeline
- 2026-06-05 Listed $89,900 West Penn MLS
- 2025-03-12 Rental Removed $1,100 WPMLS
- 2025-02-20 Price Changed $1,100 WPMLS
- 2025-01-24 Price Changed $1,200 WPMLS
- 2024-12-05 Listed for Rent $1,350 WPMLS
- 2024-12-05 Rental Removed $1,350 BUILDIUM
- 2024-10-31 Price Changed $1,350 BUILDIUM
- 2024-09-27 Price Changed $1,785 BUILDIUM
- 2024-09-21 Listed for Rent $1,405 BUILDIUM
- 2024-08-28 Pending — West Penn MLS
- 2024-08-28 Sold (Public Records) $73,000 Public Records
- 2024-08-28 Sold (MLS) $73,000 West Penn MLS
- 2024-07-29 Contingent — West Penn MLS
- 2024-07-23 Price Changed $82,000 West Penn MLS
- 2024-07-22 Price Changed $86,000 West Penn MLS
- 2024-07-05 Listed $90,000 West Penn MLS
- 2022-12-20 Sold (Public Records) $10,000 Public Records
- 2022-12-15 Sold (MLS) $10,000 West Penn MLS
- 2022-11-23 Pending — West Penn MLS
- 2022-11-10 Price Changed $19,900 West Penn MLS
- 2022-10-05 Price Changed $29,900 West Penn MLS
- 2022-09-09 Listed $34,900 West Penn MLS
- 1975-09-12 Sold (Public Records) $7,000 Public Records
Property tax history
+12.7%/yrLatest (2026): $1,157 · +11.0% YoY. Source: county tax records.
Cash-flow waterfall
monthlySold comps — $/sqft
last 12 mo · ≤1 miLoading sold comps…