131 Greenhurst Village Dr · Lakewood, NY
Flood risk 1/10 · Minimal
- FEMA flood zone
- X
- Chance of flooding over 30 yrs
- 0.0%
- Est. flood insurance / yr
- $473 – $860
Fire risk 2/10 · Minimal
- Est. fire insurance / yr
- $691 – $1,283
Heat risk 1/10 · Minimal
- Hot days now (above 91°F)
- 7 days/yr
- Hot days in 30 yrs
- 18 days/yr
Wind risk 1/10 · Minimal
- Chance of severe wind over 30 yrs
- —
Air-quality risk 2/10 · Minimal
- Unhealthy air days now
- 0 days/yr
- Unhealthy air days in 30 yrs
- 1 days/yr
Risk factors via First Street. Map © Google.
Why this score? — see what drove the D- grade
The composite is a weighted blend of 9 inputs, each scored 0–100. Each bar is that input's sub-score; the figure is the points it added to the 100-point composite (weight × sub-score).
- Cash flow +15.0/30.0
- Schools +5.5/10.0
- 1% rule +5.0/10.0
- DSCR +5.0/10.0
- Livability +3.6/5.0
- Rent growth +2.5/5.0
- Condition / age +2.5/5.0
- ARV discount +0.0/15.0
- Appreciation +0.0/10.0
$20,000
🖨 Deal sheet 📄 Offer letter ✓ Due diligence
Listing remarks MLS
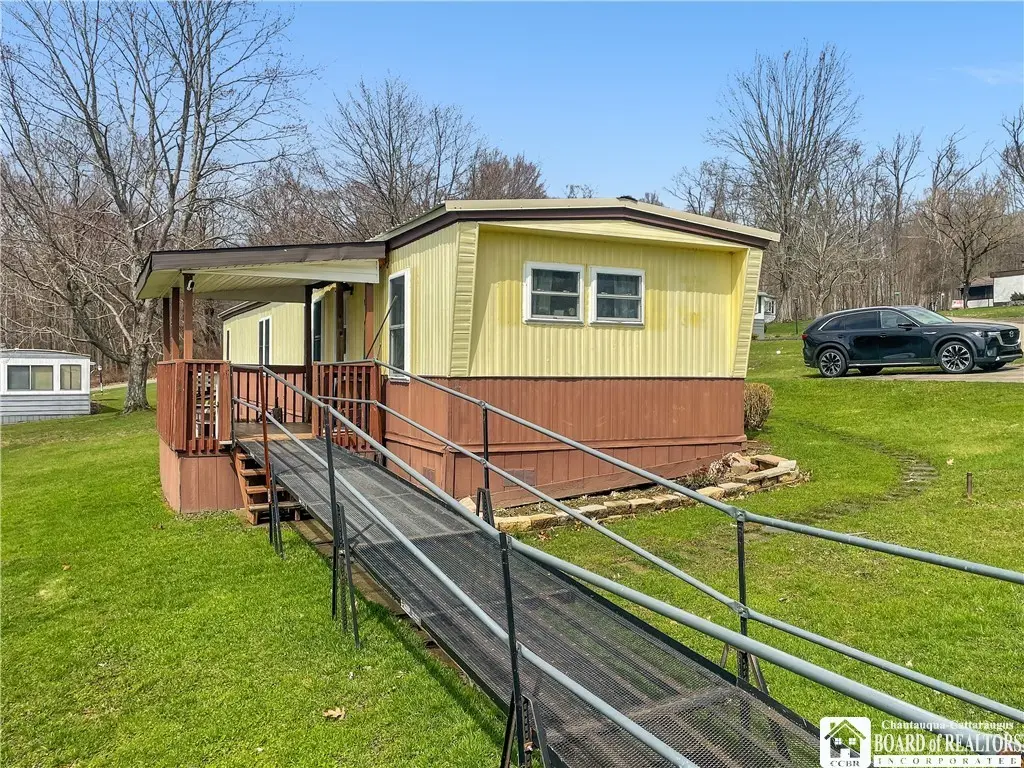
Well-maintained and affordable, this 2 bedroom, 1 bath mobile home in Greenhurst Village offers easy one-level living. Inside you’ll find a spacious living room, eat-in kitchen, and all appliances included. Recent improvements include updated windows and doors, a metal roof in 2020, and a newer shed in 2024. All electric utilities. A great option for anyone looking for low-maintenance living at an affordable price. Lot rent is $417/month. Ramp does not convey with the property.
Key facts
- Metal roof
- Updated windows
- One-level living
Tags
Neighborhood map
What this means for you Summary
Snapshot
- This is a 2-bed/1.0-bath manufactured listed at $20k.
Deal economics
- At list price, monthly cash flow is $979 ($12k/yr) — positive.
- The deal already cash-flows at list — no discount required.
- Meets the 1% rule at list price ($1k rent vs $20k).
- Recommended offer: $19k (6.0% below list) — sets the bar for market timing.
- Cap rate 65.0% vs local median 3.0% in Lakewood — top-decile yield for the area; either an underpriced asset or a hidden risk that comps aren't pricing in. Stress-test before assuming the spread holds.
Location & tenants
- Location reads 71/100 on livability (#398 in NY) — a middle-class / working-renter tenant base. Strengths: cost of living A+, housing A+, health & safety A+; Watch: schools D+, employment D+, amenities F.
- Bemus Point Central School District (rural): math 65% / reading 61% proficiency, ranked #238 of 755 in NY (top 32%) — acceptable for families but not a draw, mixed tenant base, ~2y average lease; only 18% free/reduced lunch — higher-income household profile.
- Market conditions: 313 active listings in the ZIP; 2 comparable units currently listed for rent nearby; 127 units permitted in Chautauqua County in 2024 (0 in 5+ unit buildings).
- This rent runs 34% of the median local income ($50k/yr) — at the standard rent-burdened threshold; future hikes will face affordability resistance.
Forward outlook
- Local home prices are declining (-3.0%/yr); year-one equity from $138 of loan paydown is wiped out by about $600 of value loss. Plan a longer hold.
- Chautauqua County population projected at -22% by 2050 — secular population decline; favor cash flow + early exit over multi-decade hold.
- At projected returns (-3.0% appreciation + 3.0% rent growth), your $6k cash investment doubles in ~1 year — after that, you're playing with house money.
Negotiation context
- It's been on market 64 days — a 6% lower offer ($19k) is reasonable based on typical stale-listing flexibility.
Questions for the listing agent
- It's been on market 64 days. Have you received any prior offers? Is the seller open to a 6% concession, seller financing, or rate buy-down credit?
- Built in 1979 — when were the roof, HVAC, electrical panel, plumbing, and water heater last replaced?
- Why hasn't it sold? Are there any deal-killer items the seller is aware of (foundation, flood, title, zoning, code violations)?
- Is there a deadline driving the sale (1031 exchange, divorce, estate, relocation)? That informs how much negotiation room exists.
- Schools are D-rated, which usually means shorter tenancies and higher turnover. Who's the typical renter profile here, and what's been the actual vacancy rate?
- The area grade is low — what's the realistic commute time and amenity access for the typical tenant pool here? Any planned neighborhood developments (good or bad) we should know about?
- What's the average days-on-market for RENTAL listings here right now (not sales)? A rising rental-DOM trend means longer vacancies and softer asking-rent achievability than the comps imply.
- What's the recent tenant-quality profile in this submarket — average credit score on applications, eviction rate, late-payment / NSF rate, and stable-employment percentage? A property-management company in the area should have these aggregated.
- How much new for-sale + rental construction is in the pipeline within 1–3 miles? Heavy new supply typically softens prices + rents 12–24 months out; constrained supply supports both.
Investment metrics
- 1% rule
- 7.10% ✓
- Cap rate
- 65.01%
- Cash-on-cash
- 209.70%
- DSCR
- 10.33
- GRM
- 1.2
CMA / ARV
- ARV (median comp)
- $17,000
- List price
- $20,000
- Delta
- 17.65%
- Verdict
- OVERPRICED
- Comps
- 5 within 1.0 mi
Show comp detail 10 sales within ~0.75 mi
| Address | Dist | Beds/Ba | Sqft | Sold | Price | $/sf | Match |
|---|---|---|---|---|---|---|---|
| 131 Greenhurst Village Dr | 0.00mi | 2/1.0 | 952 (0%) | 0mo | $17,000 | $18 | 100 |
| 136 7th Greenhurst Village Dr | 0.08mi | 2/1.0 | 980 (+3%) | 2mo | $33,000 | $34 | 90 |
| 143 Greenhurst Village Dr | 0.04mi | 2/2.0 | 1,008 (+6%) | 0mo | $16,500 | $16 | 84 |
| 142 Greenhurst Vlg | 0.02mi | 2/2.0 | 1,036 (+9%) | 2mo | $30,000 | $29 | 79 |
| 103 Palmer Greenhurst Village Dr | 0.09mi | 2/2.0 | 980 (+3%) | 13mo | $29,000 | $30 | 76 |
| 116 Greenhurst Village Dr | 0.04mi | 3/2.0 (+1) | 980 (+3%) | 11mo | $10,800 | $11 | 75 |
| 139 7th Greenhurst Village Dr | 0.04mi | 2/1.0 | 980 (+3%) | 22mo | $35,000 | $36 | 74 |
| 130 7th St. Greenhurst Village Dr | 0.08mi | 2/1.5 | 980 (+3%) | 19mo | $23,700 | $24 | 73 |
| 108 Circle Greenhurst Village Dr | 0.09mi | 2/1.0 | 896 (-6%) | 16mo | $35,000 | $39 | 73 |
| 155 8th Greenhurst Village Dr | 0.11mi | 2/2.0 | 1,008 (+6%) | 14mo | $39,500 | $39 | 69 |
Match score weights: distance 35% · size 25% · config 20% · recency 20%. Top-matched comps best support the ARV.
Projected returns pro-forma
-3.0% appreciation · 3.0% rent growth · sell at horizon
- IRR
- —
- Equity multiple
- 11.56×
- Total profit
- $59,111
- Equity at exit
- $2,982
- IRR
- —
- Equity multiple
- 24.54×
- Total profit
- $131,828
- Equity at exit
- $1,729
Cash invested: $5,600 (down + closing). Projections, not guarantees.
Landlord ↔ Tenant lean methodology
- Overall (STATE)
- 15 Strongly Tenant-Friendly
- State New York
- 15 Strongly Tenant-Friendly · D+10
- County
- — inherits STATE
- City
- — inherits STATE
ZIP-level market 14701
- Home prices YoY
- -18.5%
- Active inventory
- 313
- Price-to-rent
- 1.2×
Monthly cashflow live
- Estimated rent
- $1,420 medium interval (Pro) →
- Mortgage (P&I)
- −$105
- Tax from tax record
- −$30 /mo · $362/yr
- Insurance
- −$8
- HOA
- −$0
- Vacancy / Maint / Mgmt
- −$298
- Net cashflow
- $979
Break-even live
UW: 25.0% down · 7.5% · 30yr · 1.5% tax · 5.0% vac · 8.0% maint · 8.0% mgmt
Financing live
Cash to close
- Down payment
- $5,000
- Closing costs
- $600
- Reserves months
- —
- Total cash needed
- —
Loan-product check · same deal, 3 products live
Conventional
25% down · 7.5% · 30yr
- Down + closing
- —
- Monthly P&I
- —
- Monthly cashflow
- —
- DSCR
- —
- Eligible?
- —
Personal DTI + credit; lowest rate.
DSCR
20% down · 8.5% · 30yr
- Down + closing
- —
- Monthly P&I
- —
- Monthly cashflow
- —
- DSCR
- —
- Eligible?
- —
No personal income docs; deal must DSCR.
Hard money
10% down · 12.0% · 12mo
- Down + closing
- —
- Monthly P&I
- —
- Monthly cashflow
- —
- DSCR
- —
- Eligible?
- —
Short-term bridge; refi at stabilization.
Rent comps 2 comps
| Address | Beds | Baths | Sqft | Rent | $/sqft | DOM | Units | Dist |
|---|---|---|---|---|---|---|---|---|
| 2887 Fluvanna Townline Rd Jamestown, NY | 1.0 | 1.0 | 820 | $1,750 | $2.13 | 43d | 1 | 0.43mi |
| 3779 Heineman Rd Bemus Point, NY | 2.0 | 2.0 | 1100 | $2,200 | $2.00 | 43d | 1 | 0.52mi |
Listing history 7 events
-
2026-06-03statusdays on market $20,000 Pending 64 DOM
-
2026-06-02days on market $20,000 Active Under Contract 63 DOM
-
2026-06-01days on market $20,000 Active Under Contract 62 DOM
-
2026-05-31days on market $20,000 Active Under Contract 61 DOM
-
2026-05-30days on market $20,000 Active Under Contract 60 DOM
-
2026-05-09historical Active Under Contract 488-char remark
Show marketing remark (488 chars)
Well-maintained and affordable, this 2 bedroom, 1 bath mobile home in Greenhurst Village offers easy one-level living. Inside you’ll find a spacious living room, eat-in kitchen, and all appliances included. Recent improvements include updated windows and doors, a metal roof in 2020, and a newer shed in 2024. All electric utilities. A great option for anyone looking for low-maintenance living at an affordable price. Lot rent is $417/month. Ramp does not convey with the property.
-
2026-03-31$20,000 Active 488-char remark
Show marketing remark (488 chars)
Well-maintained and affordable, this 2 bedroom, 1 bath mobile home in Greenhurst Village offers easy one-level living. Inside you’ll find a spacious living room, eat-in kitchen, and all appliances included. Recent improvements include updated windows and doors, a metal roof in 2020, and a newer shed in 2024. All electric utilities. A great option for anyone looking for low-maintenance living at an affordable price. Lot rent is $417/month. Ramp does not convey with the property.
ⓘ Source: listings_history table (triggers on properties + properties_extension) + one-shot
backfill from property_details.listing_events for pre-trigger history.
Tax reassessment forecast NY · Partial reset (capped growth)
- Current annual tax
- $362 · $30/mo
- Projected year-2 tax
- $362 · $30/mo
- Expected delta
- $0/yr ($0/mo · 0.0%)
ⓘ Screening estimate from a state-policy table — verify with the county assessor before closing.
Climate risk First Street
- Flood 1/10 Low FEMA zone X · 0% chance over 30 yrs
- Wildfire 2/10 Low
- Heat 1/10 Low 7 d/yr ≥91°F today · 18 d/yr by 30 yrs out
- Wind 1/10 Low
- Air quality 2/10 Low 0 unhealthy d/yr today · 1 by 30 yrs out
Nearby sold comps map
Loading sold comps map…
Walkable amenities ~0.75 mi
Loading nearby amenities…
Taxation est. · year 1
- Rental income
- $17,043
- − Mortgage interest
- −$1,120
- − Property taxes
- −$362
- − Insurance
- −$100
- − Repairs & maintenance
- −$1,363
- − Management
- −$1,363
- − Depreciation
- −$582
- Taxable income
- $12,152
- Est. tax owed @ 24.0%
- −$2,916
- After-tax cash flow
- $8,827/yr
For passive investors: Depreciation is non-cash, so a rental often shows a tax loss while cash-flowing — sheltering income. Rental losses are passive: they offset passive income freely, and up to $25,000/yr can offset ordinary (W-2) income if you actively participate and your MAGI is under $100k (phasing out to $0 by $150k); unused losses carry forward. On sale, claimed depreciation is recaptured at up to 25%, and gains may owe capital-gains tax (a 1031 exchange can defer both). Figures are a year-1 estimate at your 24.0% rate — not tax advice; consult a CPA.
Schools (NCES district)
- District
- Bemus Point Central School District
- NCES district ID
- 3604530
- Math proficiency
- 65% ▼ -4.00%
- Reading proficiency
- 61% ▼ -9.00%
- Median HH income
- $50,968
- Composite
- 55.15/100
- National rank
- #2753
- State rank
- #238 of 755 in NY
Livability — Lakewood
- Score
- 71/100
- State rank
- #398
- US rank
- #6904
Category grades
Schools grade is shown separately in the Schools card above.
Census & demographics
- County
- Chautauqua County · 38,461 people
- Metro
- Jamestown-Dunkirk-Fredonia, NY
- Population (ZIP)
- 38,461
- Household income
- $49,685
- Rent vs Own
- Severe rent burden
- 1838.0
Population outlook (Chautauqua County) Hauer SSP2
- Today (2025)
- 123,454 people
- By 2030
- 118,509 · -4.0%
- By 2040
- 107,311 · -13.1%
- By 2050
- 96,703 · -21.7%
- By 2075
- 76,757 · -37.8%
- By 2100
- 60,984 · -50.6%
Race, ethnicity, and origin ACS 2023
- Neighborhood character
- Predominantly White (82%)
- Race & ethnicity
- White 82% Hispanic / Latino 11% Two or more races 6% Black 3%
- Hispanic origin (detail)
- Puerto Rican 8%
- Common ancestry
- Romanian 6% Lithuanian 2% Slovak 2%
- Foreign-born
- 3% · Canada
- Languages at home
- 92% English-only · Spanish 6% Other Indo-European 1% French/Haitian/Cajun 1%
Political lean MEDSL · Chautauqua
- 2024 margin
- Strong R (+22.0) · D 39.0% · R 61.0%
- 2008→2024 swing
- -22.9pp toward R · 2008: 0.9pp · 2024: -22.0pp
- All cycles
- 2024: R+22.0 2020: R+19.8 2016: R+24.6 2012: R+8.2 2008: D+0.9
Not yet ingested
- Civics
- —
Market trends
- HPI YoY
- ▼ -58.93%
- Current HPI
- 259.402
- Rent YoY
- —
- Metro
- Jamestown-Dunkirk-Fredonia, NY
- State GDP YoY
- ▲ 2.60%
- F500 in state
- 92
Industry mix (Fortune 500 HQ in NY)
| Industry | F500 HQs | Revenue |
|---|---|---|
| Financial Services | 10 | $950B |
|
||
| Consumer Goods | 9 | $162B |
|
||
| Insurance | 4 | $225B |
|
||
| Telecommunications | 2 | $144B |
|
||
| Pharmaceuticals | 2 | $112B |
|
||
| Media / Entertainment | 2 | $69B |
|
||
Price history
2 events — show timeline
- 2026-05-09 Contingent — UNYREIS
- 2026-03-31 Listed $20,000 UNYREIS
Property tax history
+6.2%/yrLatest (2025): $362 · +0.4% YoY. Source: county tax records.
Cash-flow waterfall
monthlySold comps — $/sqft
last 12 mo · ≤1 miLoading sold comps…