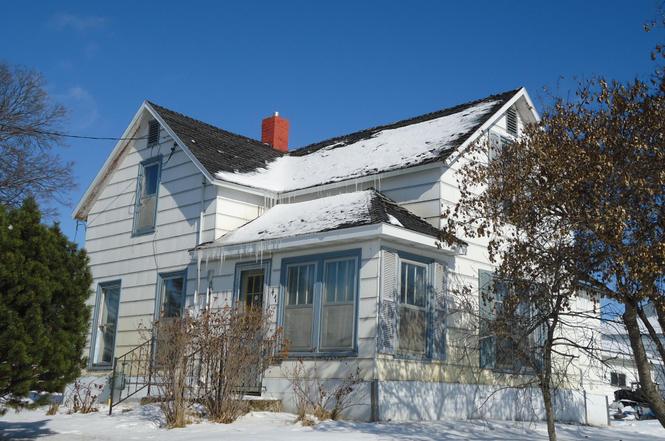
47 2nd St NW · Pelican Rapids, MN
Flood risk 1/10 · Minimal
- FEMA flood zone
- —
- Chance of flooding over 30 yrs
- 0.0%
- Est. flood insurance / yr
- —
Fire risk 3/10 · Minor
- Est. fire insurance / yr
- $888 – $1,650
Heat risk 1/10 · Minimal
- Hot days now (above 95°F)
- 7 days/yr
- Hot days in 30 yrs
- 12 days/yr
Wind risk 2/10 · Minimal
- Chance of severe wind over 30 yrs
- —
Air-quality risk 3/10 · Minor
- Unhealthy air days now
- 2 days/yr
- Unhealthy air days in 30 yrs
- 3 days/yr
Risk factors via First Street. Map © Google.
Why this score? — see what drove the B grade
The composite is a weighted blend of 9 inputs, each scored 0–100. Each bar is that input's sub-score; the figure is the points it added to the 100-point composite (weight × sub-score).
- Cash flow +30.0/30.0
- 1% rule +10.0/10.0
- DSCR +10.0/10.0
- ARV discount +7.5/15.0
- Schools +4.3/10.0
- Livability +3.9/5.0
- Rent growth +2.5/5.0
- Condition / age +2.5/5.0
- Appreciation +0.0/10.0
$73,600
🖨 Deal sheet 📄 Offer letter ✓ Due diligence
Listing remarks
Opportunity awaits! This 3-bedroom, 1-bath home is full of potential and ready for your vision. This property offers a great opportunity for investors, flippers, or buyers looking to build equity with some TLC. Would make a great rental! The home features a functional layout, a solid footprint to work with. Being sold AS-IS, this fixer-upper is priced accordingly and ready for renovation. With the right updates, this property could truly shine. Convenient location close to downtown. Don’t miss your chance to transform this property.
Key facts
- Functional layout
- Solid footprint
- Convenient location
Tags
Neighborhood map
What this means for you Summary
Snapshot
- This is a 3-bed/1.0-bath single-family listed at $74k.
Deal economics
- At list price, monthly cash flow is $602 ($7k/yr) — positive.
- The deal already cash-flows at list — no discount required.
- Meets the 1% rule at list price ($1k rent vs $74k).
- Recommended offer: $67k (9.0% below list) — sets the bar for market timing.
- Cap rate 16.1% vs local median 1.4% in Pelican Rapids — top-decile yield for the area; either an underpriced asset or a hidden risk that comps aren't pricing in. Stress-test before assuming the spread holds.
Location & tenants
- Location reads 78/100 on livability (#114 in MN, #2,581 nationally) — a middle-class / working-renter tenant base. Strengths: crime A+, cost of living A+, housing A+; Watch: amenities F, commute F.
- Pelican Rapids Public School District (rural): math 45% / reading 54% proficiency, ranked #123 of 301 in MN (top 41%) — families likely to look elsewhere, expect single-tenant / working-renter base with shorter leases.
- Market conditions: 175 active listings in the ZIP; 140 units permitted in Otter Tail County in 2024 (48 in 5+ unit buildings).
Forward outlook
- Local home prices are declining (-3.0%/yr); year-one equity from $509 of loan paydown is wiped out by about $2k of value loss. Plan a longer hold.
- At projected returns (-3.0% appreciation + 3.0% rent growth), your $21k cash investment doubles in ~4 years — after that, you're playing with house money.
Negotiation context
- It's been on market 91 days — a 9% lower offer ($67k) is reasonable based on typical stale-listing flexibility.
- Current owner paid $18k; list at $74k implies a 298% gain — meaningful room to come down on a strong offer.
Risks & watch-outs
- Watch-outs: built in 1900 — expect roof / HVAC / electrical / plumbing capex.
Questions for the listing agent
- It's been on market 91 days. Have you received any prior offers? Is the seller open to a 9% concession, seller financing, or rate buy-down credit?
- Built in 1900 — when were the roof, HVAC, electrical panel, plumbing, and water heater last replaced?
- Why hasn't it sold? Are there any deal-killer items the seller is aware of (foundation, flood, title, zoning, code violations)?
- Is there a deadline driving the sale (1031 exchange, divorce, estate, relocation)? That informs how much negotiation room exists.
- What's the average days-on-market for RENTAL listings here right now (not sales)? A rising rental-DOM trend means longer vacancies and softer asking-rent achievability than the comps imply.
- What's the recent tenant-quality profile in this submarket — average credit score on applications, eviction rate, late-payment / NSF rate, and stable-employment percentage? A property-management company in the area should have these aggregated.
- How much new for-sale + rental construction is in the pipeline within 1–3 miles? Heavy new supply typically softens prices + rents 12–24 months out; constrained supply supports both.
Investment metrics
- 1% rule
- 1.92% ✓
- Cap rate
- 16.11%
- Cash-on-cash
- 35.05%
- DSCR
- 2.56
- GRM
- 4.4
CMA / ARV
No comps found within radius.
Projected returns pro-forma
-3.0% appreciation · 3.0% rent growth · sell at horizon
- IRR
- 30.6%
- Equity multiple
- 2.28×
- Total profit
- $26,438
- Equity at exit
- $10,974
- IRR
- 37.8%
- Equity multiple
- 4.52×
- Total profit
- $72,485
- Equity at exit
- $6,364
Cash invested: $20,608 (down + closing). Projections, not guarantees.
Landlord ↔ Tenant lean methodology
- Overall (STATE)
- 46 Balanced
- State Minnesota
- 46 Balanced · D+2
- County
- — inherits STATE
- City
- — inherits STATE
ZIP-level market 56572
- Home prices YoY
- -14.1%
- Active inventory
- 175
- Price-to-rent
- 4.4×
Monthly cashflow live
- Estimated rent
- $1,409 medium interval (Pro) →
- Mortgage (P&I)
- −$386
- Tax from tax record
- −$95 /mo · $1,138/yr
- Insurance
- −$31
- HOA
- −$0
- Vacancy / Maint / Mgmt
- −$296
- Net cashflow
- $602
Break-even live
UW: 25.0% down · 7.5% · 30yr · 1.5% tax · 5.0% vac · 8.0% maint · 8.0% mgmt
Financing live
Cash to close
- Down payment
- $18,400
- Closing costs
- $2,208
- Reserves months
- —
- Total cash needed
- —
Loan-product check · same deal, 3 products live
Conventional
25% down · 7.5% · 30yr
- Down + closing
- —
- Monthly P&I
- —
- Monthly cashflow
- —
- DSCR
- —
- Eligible?
- —
Personal DTI + credit; lowest rate.
DSCR
20% down · 8.5% · 30yr
- Down + closing
- —
- Monthly P&I
- —
- Monthly cashflow
- —
- DSCR
- —
- Eligible?
- —
No personal income docs; deal must DSCR.
Hard money
10% down · 12.0% · 12mo
- Down + closing
- —
- Monthly P&I
- —
- Monthly cashflow
- —
- DSCR
- —
- Eligible?
- —
Short-term bridge; refi at stabilization.
Listing history 17 events
-
2026-06-19days on market $73,600 Active 91 DOM
-
2026-06-18days on market $73,600 Active 90 DOM
-
2026-06-17days on market $73,600 Active 89 DOM
-
2026-06-16days on market $73,600 Active 88 DOM
-
2026-06-15days on market $73,600 Active 87 DOM
-
2026-06-14days on market $73,600 Active 85 DOM
-
2026-06-12days on market $73,600 Active 84 DOM
-
2026-06-09days on market $73,600 Active 81 DOM
-
2026-06-08days on market $73,600 Active 80 DOM
-
2026-06-07days on market $73,600 Active 79 DOM
-
2026-06-07days on market $73,600 Active 78 DOM
-
2026-06-04days on market $73,600 Active 75 DOM
-
2026-06-02days on market $73,600 Active 74 DOM
-
2026-06-01days on market $73,600 Active 73 DOM
-
2026-05-31days on market $73,600 Active 72 DOM
-
2026-05-31days on market $73,600 Active 71 DOM
-
2000-05-31soldstatus $18,500
ⓘ Source: listings_history table (triggers on properties + properties_extension) + one-shot
backfill from property_details.listing_events for pre-trigger history.
Tax reassessment forecast MN · Partial reset (capped growth)
- Current annual tax
- $1,138 · $95/mo
- Projected year-2 tax
- $1,138 · $95/mo
- Expected delta
- $0/yr ($0/mo · 0.0%)
ⓘ Screening estimate from a state-policy table — verify with the county assessor before closing.
Climate risk First Street
- Flood 1/10 Low 0% chance over 30 yrs
- Wildfire 3/10 Moderate
- Heat 1/10 Low 7 d/yr ≥95°F today · 12 d/yr by 30 yrs out
- Wind 2/10 Low
- Air quality 3/10 Moderate 2 unhealthy d/yr today · 3 by 30 yrs out
Nearby sold comps map
Loading sold comps map…
Walkable amenities ~0.75 mi
Loading nearby amenities…
Taxation est. · year 1
- Rental income
- $16,913
- − Mortgage interest
- −$4,123
- − Property taxes
- −$1,138
- − Insurance
- −$368
- − Repairs & maintenance
- −$1,353
- − Management
- −$1,353
- − Depreciation
- −$2,141
- Taxable income
- $6,437
- Est. tax owed @ 24.0%
- −$1,545
- After-tax cash flow
- $5,679/yr
For passive investors: Depreciation is non-cash, so a rental often shows a tax loss while cash-flowing — sheltering income. Rental losses are passive: they offset passive income freely, and up to $25,000/yr can offset ordinary (W-2) income if you actively participate and your MAGI is under $100k (phasing out to $0 by $150k); unused losses carry forward. On sale, claimed depreciation is recaptured at up to 25%, and gains may owe capital-gains tax (a 1031 exchange can defer both). Figures are a year-1 estimate at your 24.0% rate — not tax advice; consult a CPA.
Schools (NCES district)
- District
- Pelican Rapids Public School District
- NCES district ID
- 2728170
- Math proficiency
- 45% ▼ -11.00%
- Reading proficiency
- 54% ▼ -3.00%
- Median HH income
- $51,933
- Composite
- 42.52/100
- National rank
- #3203
- State rank
- #123 of 301 in MN
Livability — Pelican Rapids
- Score
- 78/100
- State rank
- #114
- US rank
- #2581
Category grades
Schools grade is shown separately in the Schools card above.
Census & demographics
- Census place
- Pelican Rapids, MN
- Population (ZIP)
- 5,900
Population outlook (Otter Tail County) Hauer SSP2
- Today (2025)
- 58,183 people
- By 2030
- 58,267 · +0.1%
- By 2040
- 57,999 · -0.3%
- By 2050
- 57,183 · -1.7%
- By 2075
- 57,638 · -0.9%
- By 2100
- 54,697 · -6.0%
Race, ethnicity, and origin ACS 2023
- Neighborhood character
- Predominantly White (78%)
- Race & ethnicity
- White 78% Hispanic / Latino 13% Two or more races 8% Black 4%
- Hispanic origin (detail)
- Mexican 9% Puerto Rican 1%
- Common ancestry
- Portuguese 30% Scottish 2% Romanian 2%
- Foreign-born
- 9% · Canada
- Languages at home
- 87% English-only · Spanish 7% Russian/Polish/Slavic 1% German/W. Germanic 0%
Political lean MEDSL · Otter Tail
- 2024 margin
- Solid R (+34.2) · D 32.1% · R 66.3% · Other 1.6%
- 2008→2024 swing
- -21.3pp toward R · 2008: -12.9pp · 2024: -34.2pp
- All cycles
- 2024: R+34.2 2020: R+32.5 2016: R+35.9 2012: R+21.2 2008: R+12.9
Not yet ingested
- Civics
- —
Market trends
- HPI YoY
- ▼ -37.55%
- Current HPI
- 229.1081
- Rent YoY
- —
- Metro
- —
- State GDP YoY
- ▲ 2.41%
- F500 in state
- 34
Industry mix (Fortune 500 HQ in MN)
| Industry | F500 HQs | Revenue |
|---|---|---|
| Healthcare | 2 | $407B |
|
||
| Retail | 2 | $150B |
|
||
| Consumer Goods | 2 | $32B |
|
||
| Industrial Machinery | 2 | $6B |
|
||
| Agriculture | 1 | $40B |
|
||
| Healthcare / Medical Devices | 1 | $32B |
|
||
Price history
1 event — show timeline
- 2000-05-31 Sold (Public Records) $18,500 Public Records
Property tax history
+9.9%/yrLatest (2025): $1,138 · -30.9% YoY. Source: county tax records.
Cash-flow waterfall
monthlySold comps — $/sqft
last 12 mo · ≤1 miLoading sold comps…