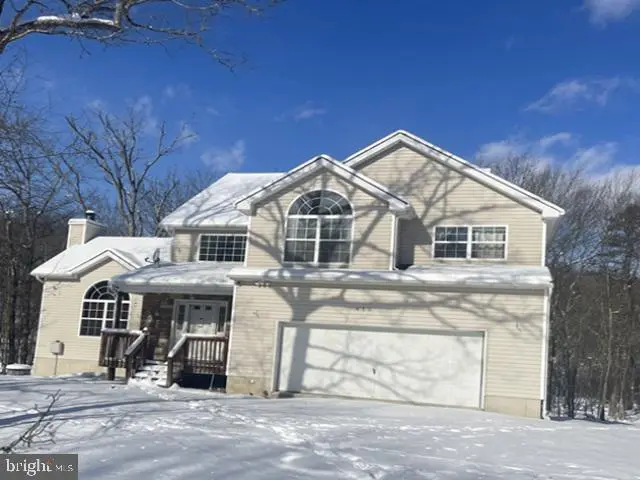
415 Underhill Dr · Lehman, PA
Flood risk 7/10 · Major
- FEMA flood zone
- X (unshaded)
- Chance of flooding over 30 yrs
- 0.99%
- Est. flood insurance / yr
- $473 – $860
Fire risk 5/10 · Moderate
- Est. fire insurance / yr
- $511 – $949
Heat risk 3/10 · Minor
- Hot days now (above 93°F)
- 7 days/yr
- Hot days in 30 yrs
- 15 days/yr
Wind risk 3/10 · Minor
- Chance of severe wind over 30 yrs
- 6.0%
Air-quality risk 2/10 · Minimal
- Unhealthy air days now
- 1 days/yr
- Unhealthy air days in 30 yrs
- 2 days/yr
Risk factors via First Street. Map © Google.
Why this score? — see what drove the D grade
The composite is a weighted blend of 9 inputs, each scored 0–100. Each bar is that input's sub-score; the figure is the points it added to the 100-point composite (weight × sub-score).
- ARV discount +13.9/15.0
- Cash flow +7.5/30.0
- Appreciation +6.8/10.0
- 1% rule +4.6/10.0
- Schools +3.0/10.0
- Rent growth +2.5/5.0
- Livability +2.5/5.0
- Condition / age +2.5/5.0
- DSCR +1.6/10.0
$249,240
🖨 Deal sheet (PDF) 📄 Offer letter ✓ Due diligence
Listing remarks
Built in 2007, this two story colonial home offers approximately 2260 finished square feet, three bedrooms, two full and one half bath, fireplace, unfinished basement, rear deck and attached two car garage. This home sits on an approximate 16117 sqft lot.
Key facts
- 0.37 acre lot
- 2 garage spots
- Built 2007
Property features AI
Finance
- Other: Lease not considered
- HOA & community: HOA fee of $177 (frequency unknown)
Exterior
- Parking: Attached covered garage with two spaces; Two total garage/parking spaces
- Utilities: Private well water; Private septic tank; Electric service (standard)
- Home design: Detached property; Asphalt shingle roof; Fee simple ownership
- Construction: Other foundation details; Year built (estimated)
- Exterior features: Not in a federal flood zone; No tidal water on the property; Other above-grade structures
Interior
- Bedrooms: Three bedrooms on the main level
- Bathrooms: Two full bathrooms; One half bathroom
- Heating & cooling: Forced air heating; Central air conditioning
- Interior features: Estimated living area; Unfinished basement; One fireplace
Neighborhood map
What this means for you Summary
Snapshot
- This is a 3-bed/2.5-bath single-family listed at $249k.
Deal economics
- At list price, monthly cash flow is $-368 ($-4k/yr) — negative.
- To cash-flow at today's rent, offer at most $184k (26.1% below list).
- To meet the 1% rule (rent ≥ 1% of price), the offer needs to be $240k (3.7% below list).
- Recommended offer: $184k (26.1% below list) — sets the bar for cash-flow.
Location & tenants
- Location reads: area grade D — affects rentability + tenant quality, not the cash-flow math above.
- East Stroudsburg Area SD (rural): math 25% / reading 43% proficiency, ranked #413 of 539 in PA (top 77%) — families likely to look elsewhere, expect single-tenant / working-renter base with shorter leases.
- Zoned schools: Bushkill El Sch (math 27% / reading 42%, grade F, #1,049 of 1,518 statewide, top 71%, 366 students, 70% FRL); Lehman Intermediate Sch (math 11% / reading 44%, grade F, #399 of 512 statewide, top 79%, 603 students, 59% FRL); East Stroudsburg Shs North (math 29% / reading 24%, grade F, #371 of 437 statewide, top 85%, 940 students, 54% FRL) — zoned schools average 61% FRL vs 42% district-wide (19 pts higher); higher-poverty schools than district average — tighter screening recommended.
- Market conditions: 293 active listings in the ZIP; 213 units permitted in Pike County in 2024 (0 in 5+ unit buildings).
Forward outlook
- In year one you build about $10k of equity ($2k loan paydown + $9k appreciation (3.5% local appreciation)).
- Pike County population projected at -25% by 2050 — secular population decline; favor cash flow + early exit over multi-decade hold.
- By year 4, paydown + projected appreciation supports a ~$35k cash-out refi (75% LTV) — recoverable capital for the next deal without selling this one.
Negotiation context
- It's been on market 30 days — a 2% lower offer ($246k) is reasonable based on typical stale-listing flexibility.
- 3 sale attempts with the ask held roughly flat each time — persistent listings suggest the price (not the market) is what's stuck; bring a comps-based counter.
Risks & watch-outs
- Watch-outs: property tax is 3.0% of price; flood insurance adds $56/mo.
- Climate carrying-cost: major flood risk; moderate wildfire risk — expect insurance premiums to compound above CPI over the hold.
Questions for the listing agent
- What do current leases actually rent for vs. the listed asking? Can we see a recent rent roll and the last 12 months of T-12 income?
- Property tax is high relative to price — has the assessment been appealed recently, and will the sale trigger a re-assessment?
- What's the actual annual flood-insurance premium (NFIP or private), and is the property in a SFHA with mandatory coverage?
- What does the HOA fee cover, when was the last increase, and are there any pending special assessments or reserve-fund shortfalls?
- Is there a deadline driving the sale (1031 exchange, divorce, estate, relocation)? That informs how much negotiation room exists.
- The area grade is low — what's the realistic commute time and amenity access for the typical tenant pool here? Any planned neighborhood developments (good or bad) we should know about?
- What's the average days-on-market for RENTAL listings here right now (not sales)? A rising rental-DOM trend means longer vacancies and softer asking-rent achievability than the comps imply.
- What's the recent tenant-quality profile in this submarket — average credit score on applications, eviction rate, late-payment / NSF rate, and stable-employment percentage? A property-management company in the area should have these aggregated.
- How much new for-sale + rental construction is in the pipeline within 1–3 miles? Heavy new supply typically softens prices + rents 12–24 months out; constrained supply supports both.
Investment metrics
- 1% rule
- 0.96% ✗
- Cap rate
- 4.79%
- Cash-on-cash
- -5.38%
- DSCR
- 0.76
- GRM
- 8.7
CMA / ARV
- ARV (median comp)
- $290,764
- List price
- $249,240
- Delta
- -7.83%
- Verdict
- FAIR
- Comps
- 20 within 1.0 mi
Show comp detail 9 sales within ~0.75 mi
| Address | Dist | Beds/Ba | Sqft | Sold | Price | $/sf | Match |
|---|---|---|---|---|---|---|---|
| 227 Ravenhill Rd | 0.56mi | 3/2.5 | 2,175 (-4%) | 13mo | $267,000 | $123 | 57 |
| 1020 Long Lake Rd | 0.64mi | 3/2.5 | 2,219 (-2%) | 17mo | $329,900 | $149 | 53 |
| 103 Old Took Dr | 0.43mi | 3/2.0 | 2,080 (-8%) | 14mo | $264,000 | $127 | 53 |
| 1106 Underhill Ct | 0.15mi | 4/2.5 (+1) | 2,004 (-11%) | 21mo | $329,000 | $164 | 52 |
| 216 Swartsburo Dr | 0.67mi | 3/2.5 | 2,196 (-3%) | 16mo | $313,660 | $143 | 51 |
| 143 Rivendell Dr | 0.12mi | 4/2.0 (+1) | 2,003 (-11%) | 23mo | $360,000 | $180 | 50 |
| 151 Oakenshield Dr | 0.41mi | 4/2.0 (+1) | 2,360 (+4%) | 22mo | $250,000 | $106 | 48 |
| 508 Kili Way | 0.53mi | 4/3.0 (+1) | 1,974 (-13%) | 6mo | $289,900 | $147 | 42 |
| 211 Bindale Rd | 0.54mi | 4/2.5 (+1) | 2,064 (-9%) | 22mo | $320,000 | $155 | 37 |
Match score weights: distance 35% · size 25% · config 20% · recency 20%. Top-matched comps best support the ARV.
Projected returns pro-forma
3.51% appreciation · 3.0% rent growth · sell at horizon
- IRR
- 3.3%
- Equity multiple
- 1.20×
- Total profit
- $13,685
- Equity at exit
- $119,238
- IRR
- 6.6%
- Equity multiple
- 2.06×
- Total profit
- $73,953
- Equity at exit
- $189,539
Cash invested: $69,787 (down + closing). Projections, not guarantees.
Landlord ↔ Tenant lean methodology
- Overall (STATE)
- 62 Landlord-Friendly
- State Pennsylvania
- 62 Landlord-Friendly · EVEN
- County
- — inherits STATE
- City
- — inherits STATE
ZIP-level market 18324
- Home prices YoY
- 1.5%
- Active inventory
- 293
- Price-to-rent
- 8.7×
Monthly cashflow live
- Estimated rent
- $2,400 medium interval (Pro) →
- Mortgage (P&I)
- −$1,307
- Tax from tax record
- −$620 /mo · $7,445/yr
- Insurance
- −$104
- Flood insurance flood zone
- −$56 /mo · $666/yr
- HOA
- −$177
- Vacancy / Maint / Mgmt
- −$504
- Net cashflow
- $-368
Break-even live
Sensitivity live
| Price | -10% $-227 | -5% $-298 | +0% $-368 | +5% $-439 | +10% $-509 |
|---|---|---|---|---|---|
| Rent | -10% $-558 | -5% $-463 | +0% $-368 | +5% $-273 | +10% $-179 |
| Rate | -1.0pp $-243 | -0.5pp $-305 | base $-368 | +0.5pp $-433 | +1.0pp $-498 |
UW: 25.0% down · 7.5% · 30yr · 1.5% tax · 5.0% vac · 8.0% maint · 8.0% mgmt
Financing live
Cash to close
- Down payment
- $62,310
- Closing costs
- $7,477
- Reserves months
- —
- Total cash needed
- —
Loan-product check · same deal, 3 products live
Conventional
25% down · 7.5% · 30yr
- Down + closing
- —
- Monthly P&I
- —
- Monthly cashflow
- —
- DSCR
- —
- Eligible?
- —
Personal DTI + credit; lowest rate.
DSCR
20% down · 8.5% · 30yr
- Down + closing
- —
- Monthly P&I
- —
- Monthly cashflow
- —
- DSCR
- —
- Eligible?
- —
No personal income docs; deal must DSCR.
Hard money
10% down · 12.0% · 12mo
- Down + closing
- —
- Monthly P&I
- —
- Monthly cashflow
- —
- DSCR
- —
- Eligible?
- —
Short-term bridge; refi at stabilization.
HOA detail
- Monthly dues
- $177 · $2,124/yr
Listing history 22 events
-
2026-06-21days on market $249,240 Active 30 DOM
-
2026-06-19days on market $249,240 Active 28 DOM
-
2026-06-18days on market $249,240 Active 27 DOM
-
2026-06-17days on market $249,240 Active 26 DOM
-
2026-06-16days on market $249,240 Active 25 DOM
-
2026-06-15days on market $249,240 Active 24 DOM
-
2026-06-14days on market $249,240 Active 22 DOM
-
2026-06-13days on market $249,240 Active 21 DOM
-
2026-06-10days on market $249,240 Active 19 DOM
-
2026-06-09days on market $249,240 Active 18 DOM
-
2026-06-08days on market $249,240 Active 17 DOM
-
2026-06-07days on market $249,240 Active 16 DOM
-
2026-06-05days on market $249,240 Active 13 DOM
-
2026-06-02days on market $249,240 Active 11 DOM
-
2026-06-01days on market $249,240 Active 10 DOM
-
2026-05-31days on market $249,240 Active 9 DOM
-
2026-05-30days on market $249,240 Active 8 DOM
-
2026-04-30status Active
-
2026-04-30status Pending
-
2026-04-27price $268,000
-
2026-02-11$291,200 Active
-
2007-04-03soldstatus $255,000
ⓘ Source: listings_history table (triggers on properties + properties_extension) + one-shot
backfill from property_details.listing_events for pre-trigger history.
Tax reassessment forecast PA · Partial reset (capped growth)
- Current annual tax
- $7,445 · $620/mo
- Projected year-2 tax
- $7,445 · $620/mo
- Expected delta
- $0/yr ($0/mo · 0.0%)
ⓘ Screening estimate from a state-policy table — verify with the county assessor before closing.
Climate risk First Street
- Flood 7/10 Severe FEMA zone X (unshaded) · 99% chance over 30 yrs
- Wildfire 5/10 Major
- Heat 3/10 Moderate 7 d/yr ≥93°F today · 15 d/yr by 30 yrs out
- Wind 3/10 Moderate 6% chance of damaging wind over 30 yrs
- Air quality 2/10 Low 1 unhealthy d/yr today · 2 by 30 yrs out
Nearby sold comps map
Loading sold comps map…
Walkable amenities ~0.75 mi
Loading nearby amenities…
Taxation est. · year 1
- Rental income
- $28,795
- − Mortgage interest
- −$13,961
- − Property taxes
- −$7,445
- − Insurance
- −$1,913
- − Repairs & maintenance
- −$2,304
- − Management
- −$2,304
- − HOA
- −$2,124
- − Depreciation
- −$7,251
- Taxable loss
- −$8,505
- Est. tax savings @ 24.0%
- +$2,041
- After-tax cash flow
- $-2,376/yr
For passive investors: Depreciation is non-cash, so a rental often shows a tax loss while cash-flowing — sheltering income. Rental losses are passive: they offset passive income freely, and up to $25,000/yr can offset ordinary (W-2) income if you actively participate and your MAGI is under $100k (phasing out to $0 by $150k); unused losses carry forward. On sale, claimed depreciation is recaptured at up to 25%, and gains may owe capital-gains tax (a 1031 exchange can defer both). Figures are a year-1 estimate at your 24.0% rate — not tax advice; consult a CPA.
Schools (NCES district)
- District
- East Stroudsburg Area SD
- NCES district ID
- 4208670
- Math proficiency
- 25% ▼ -11.00%
- Reading proficiency
- 43% ▼ -18.00%
- Median HH income
- $57,142
- Composite
- 30.13/100
- National rank
- #6332
- State rank
- #413 of 539 in PA
Livability — Lehman
No livability data for this city. (Only ~50 U.S. cities are tracked.)
Census & demographics
- Population (ZIP)
- 9,591
Population outlook (Pike County) Hauer SSP2
- Today (2025)
- 53,548 people
- By 2030
- 51,622 · -3.6%
- By 2040
- 46,490 · -13.2%
- By 2050
- 40,372 · -24.6%
- By 2075
- 31,951 · -40.3%
- By 2100
- 26,821 · -49.9%
Race, ethnicity, and origin ACS 2023
- Neighborhood character
- Diverse neighborhood (Simpson 0.67)
- Race & ethnicity
- White 47% Hispanic / Latino 26% Black 21% Two or more races 12% Asian 1%
- Hispanic origin (detail)
- Mexican 1% Puerto Rican 12% Cuban 3% Dominican 5%
- Common ancestry
- Romanian 2% Estonian 1% Lithuanian 1%
- Foreign-born
- 19% · Canada, South Korea
- Languages at home
- 69% English-only · Spanish 19% Russian/Polish/Slavic 4% French/Haitian/Cajun 3%
Political lean MEDSL · Pike
- 2024 margin
- Strong R (+24.1) · D 37.6% · R 61.6%
- 2008→2024 swing
- -19.8pp toward R · 2008: -4.2pp · 2024: -24.1pp
- All cycles
- 2024: R+24.1 2020: R+19.0 2016: R+26.0 2012: R+11.0 2008: R+4.2
Not yet ingested
- Civics
- —
Market trends
- HPI YoY
- ▲ 3.51%
- Current HPI
- 243.6754
- Rent YoY
- —
- Metro
- —
- State GDP YoY
- ▲ 1.68%
- F500 in state
- 34
Industry mix (Fortune 500 HQ in PA)
| Industry | F500 HQs | Revenue |
|---|---|---|
| Healthcare | 2 | $309B |
|
||
| Insurance | 2 | $27B |
|
||
| Telecommunications / Media | 1 | $124B |
|
||
| Industrial Distribution | 1 | $22B |
|
||
| Financial Services | 1 | $20B |
|
||
| Chemicals / Materials | 1 | $18B |
|
||
Price history
-2.3% since first listed6 events — show timeline
- 2026-05-22 Listed $249,240 BRIGHT MLS
- 2026-04-30 Relisted — PMAR
- 2026-04-30 Pending — PMAR
- 2026-04-27 Price Changed $268,000 PMAR
- 2026-02-11 Listed $291,200 PMAR
- 2007-04-03 Sold (Public Records) $255,000 Public Records
Property tax history
+1.0%/yrLatest (2026): $7,445 · +1.6% YoY. Source: county tax records.
Cash-flow waterfall
monthlySold comps — $/sqft
last 12 mo · ≤1 miLoading sold comps…