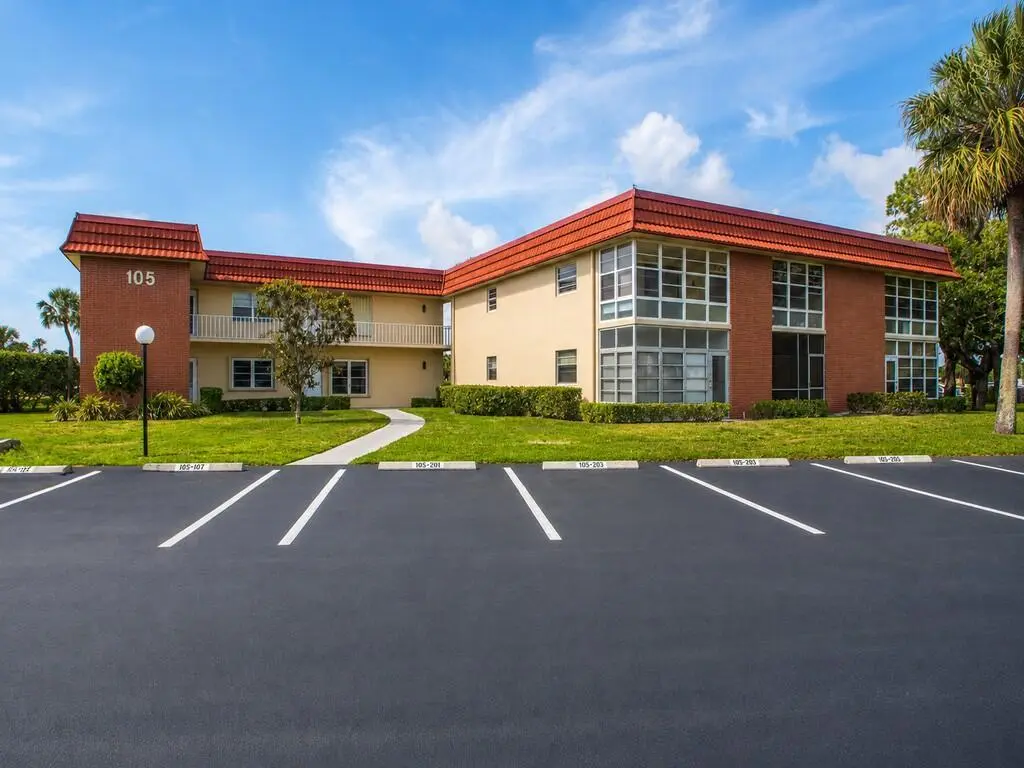
105 Spring Lake Ct #102 · Florida Ridge, FL
Flood risk 9/10 · Severe
- FEMA flood zone
- X (shaded)
- Chance of flooding over 30 yrs
- 0.99%
- Est. flood insurance / yr
- $507 – $1,088
Fire risk 3/10 · Minor
- Est. fire insurance / yr
- $947 – $1,759
Heat risk 10/10 · Severe
- Hot days now (above 106°F)
- 7 days/yr
- Hot days in 30 yrs
- 24 days/yr
Wind risk 10/10 · Severe
- Chance of severe wind over 30 yrs
- 99.0%
Air-quality risk 1/10 · Minimal
- Unhealthy air days now
- 0 days/yr
- Unhealthy air days in 30 yrs
- 0 days/yr
Risk factors via First Street. Map © Google.
Why this score? — see what drove the D grade
The composite is a weighted blend of 9 inputs, each scored 0–100. Each bar is that input's sub-score; the figure is the points it added to the 100-point composite (weight × sub-score).
- Cash flow +11.5/30.0
- 1% rule +8.0/10.0
- ARV discount +7.5/15.0
- Schools +4.2/10.0
- Livability +3.6/5.0
- Rent growth +3.5/5.0
- DSCR +3.4/10.0
- Condition / age +2.5/5.0
- Appreciation +0.0/10.0
$133,900
🖨 Deal sheet 📄 Offer letter ✓ Due diligence
Listing remarks MLS
Love golf? Active 55+ community features three 9-hole golf courses, 4 clubhouses/heated pools, tennis, pickleball, bocce, shuffleboard, fitness/exercise rooms & social activities. Over 3 miles of private roads for biking/walking. Located only 10 minutes from one of the Treasure Coasts “Best Voted Beaches. ” Lovingly maintained desirable 1st floor corner unit, serene garden views in the front, expansive golf course views in the back. Impact windows, accordion shutters, 2024 AC, 2024 HWH, 2021 Roof. Conveniently located to everything “Vero. ” Please note - 1 or more photos are virtually staged.
Key facts
- Heated pools
- Accordion shutters
- Fitness rooms
Tags
Property features AI
Finance
- Other: Senior community
- HOA & community: Part of Vista Royale Association; Monthly HOA fee covers cable TV, internet, grounds and structure maintenance, sewer, trash, water, common areas, reserve funds, roof repairs, recreation facility and pool service; Association amenities include clubhouse, fitness center, pool, spa/hot tub, tennis, pickleball, bocce, shuffleboard, billiard and game rooms, library, hobby/workshop rooms, cafe/restaurant, manager on site, laundry, storage, parking, recreation facilities, internet included and more
Exterior
- Parking: Assigned parking; Guest parking; Asphalt parking; Total 1 parking space
- Utilities: Public water; Public sewer; Electricity available; Cable available; Sewer connected; Water available
- Home design: Condominium; Resale property; 2-story building; Entry level: 1; Faces north
- Construction: Brick and concrete construction; Other roof
- Exterior features: Screened porch; Porch; Asphalt paved road access; Not waterfront
Interior
- Kitchen: Dishwasher; Disposal; Electric range; Microwave; Refrigerator; Electric water heater (owned)
- Bedrooms: 2 main-level bedrooms
- Flooring: Carpet; Laminate
- Bathrooms: 2 full bathrooms (main level)
- Heating & cooling: Central heating (electric, heat pump); Central air; Ceiling fans; Electric cooling with humidity control
- Interior features: No notable interior features listed; Furnishing negotiable
- Laundry & utility: Laundry available in association amenities
Neighborhood map
What this means for you Summary
Snapshot
- This is a 2-bed/2.0-bath condo listed at $134k.
Deal economics
- At list price, monthly cash flow is $-110 ($-1k/yr) — negative.
- To cash-flow at today's rent, offer at most $114k (14.5% below list).
- Meets the 1% rule at list price ($2k rent vs $134k).
- Recommended offer: $114k (14.5% below list) — sets the bar for cash-flow.
- Cap rate 5.9% vs local median 4.5% in Florida Ridge — top-decile yield for the area; either an underpriced asset or a hidden risk that comps aren't pricing in. Stress-test before assuming the spread holds.
Location & tenants
- Location reads 72/100 on livability (#353 in FL) — a middle-class / working-renter tenant base. Strengths: commute A+, cost of living A+, housing A+; Watch: employment D, amenities F, health & safety D-.
- Indian River (other): math 48% / reading 52% proficiency, ranked #35 of 73 in FL (top 48%) — acceptable for families but not a draw, mixed tenant base, ~2y average lease.
- Zoned schools: Vero Beach Elementary School (math 39% / reading 36%, grade F, #1,596 of 2,144 statewide, top 75%, 599 students, 80% FRL); Oslo Middle School (math 39% / reading 45%, grade D-, #340 of 571 statewide, top 61%, 864 students, 72% FRL); Vero Beach High School (math 28% / reading 43%, grade F, #367 of 667 statewide, top 57%, 2,847 students, 50% FRL).
- Market conditions: Rents rising fast (+4.2%/yr); 348 active listings in the ZIP; 40 comparable units currently listed for rent nearby; rentals at typical pace (median 21d on market — plan ~3-4 weeks tenant-placement turnaround); 564 units permitted in Indian River County in 2024 (281 in 5+ unit buildings).
- This rent runs 31% of the median local income ($67k/yr) — at the standard rent-burdened threshold; future hikes will face affordability resistance.
Forward outlook
- Local home prices are declining (-3.0%/yr); year-one equity from $926 of loan paydown is wiped out by about $4k of value loss. Plan a longer hold.
- Indian River County population projected at +18% by 2050 — long-run rental-demand tailwind backs the buy-and-hold thesis.
Negotiation context
- It's been on market 17 days — a 2% lower offer ($132k) is reasonable based on typical stale-listing flexibility.
- 2 sale attempts with the ask held roughly flat each time — persistent listings suggest the price (not the market) is what's stuck; bring a comps-based counter.
- Current owner paid $56k; list at $134k implies a 139% gain — meaningful room to come down on a strong offer.
Risks & watch-outs
- Watch-outs: flood insurance adds $66/mo; HOA is 36% of rent.
- Climate carrying-cost: severe flood risk; severe wind risk, 99% chance of damaging wind over 30y; extreme-heat days projected 7→24/yr by 2055 (HVAC capex compounding) — expect insurance premiums to compound above CPI over the hold.
Questions for the listing agent
- What do current leases actually rent for vs. the listed asking? Can we see a recent rent roll and the last 12 months of T-12 income?
- Built in 1979 — when were the roof, HVAC, electrical panel, plumbing, and water heater last replaced?
- What's the actual annual flood-insurance premium (NFIP or private), and is the property in a SFHA with mandatory coverage?
- What does the HOA fee cover, when was the last increase, and are there any pending special assessments or reserve-fund shortfalls?
- Any open or pending special assessments — roof, HVAC, plumbing, elevator, façade? What's the per-unit balance and payoff schedule, and is the seller paying it off at close or rolling it to the buyer?
- Is there a deadline driving the sale (1031 exchange, divorce, estate, relocation)? That informs how much negotiation room exists.
- Schools are D-rated, which usually means shorter tenancies and higher turnover. Who's the typical renter profile here, and what's been the actual vacancy rate?
- The area grade is low — what's the realistic commute time and amenity access for the typical tenant pool here? Any planned neighborhood developments (good or bad) we should know about?
- What's the average days-on-market for RENTAL listings here right now (not sales)? A rising rental-DOM trend means longer vacancies and softer asking-rent achievability than the comps imply.
- What's the recent tenant-quality profile in this submarket — average credit score on applications, eviction rate, late-payment / NSF rate, and stable-employment percentage? A property-management company in the area should have these aggregated.
- How much new apartment / multifamily construction is in the pipeline within 1–3 miles? Heavy new supply (>2% of stock underway) typically softens rents 12–24 months out; light construction supports rent growth.
Investment metrics
- 1% rule
- 1.30% ✓
- Cap rate
- 5.90%
- Cash-on-cash
- -1.40%
- DSCR
- 0.94
- GRM
- 6.4
CMA / ARV
No comps found within radius.
Projected returns pro-forma
-3.0% appreciation · 4.18% rent growth · sell at horizon
- IRR
- -19.7%
- Equity multiple
- 0.30×
- Total profit
- $-26,246
- Equity at exit
- $19,965
- IRR
- -8.4%
- Equity multiple
- 0.42×
- Total profit
- $-21,560
- Equity at exit
- $11,577
Cash invested: $37,492 (down + closing). Projections, not guarantees.
Landlord ↔ Tenant lean methodology
- Overall (STATE)
- 87 Strongly Landlord-Friendly
- State Florida
- 87 Strongly Landlord-Friendly · R+3
- County
- — inherits STATE
- City
- — inherits STATE
ZIP-level market 32962
- Rents YoY
- 4.2%
- Active inventory
- 348
- Price-to-rent
- 6.4×
Monthly cashflow live
- Estimated rent
- $1,746 high interval (Pro) →
- Mortgage (P&I)
- −$702
- Tax from tax record
- −$43 /mo · $517/yr
- Insurance
- −$56
- Flood insurance flood zone
- −$66 /mo · $798/yr
- HOA
- −$622
- Vacancy / Maint / Mgmt
- −$367
- Net cashflow
- $-110
Break-even live
UW: 25.0% down · 7.5% · 30yr · 1.5% tax · 5.0% vac · 8.0% maint · 8.0% mgmt
Financing live
Cash to close
- Down payment
- $33,475
- Closing costs
- $4,017
- Reserves months
- —
- Total cash needed
- —
Loan-product check · same deal, 3 products live
Conventional
25% down · 7.5% · 30yr
- Down + closing
- —
- Monthly P&I
- —
- Monthly cashflow
- —
- DSCR
- —
- Eligible?
- —
Personal DTI + credit; lowest rate.
DSCR
20% down · 8.5% · 30yr
- Down + closing
- —
- Monthly P&I
- —
- Monthly cashflow
- —
- DSCR
- —
- Eligible?
- —
No personal income docs; deal must DSCR.
Hard money
10% down · 12.0% · 12mo
- Down + closing
- —
- Monthly P&I
- —
- Monthly cashflow
- —
- DSCR
- —
- Eligible?
- —
Short-term bridge; refi at stabilization.
Rent comps 40 comps
| Address | Beds | Baths | Sqft | Rent | $/sqft | DOM | Units | Dist |
|---|---|---|---|---|---|---|---|---|
| 103 Royal Oak Dr #106 Vero Beach, FL | 2.0 | 2.0 | 1000 | $1,800 | $1.80 | 13d | 1 | 0.02mi |
| 102 Royal Oak Dr #105 Vero Beach, FL | 1.0 | 1.5 | 750 | $1,550 | $2.07 | 20d | 1 | 0.08mi |
| 80 Crooked Tree Ln #106 Vero Beach, FL | 2.0 | 2.0 | 1000 | $1,900 | $1.90 | 13d | 1 | 0.09mi |
| 85 Crooked Tree Ln #203 Vero Beach, FL | 1.0 | 1.5 | 750 | $1,450 | $1.93 | 20d | 1 | 0.18mi |
| 86 Crooked Tree Ln #102 Vero Beach, FL | 2.0 | 2.0 | 1000 | $2,000 | $2.00 | 13d | 1 | 0.19mi |
| 95 Spring Lake Dr #103 Vero Beach, FL | 1.0 | 1.5 | 750 | $1,600 | $2.13 | 20d | 1 | 0.21mi |
| 65 Woodland Dr #207 Vero Beach, FL | 2.0 | 2.0 | 1000 | $1,600 | $1.60 | 20d | 1 | 0.23mi |
| 58 Woodland Dr #206 Vero Beach, FL | 2.0 | 2.0 | 1000 | $1,800 | $1.80 | 13d | 1 | 0.32mi |
| 50 Woodland Dr #203 Vero Beach, FL | 1.0 | 1.5 | 750 | $1,350 | $1.80 | 13d | 1 | 0.32mi |
| 43 Vista Gardens Trl #205 Vero Beach, FL | 1.0 | 1.5 | 750 | $1,450 | $1.93 | 20d | 1 | 0.47mi |
| 23 Vista Gardens Trl #203 Vero Beach, FL | 1.0 | 1.5 | 750 | $1,500 | $2.00 | 20d | 1 | 0.48mi |
| 37 Pine Arbor Ln #101 Vero Beach, FL | 2.0 | 2.0 | 1000 | $1,600 | $1.60 | 13d | 1 | 0.57mi |
| 26 Vista Gardens Trl #203 Vero Beach, FL | 1.0 | 1.5 | 750 | $1,350 | $1.80 | 20d | 1 | 0.57mi |
| 36 Pine Arbor Ln Vero Beach, FL | 2.0 | 2.0 | 1000 | $1,550 | $1.55 | 20d | 2 | 0.57mi |
| 5 Vista Palm Ln #203 Vero Beach, FL | 1.0 | 1.5 | 750 | $1,500 | $2.00 | 13d | 1 | 0.59mi |
| 34 Vista Gardens Trl #107 Vero Beach, FL | 2.0 | 2.0 | 1000 | $1,350 | $1.35 | 20d | 1 | 0.60mi |
| 36 Vista Gardens Trl #201 Vero Beach, FL | 2.0 | 2.0 | 1000 | $1,390 | $1.39 | 20d | 1 | 0.60mi |
| 28 Vista Gardens Trl #102 Vero Beach, FL | 2.0 | 2.0 | 1000 | $1,550 | $1.55 | 20d | 1 | 0.61mi |
| 35 Vista Gardens Trl #205 Vero Beach, FL | 1.0 | 1.5 | 934 | $1,400 | $1.50 | 20d | 1 | 0.62mi |
| 4 Vista Gardens Trl #207 Vero Beach, FL | 2.0 | 2.0 | 1000 | $1,550 | $1.55 | 13d | 1 | 0.65mi |
| 11 Vista Gardens Trl #106 Vero Beach, FL | 2.0 | 2.0 | 1000 | $1,600 | $1.60 | 20d | 1 | 0.65mi |
| 161 6th Ct SW Vero Beach, FL | 2.0 | 1.0 | 1298 | $1,590 | $1.22 | 13d | 1 | 0.68mi |
| 28 Pine Arbor Ln #103 Vero Beach, FL | 1.0 | 1.5 | 750 | $1,200 | $1.60 | 20d | 1 | 0.74mi |
| 528 7th Sq #102 Vero Beach, FL | 2.0 | 2.0 | 1095 | $3,000 | $2.74 | 20d | 1 | 0.76mi |
| 16 Vista Palm Ln Vero Beach, FL | 1.0–2.0 | 1.5–2.0 | 800 | $1,700 | $2.12 | 20d | 2 | 0.80mi |
| 19 Pine Arbor Ln #105 Vero Beach, FL | 1.0 | 1.5 | 750 | $1,800 | $2.40 | 20d | 1 | 0.80mi |
| 355 6th Rd SW Vero Beach, FL | 3.0 | 1.0 | 880 | $1,800 | $2.05 | 20d | 1 | 0.82mi |
| 855 6th Ave Vero Beach, FL | 2.0 | 2.0 | 1194 | $1,950 | $1.63 | 13d | 1 | 1.01mi |
| 340 E Waverly Pl Unit 6D Vero Beach, FL | 1.0 | 1.5 | 1200 | $1,000 | $0.83 | 20d | 1 | 1.02mi |
| 400 E Waverly Pl Unit 2b Vero Beach, FL | 2.0 | 2.5 | 1170 | $1,900 | $1.62 | 20d | 1 | 1.04mi |
| 734 5th Pl SW Vero Beach, FL | 3.0 | 1.0 | 1402 | $1,800 | $1.28 | 20d | 1 | 1.05mi |
| 710 Timber Ridge Trl SW Vero Beach, FL | 3.0 | 2.0 | 1498 | $2,500 | $1.67 | 20d | 1 | 1.09mi |
| 1041 Normandie Way Vero Beach, FL | 2.0 | 2.0 | 1178 | $2,100 | $1.78 | 13d | 1 | 1.12mi |
| 650 N Center Ct SW Unit 102 Vero Beach, FL | 3.0 | 2.0 | 1440 | $2,100 | $1.46 | 20d | 1 | 1.15mi |
| 263 Provence Pl Vero Beach, FL | 2.0 | 2.5 | 1364 | $3,500 | $2.57 | 20d | 1 | 1.18mi |
| 1166 6th Ave Unit D Vero Beach, FL | 2.0 | 2.0 | 1140 | $2,000 | $1.75 | 20d | 1 | 1.23mi |
| 1166 6th Ave Vero Beach, FL | 2.0 | 2.0 | 1140 | $2,200 | $1.93 | 13d | 1 | 1.23mi |
| 1135 3rd Ave #101 Vero Beach, FL | 2.0 | 2.0 | 906 | $1,800 | $1.99 | 20d | 1 | 1.23mi |
| 721 Timber Ridge Trl SW Unit D Vero Beach, FL | 2.0 | 2.0 | 1368 | $2,300 | $1.68 | 20d | 1 | 1.28mi |
| 1170 6th Ave Unit 2D Vero Beach, FL | 2.0 | 2.5 | 1170 | $1,800 | $1.54 | 13d | 1 | 1.28mi |
HOA detail condo
- Monthly dues
- $622 · $7,464/yr
- Likely covers
- pool
- Assessments
- None detected in remarks — confirm with the listing agent.
Listing history 14 events
-
2026-06-19days on market $133,900 Active 17 DOM
-
2026-06-18days on market $133,900 Active 16 DOM
-
2026-06-17days on market $133,900 Active 15 DOM
-
2026-06-16days on market $133,900 Active 14 DOM
-
2026-06-15days on market $133,900 Active 13 DOM
-
2026-06-14days on market $133,900 Active 11 DOM
-
2026-06-13days on market $133,900 Active 10 DOM
-
2026-06-10days on market $133,900 Active 8 DOM
-
2026-06-09days on market $133,900 Active 7 DOM
-
2026-06-08days on market $133,900 Active 6 DOM
-
2026-06-07days on market $133,900 Active 5 DOM
-
2026-06-05days on market $133,900 Active 2 DOM
-
2026-06-03remarks 601-char remark
-
2026-06-03$133,900 Active 1 DOM
ⓘ Source: listings_history table (triggers on properties + properties_extension) + one-shot
backfill from property_details.listing_events for pre-trigger history.
Tax reassessment forecast FL · Resets to sale price
- Current annual tax
- $517 · $43/mo
- Projected year-2 tax
- $1,111 · $93/mo
- Expected delta
- +$594/yr (+$50/mo · 114.8%)
ⓘ Screening estimate from a state-policy table — verify with the county assessor before closing.
Climate risk First Street
- Flood 9/10 Extreme FEMA zone X (shaded) · 99% chance over 30 yrs
- Wildfire 3/10 Moderate
- Heat 10/10 Extreme 7 d/yr ≥106°F today · 24 d/yr by 30 yrs out
- Wind 10/10 Extreme 99% chance of damaging wind over 30 yrs
- Air quality 1/10 Low 0 unhealthy d/yr today · 0 by 30 yrs out
Nearby sold comps map
Loading sold comps map…
Walkable amenities ~0.75 mi
Loading nearby amenities…
Taxation est. · year 1
- Rental income
- $20,952
- − Mortgage interest
- −$7,500
- − Property taxes
- −$517
- − Insurance
- −$1,467
- − Repairs & maintenance
- −$1,676
- − Management
- −$1,676
- − HOA
- −$7,464
- − Depreciation
- −$3,895
- Taxable loss
- −$3,244
- Est. tax savings @ 24.0%
- +$779
- After-tax cash flow
- $-544/yr
For passive investors: Depreciation is non-cash, so a rental often shows a tax loss while cash-flowing — sheltering income. Rental losses are passive: they offset passive income freely, and up to $25,000/yr can offset ordinary (W-2) income if you actively participate and your MAGI is under $100k (phasing out to $0 by $150k); unused losses carry forward. On sale, claimed depreciation is recaptured at up to 25%, and gains may owe capital-gains tax (a 1031 exchange can defer both). Figures are a year-1 estimate at your 24.0% rate — not tax advice; consult a CPA.
Schools (NCES district)
- District
- Indian River
- NCES district ID
- 1200930
- Math proficiency
- 48% ▼ -9.00%
- Reading proficiency
- 52% ▼ -3.00%
- Median HH income
- $46,597
- Composite
- 42.45/100
- National rank
- #3218
- State rank
- #35 of 73 in FL
Livability — Florida Ridge
- Score
- 72/100
- State rank
- #353
- US rank
- #6129
Category grades
Schools grade is shown separately in the Schools card above.
Census & demographics
- Census place
- Florida Ridge, FL
- County
- Indian River County · 143,738 people
- City population
- 25,629
- Metro
- Sebastian-Vero Beach, FL
- Population (ZIP)
- 25,522
- Household income
- $66,664
- Rent vs Own
- Severe rent burden
- 425.0
Population outlook (Indian River County) Hauer SSP2
- Today (2025)
- 165,104 people
- By 2030
- 172,869 · +4.7%
- By 2040
- 185,640 · +12.4%
- By 2050
- 194,465 · +17.8%
- By 2075
- 211,115 · +27.9%
- By 2100
- 211,781 · +28.3%
Race, ethnicity, and origin ACS 2023
- Neighborhood character
- Predominantly White (70%)
- Race & ethnicity
- White 70% Black 13% Hispanic / Latino 12% Two or more races 5% Native American 1%
- Hispanic origin (detail)
- Mexican 1% Puerto Rican 2% Cuban 1%
- Common ancestry
- Romanian 4% Lithuanian 4% Italian 3%
- Foreign-born
- 12% · Canada, Jamaica, Dominican Republic
- Languages at home
- 85% English-only · Spanish 9% Other Indo-European 2% French/Haitian/Cajun 1%
Political lean MEDSL · Indian River
- 2024 margin
- Strong R (+27.4) · D 36.0% · R 63.4%
- 2008→2024 swing
- -12.5pp toward R · 2008: -14.8pp · 2024: -27.4pp
- All cycles
- 2024: R+27.4 2020: R+21.6 2016: R+24.5 2012: R+22.3 2008: R+14.8
Not yet ingested
- Civics
- —
Market trends
- HPI YoY
- ▼ -182.13%
- Current HPI
- 333.3274
- Rent YoY
- ▲ 4.18%
- Metro
- Sebastian-Vero Beach, FL
- State GDP YoY
- ▲ 3.28%
- F500 in state
- 36
Industry mix (Fortune 500 HQ in FL)
| Industry | F500 HQs | Revenue |
|---|---|---|
| Industrial Technology | 2 | $29B |
|
||
| Insurance | 2 | $17B |
|
||
| Retail | 1 | $60B |
|
||
| Technology Distribution | 1 | $58B |
|
||
| Homebuilding | 1 | $35B |
|
||
| Technology Manufacturing | 1 | $35B |
|
||
Price history
+145.7% since first listed4 events — show timeline
- 2026-06-02 Listed $133,900 Beaches MLS
- 2026-06-02 Listed $133,900 RAIRCMLS
- 1997-08-11 Sold (Public Records) $56,000 Public Records
- 1995-04-05 Sold (Public Records) $54,500 Public Records
Property tax history
-3.3%/yrLatest (2025): $517 · +5.4% YoY. Source: county tax records.
Cash-flow waterfall
monthlySold comps — $/sqft
last 12 mo · ≤1 miLoading sold comps…