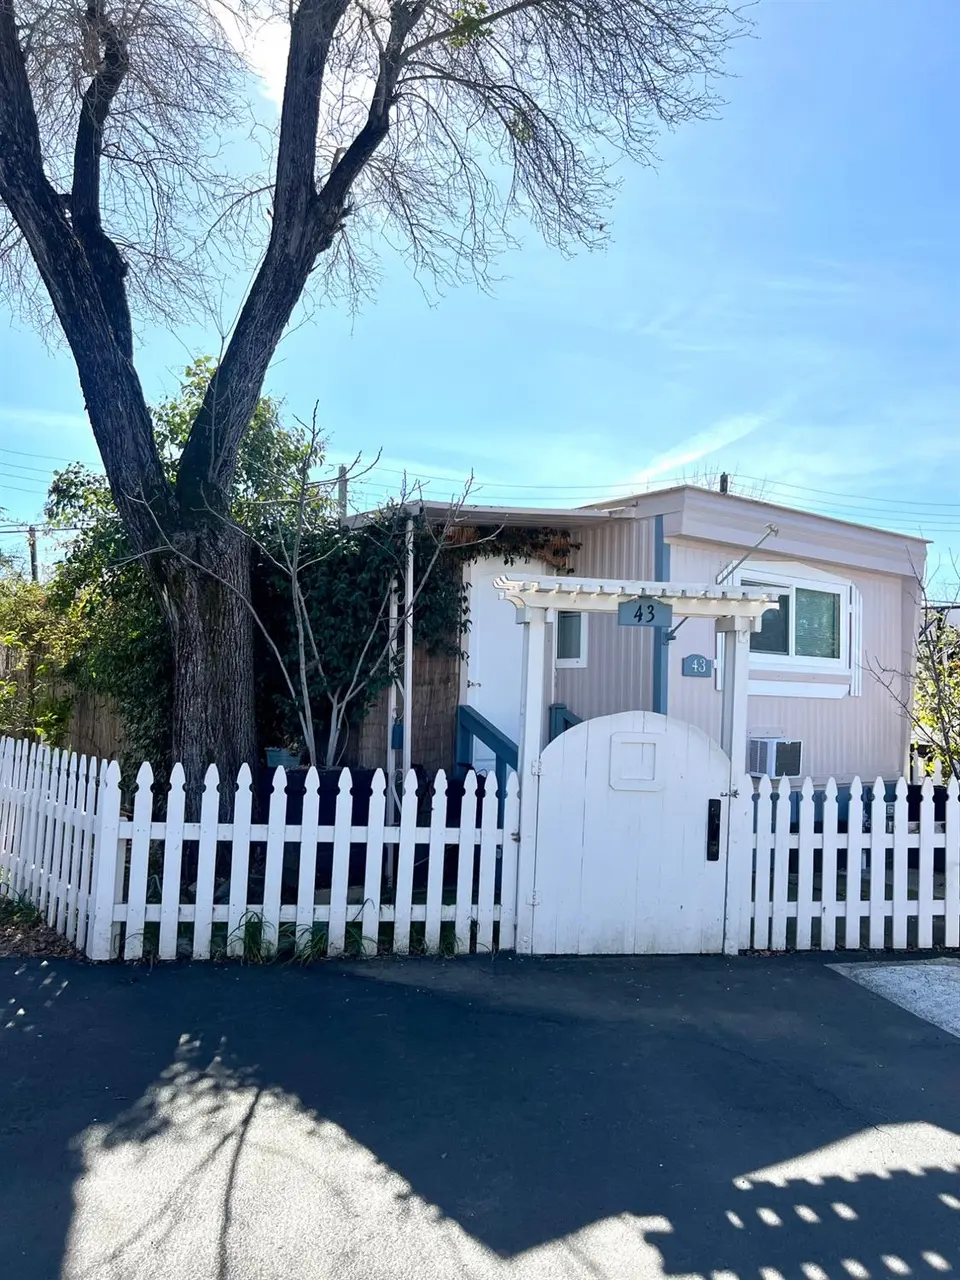
6132 Main Ave #43 · Orangevale, CA
Flood risk 1/10 · Minimal
- FEMA flood zone
- X (unshaded)
- Chance of flooding over 30 yrs
- 0.0%
- Est. flood insurance / yr
- $507 – $1,088
Fire risk 1/10 · Minimal
- Est. fire insurance / yr
- $659 – $1,223
Heat risk 7/10 · Major
- Hot days now (above 103°F)
- 7 days/yr
- Hot days in 30 yrs
- 16 days/yr
Wind risk 1/10 · Minimal
- Chance of severe wind over 30 yrs
- —
Air-quality risk 10/10 · Severe
- Unhealthy air days now
- 30 days/yr
- Unhealthy air days in 30 yrs
- 38 days/yr
Risk factors via First Street. Map © Google.
Why this score? — see what drove the B+ grade
The composite is a weighted blend of 9 inputs, each scored 0–100. Each bar is that input's sub-score; the figure is the points it added to the 100-point composite (weight × sub-score).
- Cash flow +30.0/30.0
- ARV discount +15.0/15.0
- 1% rule +10.0/10.0
- DSCR +10.0/10.0
- Schools +4.4/10.0
- Rent growth +3.0/5.0
- Livability +3.0/5.0
- Condition / age +2.5/5.0
- Appreciation +0.0/10.0
$60,000
🖨 Deal sheet 📄 Offer letter ✓ Due diligence
Listing remarks
Come check out this well maintained 2-3 bedroom 1 bath mobile home in a 55+ park. Featuring dual pane windows, laminate and carpet flooring, updated bathroom, fresh paint, central heat and air, roof 2025, shed in backyard. Refrigerator and furniture are included. This home has lots of potential!
Key facts
- Carpet flooring
- Laminate flooring
- Fresh paint
Tags
Neighborhood map
What this means for you Summary
Snapshot
- This is a 2-bed/1.0-bath manufactured listed at $60k.
Deal economics
- At list price, monthly cash flow is $1k ($12k/yr) — positive.
- The deal already cash-flows at list — no discount required.
- Meets the 1% rule at list price ($2k rent vs $60k).
- Recommended offer: $55k (9.0% below list) — sets the bar for market timing.
- Cap rate 26.6% vs local median 2.8% in Orangevale — top-decile yield for the area; either an underpriced asset or a hidden risk that comps aren't pricing in. Stress-test before assuming the spread holds.
Location & tenants
- Location reads 59/100 on livability (#635 in CA) — a working-class tenant base; expect higher turnover. Strengths: housing A+, employment A; Watch: crime F, amenities F, commute F.
- San Juan Unified (suburban): math 40% / reading 62% proficiency, ranked #138 of 517 in CA (top 27%) — acceptable for families but not a draw, mixed tenant base, ~2y average lease.
- Market conditions: Rents rising (+1.9%/yr); 127 active listings in the ZIP; 20 comparable units currently listed for rent nearby; rentals leasing fast (median 13d on market — plan ~1-2 weeks tenant-placement turnaround); solid renter incomes; 6,825 units permitted in Sacramento County in 2024 (1,752 in 5+ unit buildings).
Forward outlook
- Local home prices are declining (-3.0%/yr); year-one equity from $415 of loan paydown is wiped out by about $2k of value loss. Plan a longer hold.
- Sacramento County population projected at +17% by 2050 — long-run rental-demand tailwind backs the buy-and-hold thesis.
- At projected returns (-3.0% appreciation + 1.9% rent growth), your $17k cash investment doubles in ~2 years — after that, you're playing with house money.
Negotiation context
- It's been on market 105 days — a 9% lower offer ($55k) is reasonable based on typical stale-listing flexibility.
Risks & watch-outs
- Climate carrying-cost: extreme-heat days projected 7→16/yr by 2055 (HVAC capex compounding) — expect insurance premiums to compound above CPI over the hold.
Questions for the listing agent
- It's been on market 105 days. Have you received any prior offers? Is the seller open to a 9% concession, seller financing, or rate buy-down credit?
- Built in 1966 — when were the roof, HVAC, electrical panel, plumbing, and water heater last replaced?
- Why hasn't it sold? Are there any deal-killer items the seller is aware of (foundation, flood, title, zoning, code violations)?
- Is there a deadline driving the sale (1031 exchange, divorce, estate, relocation)? That informs how much negotiation room exists.
- Schools are B-rated — typically a magnet for longer-tenancy family renters. What's the average tenant stay here, and is there a school-zone premium baked into asking?
- Crime grade is F in this area — have there been break-ins, vandalism, or insurance claims at this property in the last 3 years? What carrier currently insures it and at what premium?
- What's the average days-on-market for RENTAL listings here right now (not sales)? A rising rental-DOM trend means longer vacancies and softer asking-rent achievability than the comps imply.
- What's the recent tenant-quality profile in this submarket — average credit score on applications, eviction rate, late-payment / NSF rate, and stable-employment percentage? A property-management company in the area should have these aggregated.
- How much new for-sale + rental construction is in the pipeline within 1–3 miles? Heavy new supply typically softens prices + rents 12–24 months out; constrained supply supports both.
Investment metrics
- 1% rule
- 3.02% ✓
- Cap rate
- 26.64%
- Cash-on-cash
- 72.68%
- DSCR
- 4.23
- GRM
- 2.8
CMA / ARV
- ARV (median comp)
- $78,947
- List price
- $60,000
- Delta
- -24.00%
- Verdict
- UNDERPRICED
- Comps
- 13 within 1.0 mi
Show comp detail 1 sale within ~0.75 mi
| Address | Dist | Beds/Ba | Sqft | Sold | Price | $/sf | Match |
|---|---|---|---|---|---|---|---|
| 9340 Orangevale Ave #36 | 0.36mi | 2/1.0 | 840 (-1%) | 6mo | $90,000 | $107 | 76 |
Match score weights: distance 35% · size 25% · config 20% · recency 20%. Top-matched comps best support the ARV.
Projected returns pro-forma
-3.0% appreciation · 1.94% rent growth · sell at horizon
- IRR
- 71.2%
- Equity multiple
- 4.17×
- Total profit
- $53,200
- Equity at exit
- $8,946
- IRR
- 74.8%
- Equity multiple
- 8.27×
- Total profit
- $122,202
- Equity at exit
- $5,188
Cash invested: $16,800 (down + closing). Projections, not guarantees.
Landlord ↔ Tenant lean methodology
- Overall (STATE)
- 18 Strongly Tenant-Friendly
- State California
- 18 Strongly Tenant-Friendly · D+13
- County
- — inherits STATE
- City
- — inherits STATE
ZIP-level market 95662
- Rents YoY
- 1.9%
- Active inventory
- 127
- Price-to-rent
- 2.8×
Monthly cashflow live
- Estimated rent
- $1,813 high interval (Pro) →
- Mortgage (P&I)
- −$315
- Tax est. 1.5%
- −$75 /mo · $900/yr
- Insurance
- −$25
- HOA
- −$0
- Vacancy / Maint / Mgmt
- −$381
- Net cashflow
- $1,018
Break-even live
UW: 25.0% down · 7.5% · 30yr · 1.5% tax · 5.0% vac · 8.0% maint · 8.0% mgmt
Financing live
Cash to close
- Down payment
- $15,000
- Closing costs
- $1,800
- Reserves months
- —
- Total cash needed
- —
Loan-product check · same deal, 3 products live
Conventional
25% down · 7.5% · 30yr
- Down + closing
- —
- Monthly P&I
- —
- Monthly cashflow
- —
- DSCR
- —
- Eligible?
- —
Personal DTI + credit; lowest rate.
DSCR
20% down · 8.5% · 30yr
- Down + closing
- —
- Monthly P&I
- —
- Monthly cashflow
- —
- DSCR
- —
- Eligible?
- —
No personal income docs; deal must DSCR.
Hard money
10% down · 12.0% · 12mo
- Down + closing
- —
- Monthly P&I
- —
- Monthly cashflow
- —
- DSCR
- —
- Eligible?
- —
Short-term bridge; refi at stabilization.
Rent comps 20 comps
| Address | Beds | Baths | Sqft | Rent | $/sqft | DOM | Units | Dist |
|---|---|---|---|---|---|---|---|---|
| 9448 Orangevale Ave Unit 4 Orangevale, CA | 1.0 | 1.0 | 700 | $1,275 | $1.82 | 44d | 1 | 0.31mi |
| 9448 Orangevale Ave Unit 2 Orangevale, CA | 1.0 | 1.0 | 700 | $1,250 | $1.79 | 24d | 1 | 0.31mi |
| 9448 Orangevale Ave Unit 7 Orangevale, CA | 1.0 | 1.0 | 700 | $1,250 | $1.79 | 7d | 1 | 0.32mi |
| 9681 Lake Natoma Dr Orangevale, CA | 2.0 | 1.0 | 980 | $2,050 | $2.09 | 20d | 1 | 0.35mi |
| 6411 Benning St Orangevale, CA | 2.0 | 2.5 | 1102 | $1,922 | $1.74 | 10d | 2 | 0.37mi |
| 9304 Orangevale Ave Orangevale, CA | 1.0 | 1.0 | 600 | $1,300 | $2.17 | 7d | 1 | 0.40mi |
| 5725 Main Ave Unit 05 Orangevale, CA | 2.0 | 1.0 | 792 | $1,675 | $2.11 | 44d | 1 | 0.43mi |
| 6431 Benning St Orangevale, CA | 2.0–3.0 | 1.0 | 987 | $1,999 | $2.02 | 7d | 3 | 0.44mi |
| 6047 Woodminster Cir Orangevale, CA | 2.0 | 1.0 | 850 | $1,750 | $2.06 | 7d | 1 | 0.45mi |
| 9175 Greenback Ln Orangevale, CA | 1.0–2.0 | 1.0 | 675 | $2,095 | $3.10 | 2d | 8 | 0.60mi |
| 9200 Madison Ave Orangevale, CA | 2.0 | 2.0 | 1017 | $1,675 | $1.65 | 44d | 1 | 0.85mi |
| 9201 Madison Ave Orangevale, CA | 1.0–2.0 | 1.0 | 815 | $2,393 | $2.94 | 2d | 13 | 0.85mi |
| 9160 Madison Ave Fair Oaks, CA | 1.0–2.0 | 1.0–2.0 | 818 | $1,950 | $2.38 | 2d | 3 | 0.94mi |
| 9160 Madison Ave Fair Oaks, CA | 2.0 | 2.0 | 988 | $1,875 | $1.90 | 12d | 3 | 0.94mi |
| 9200 Madison Ave Unit 153 Fair Oaks, CA | 2.0 | 2.0 | 1017 | $1,675 | $1.65 | 44d | 1 | 0.94mi |
| 405 Reading St Folsom, CA | 1.0 | 1.0 | 700 | $2,100 | $3.00 | 24d | 1 | 1.25mi |
| 1000 Folsom Ranch Dr Folsom, CA | 1.0–2.0 | 1.0–2.0 | 830 | $2,399 | $2.89 | 2d | 18 | 1.26mi |
| 1212 Bidwell St Folsom, CA | 2.0 | 1.0 | 820 | $2,025 | $2.47 | 44d | 1 | 1.29mi |
| 1600 Canyon Terrace Ln Folsom, CA | 1.0–3.0 | 1.0–2.0 | 955 | $2,348 | $2.46 | 2d | 18 | 1.36mi |
| 709 Mormon St Folsom, CA | 2.0 | 1.0 | 750 | $1,995 | $2.66 | 16d | 1 | 1.44mi |
Listing history 14 events
-
2026-06-18days on market $60,000 Active 105 DOM
-
2026-06-17days on market $60,000 Active 104 DOM
-
2026-06-16days on market $60,000 Active 103 DOM
-
2026-06-15days on market $60,000 Active 102 DOM
-
2026-06-13days on market $60,000 Active 100 DOM
-
2026-06-13days on market $60,000 Active 99 DOM
-
2026-06-09days on market $60,000 Active 96 DOM
-
2026-06-08days on market $60,000 Active 95 DOM
-
2026-06-07days on market $60,000 Active 94 DOM
-
2026-06-05days on market $60,000 Active 91 DOM
-
2026-06-03days on market $60,000 Active 90 DOM
-
2026-06-02days on market $60,000 Active 89 DOM
-
2026-06-01days on market $60,000 Active 88 DOM
-
2026-05-31days on market $60,000 Active 87 DOM
ⓘ Source: listings_history table (triggers on properties + properties_extension) + one-shot
backfill from property_details.listing_events for pre-trigger history.
Climate risk First Street
- Flood 1/10 Low FEMA zone X (unshaded) · 0% chance over 30 yrs
- Wildfire 1/10 Low
- Heat 7/10 Severe 7 d/yr ≥103°F today · 16 d/yr by 30 yrs out
- Wind 1/10 Low
- Air quality 10/10 Extreme 30 unhealthy d/yr today · 38 by 30 yrs out
Nearby sold comps map
Loading sold comps map…
Walkable amenities ~0.75 mi
Loading nearby amenities…
Taxation est. · year 1
- Rental income
- $21,755
- − Mortgage interest
- −$3,361
- − Property taxes
- −$900
- − Insurance
- −$300
- − Repairs & maintenance
- −$1,740
- − Management
- −$1,740
- − Depreciation
- −$1,745
- Taxable income
- $11,968
- Est. tax owed @ 24.0%
- −$2,872
- After-tax cash flow
- $9,338/yr
For passive investors: Depreciation is non-cash, so a rental often shows a tax loss while cash-flowing — sheltering income. Rental losses are passive: they offset passive income freely, and up to $25,000/yr can offset ordinary (W-2) income if you actively participate and your MAGI is under $100k (phasing out to $0 by $150k); unused losses carry forward. On sale, claimed depreciation is recaptured at up to 25%, and gains may owe capital-gains tax (a 1031 exchange can defer both). Figures are a year-1 estimate at your 24.0% rate — not tax advice; consult a CPA.
Schools (NCES district)
- District
- San Juan Unified
- NCES district ID
- 0634620
- Math proficiency
- 40% ▲ 3.00%
- Reading proficiency
- 62% ▲ 16.00%
- Median HH income
- $55,655
- Composite
- 44.07/100
- National rank
- #2878
- State rank
- #138 of 517 in CA
Livability — Orangevale
- Score
- 59/100
- State rank
- #635
- US rank
- #19999
Category grades
Schools grade is shown separately in the Schools card above.
Census & demographics
- Census place
- Orangevale, CA
- County
- Sacramento County · 1,539,646 people
- City population
- 32,600
- Metro
- Sacramento-Roseville-Folsom, CA
- Population (ZIP)
- 32,600
- Household income
- $96,689
- Rent vs Own
- Severe rent burden
- 919.0
Population outlook (Sacramento County) Hauer SSP2
- Today (2025)
- 1,660,763 people
- By 2030
- 1,732,990 · +4.3%
- By 2040
- 1,855,755 · +11.7%
- By 2050
- 1,941,335 · +16.9%
- By 2075
- 2,046,162 · +23.2%
- By 2100
- 1,961,444 · +18.1%
Race, ethnicity, and origin ACS 2023
- Neighborhood character
- Predominantly White (73%)
- Race & ethnicity
- White 73% Hispanic / Latino 16% Two or more races 12% Asian 3% Black 2%
- Hispanic origin (detail)
- Mexican 10% Puerto Rican 1%
- Common ancestry
- Portuguese 4% Italian 3% Lithuanian 2%
- Foreign-born
- 7% · Canada, China
- Languages at home
- 90% English-only · Spanish 4% Russian/Polish/Slavic 2% Other Indo-European 1%
Political lean MEDSL · Sacramento
- 2024 margin
- D (+19.7) · D 58.1% · R 38.4% · Other 3.5%
- 2008→2024 swing
- +0.7pp no change · 2008: 19.0pp · 2024: 19.7pp
- All cycles
- 2024: D+19.7 2020: D+25.3 2016: D+23.7 2012: D+16.3 2008: D+19.0
Not yet ingested
- Civics
- —
Market trends
- HPI YoY
- ▼ -471.79%
- Current HPI
- 297.1675
- Rent YoY
- ▲ 1.94%
- Metro
- Sacramento-Roseville-Folsom, CA
- State GDP YoY
- ▲ 3.21%
- F500 in state
- 116
Industry mix (Fortune 500 HQ in CA)
| Industry | F500 HQs | Revenue |
|---|---|---|
| Technology | 27 | $1,492B |
|
||
| Financial Services | 3 | $174B |
|
||
| Retail | 3 | $44B |
|
||
| Insurance | 3 | $26B |
|
||
| Media / Entertainment | 2 | $115B |
|
||
| Pharmaceuticals / Biotech | 2 | $62B |
|
||
Cash-flow waterfall
monthlySold comps — $/sqft
last 12 mo · ≤1 miLoading sold comps…