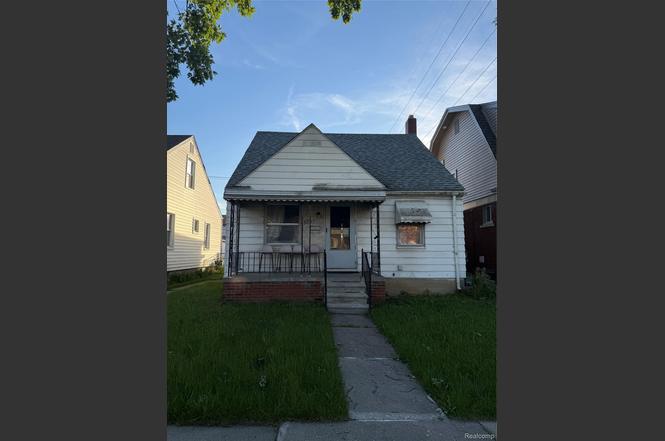
6467 Ternes St · Dearborn, MI
Flood risk 1/10 · Minimal
- FEMA flood zone
- X (unshaded)
- Chance of flooding over 30 yrs
- 0.0%
- Est. flood insurance / yr
- $473 – $860
Fire risk 1/10 · Minimal
- Est. fire insurance / yr
- $784 – $1,456
Heat risk 3/10 · Minor
- Hot days now (above 97°F)
- 7 days/yr
- Hot days in 30 yrs
- 15 days/yr
Wind risk 2/10 · Minimal
- Chance of severe wind over 30 yrs
- —
Air-quality risk 3/10 · Minor
- Unhealthy air days now
- 2 days/yr
- Unhealthy air days in 30 yrs
- 4 days/yr
Risk factors via First Street. Map © Google.
Why this score? — see what drove the D grade
The composite is a weighted blend of 9 inputs, each scored 0–100. Each bar is that input's sub-score; the figure is the points it added to the 100-point composite (weight × sub-score).
- ARV discount +14.7/15.0
- Cash flow +7.8/30.0
- Rent growth +5.0/5.0
- Livability +4.0/5.0
- 1% rule +2.8/10.0
- Schools +2.8/10.0
- Condition / age +2.5/5.0
- DSCR +1.9/10.0
- Appreciation +0.0/10.0
$170,000
🖨 Deal sheet 📄 Offer letter ✓ Due diligence
Listing remarks MLS
Opportunity is knocking at 6467 Ternes Rd in Dearborn. This as-is home is priced with its condition in mind and offers serious potential for the right buyer. Whether you're an investor, flipper, renovator, or someone looking to create a home your own way, this property gives you the chance to add your personal touch in a highly desirable Dearborn neighborhood. The extended 3rd bedroom provides flexible use and can also function as a family room, office, or additional living space. Homes with this kind of upside in this location do not come around often. Bring your vision and schedule your showing today. BATVI
Key facts
- 3,485 sq ft lot
- Built 1944
Neighborhood map
What this means for you Summary
Snapshot
- This is a 2-bed/1.0-bath single-family listed at $170k.
Deal economics
- At list price, monthly cash flow is $-186 ($-2k/yr) — negative.
- To cash-flow at today's rent, offer at most $137k (19.4% below list).
- To meet the 1% rule (rent ≥ 1% of price), the offer needs to be $133k (21.7% below list).
- Recommended offer: $133k (21.7% below list) — sets the bar for 1% rule.
Location & tenants
- Location reads 80/100 on livability (#84 in MI, #1,904 nationally) — a professional / high-income tenant draw. Strengths: commute A+, cost of living A+, housing A+; Watch: amenities D, schools D-.
- Dearborn City School District (urban): math 26% / reading 39% proficiency, ranked #325 of 540 in MI (top 60%) — families likely to look elsewhere, expect single-tenant / working-renter base with shorter leases; 66% free/reduced lunch — lower-income household profile, screen leases tightly.
- Market conditions: Rents rising fast (+13.2%/yr); 102 active listings in the ZIP; 13 comparable units currently listed for rent nearby; rentals lingering (median 44d on market — plan ~5-8 weeks vacancy on turnover, expect pricing pressure); 62% of comp listings sitting > 30 days — soft ceiling on asking rent; lower-income renter base — watch delinquency; 2,639 units permitted in Wayne County in 2024 (1,216 in 5+ unit buildings).
- This rent runs 38% of the median local income ($42k/yr) — at the standard rent-burdened threshold; future hikes will face affordability resistance.
Forward outlook
- Local home prices are declining (-3.0%/yr); year-one equity from $1k of loan paydown is wiped out by about $5k of value loss. Plan a longer hold.
- Wayne County population projected at -17% by 2050 — secular population decline; favor cash flow + early exit over multi-decade hold.
Negotiation context
- Only 0 days on market — expect competitive offers; lowballing is unlikely to land.
- 11 sale attempts since 30y ago with the ask held roughly flat each time — persistent listings suggest the price (not the market) is what's stuck; bring a comps-based counter.
- Current owner paid $45k; list at $170k implies a 278% gain — meaningful room to come down on a strong offer.
Risks & watch-outs
- Watch-outs: built in 1944 — expect roof / HVAC / electrical / plumbing capex.
Questions for the listing agent
- What do current leases actually rent for vs. the listed asking? Can we see a recent rent roll and the last 12 months of T-12 income?
- Built in 1944 — when were the roof, HVAC, electrical panel, plumbing, and water heater last replaced?
- Is there a deadline driving the sale (1031 exchange, divorce, estate, relocation)? That informs how much negotiation room exists.
- Schools are D-rated, which usually means shorter tenancies and higher turnover. Who's the typical renter profile here, and what's been the actual vacancy rate?
- The area grade is low — what's the realistic commute time and amenity access for the typical tenant pool here? Any planned neighborhood developments (good or bad) we should know about?
- What's the average days-on-market for RENTAL listings here right now (not sales)? A rising rental-DOM trend means longer vacancies and softer asking-rent achievability than the comps imply.
- What's the recent tenant-quality profile in this submarket — average credit score on applications, eviction rate, late-payment / NSF rate, and stable-employment percentage? A property-management company in the area should have these aggregated.
- How much new for-sale + rental construction is in the pipeline within 1–3 miles? Heavy new supply typically softens prices + rents 12–24 months out; constrained supply supports both.
Investment metrics
- 1% rule
- 0.78% ✗
- Cap rate
- 4.98%
- Cash-on-cash
- -4.70%
- DSCR
- 0.79
- GRM
- 10.6
CMA / ARV
- ARV (on-the-fly)
- $202,248
- Comps found
- 10
Show comp detail 10 sales within ~0.75 mi
| Address | Dist | Beds/Ba | Sqft | Sold | Price | $/sf | Match |
|---|---|---|---|---|---|---|---|
| 6312 Ternes St | 0.16mi | 3/1.0 (+1) | 1,272 (0%) | 19mo | $225,000 | $177 | 72 |
| 6401 Kenilworth St | 0.25mi | 2/2.0 | 1,386 (+9%) | 1mo | $220,000 | $159 | 69 |
| 6101 Orchard Ave | 0.30mi | 2/2.0 | 1,238 (-3%) | 10mo | $160,000 | $129 | 69 |
| 6400 Payne Ave | 0.16mi | 3/1.0 (+1) | 1,119 (-12%) | 7mo | $185,000 | $165 | 62 |
| 6128 Yinger Ave | 0.40mi | 3/2.0 (+1) | 1,188 (-7%) | 6mo | $167,500 | $141 | 56 |
| 6100 Horger St | 0.55mi | 3/1.0 (+1) | 1,333 (+5%) | 10mo | $305,000 | $229 | 53 |
| 5485 Steadman St | 0.69mi | 3/1.5 (+1) | 1,361 (+7%) | 3mo | $208,000 | $153 | 46 |
| 7526 Mead St | 0.61mi | 3/1.0 (+1) | 1,353 (+6%) | 16mo | $155,000 | $115 | 43 |
| 7329 Neckel St | 0.73mi | 3/1.0 (+1) | 1,136 (-11%) | 8mo | $185,000 | $163 | 37 |
| 7235 Middlesex St | 0.57mi | 3/1.0 (+1) | 1,134 (-11%) | 24mo | $165,000 | $146 | 30 |
Match score weights: distance 35% · size 25% · config 20% · recency 20%. Top-matched comps best support the ARV.
Projected returns pro-forma
-3.0% appreciation · 8.0% rent growth · sell at horizon
- IRR
- -18.5%
- Equity multiple
- 0.32×
- Total profit
- $-32,321
- Equity at exit
- $25,348
- IRR
- -2.9%
- Equity multiple
- 0.77×
- Total profit
- $-11,173
- Equity at exit
- $14,698
Cash invested: $47,600 (down + closing). Projections, not guarantees.
Landlord ↔ Tenant lean methodology
- Overall (STATE)
- 62 Landlord-Friendly
- State Michigan
- 62 Landlord-Friendly · EVEN
- County
- — inherits STATE
- City
- — inherits STATE
ZIP-level market 48126
- Rents YoY
- 13.2%
- Active inventory
- 102
- Price-to-rent
- 10.6×
Monthly cashflow live
- Estimated rent
- $1,331 high interval (Pro) →
- Mortgage (P&I)
- −$891
- Tax from tax record
- −$275 /mo · $3,305/yr
- Insurance
- −$71
- HOA
- −$0
- Vacancy / Maint / Mgmt
- −$279
- Net cashflow
- $-186
Break-even live
UW: 25.0% down · 7.5% · 30yr · 1.5% tax · 5.0% vac · 8.0% maint · 8.0% mgmt
Financing live
Cash to close
- Down payment
- $42,500
- Closing costs
- $5,100
- Reserves months
- —
- Total cash needed
- —
Loan-product check · same deal, 3 products live
Conventional
25% down · 7.5% · 30yr
- Down + closing
- —
- Monthly P&I
- —
- Monthly cashflow
- —
- DSCR
- —
- Eligible?
- —
Personal DTI + credit; lowest rate.
DSCR
20% down · 8.5% · 30yr
- Down + closing
- —
- Monthly P&I
- —
- Monthly cashflow
- —
- DSCR
- —
- Eligible?
- —
No personal income docs; deal must DSCR.
Hard money
10% down · 12.0% · 12mo
- Down + closing
- —
- Monthly P&I
- —
- Monthly cashflow
- —
- DSCR
- —
- Eligible?
- —
Short-term bridge; refi at stabilization.
Rent comps 13 comps
| Address | Beds | Baths | Sqft | Rent | $/sqft | DOM | Units | Dist |
|---|---|---|---|---|---|---|---|---|
| 6406 Mead St Dearborn, MI | 2.0 | 1.0 | 904 | $1,100 | $1.22 | 24d | 1 | 0.11mi |
| 6474 Saint Marys St Detroit, MI | 3.0 | 1.0 | 1237 | $1,350 | $1.09 | 44d | 1 | 0.73mi |
| 7419 Rutherford St Detroit, MI | 2.0 | 1.0 | 981 | $1,150 | $1.17 | 15d | 1 | 0.87mi |
| 8047 Robson St Detroit, MI | 3.0 | 2.0 | 1184 | $1,200 | $1.01 | 44d | 1 | 0.96mi |
| 8114 Marlowe St Unit home Detroit, MI | 3.0 | 1.0 | 985 | $1,350 | $1.37 | 44d | 1 | 1.02mi |
| 5110 Maple St Dearborn, MI | 1.0 | 1.0 | 1578 | $1,000 | $0.63 | 44d | 1 | 1.06mi |
| 5250 Calhoun St Dearborn, MI | 3.0 | 1.0 | 1400 | $1,300 | $0.93 | 24d | 1 | 1.09mi |
| 8212 Lauder St Detroit, MI | 3.0 | 1.0 | 1026 | $1,150 | $1.12 | 44d | 1 | 1.09mi |
| 6761 Memorial Ave Detroit, MI | 3.0 | 1.0 | 1060 | $1,100 | $1.04 | 24d | 1 | 1.15mi |
| 4900 Heather Dr Dearborn, MI | 1.0–2.0 | 1.0–2.0 | 921 | $1,980 | $2.15 | 2d | 1 | 1.23mi |
| 4700 Curtis St Unit 2W Dearborn, MI | 1.0 | 1.0 | 900 | $950 | $1.06 | 44d | 1 | 1.33mi |
| 8604 Whitcomb St Detroit, MI | 3.0 | 2.0 | 1033 | $1,300 | $1.26 | 44d | 1 | 1.36mi |
| 4240 Maple St Dearborn, MI | 2.0 | 2.0 | 1500 | $2,300 | $1.53 | 44d | 1 | 1.46mi |
Listing history 2 events
-
2026-06-17remarks 616-char remark
-
2026-06-17$170,000 Pending
ⓘ Source: listings_history table (triggers on properties + properties_extension) + one-shot
backfill from property_details.listing_events for pre-trigger history.
Tax reassessment forecast MI · Partial reset (capped growth)
- Current annual tax
- $3,305 · $275/mo
- Projected year-2 tax
- $3,305 · $275/mo
- Expected delta
- $0/yr ($0/mo · 0.0%)
ⓘ Screening estimate from a state-policy table — verify with the county assessor before closing.
Climate risk First Street
- Flood 1/10 Low FEMA zone X (unshaded) · 0% chance over 30 yrs
- Wildfire 1/10 Low
- Heat 3/10 Moderate 7 d/yr ≥97°F today · 15 d/yr by 30 yrs out
- Wind 2/10 Low
- Air quality 3/10 Moderate 2 unhealthy d/yr today · 4 by 30 yrs out
Nearby sold comps map
Loading sold comps map…
Walkable amenities ~0.75 mi
Loading nearby amenities…
Taxation est. · year 1
- Rental income
- $15,971
- − Mortgage interest
- −$9,523
- − Property taxes
- −$3,305
- − Insurance
- −$850
- − Repairs & maintenance
- −$1,278
- − Management
- −$1,278
- − Depreciation
- −$4,945
- Taxable loss
- −$5,207
- Est. tax savings @ 24.0%
- +$1,250
- After-tax cash flow
- $-986/yr
For passive investors: Depreciation is non-cash, so a rental often shows a tax loss while cash-flowing — sheltering income. Rental losses are passive: they offset passive income freely, and up to $25,000/yr can offset ordinary (W-2) income if you actively participate and your MAGI is under $100k (phasing out to $0 by $150k); unused losses carry forward. On sale, claimed depreciation is recaptured at up to 25%, and gains may owe capital-gains tax (a 1031 exchange can defer both). Figures are a year-1 estimate at your 24.0% rate — not tax advice; consult a CPA.
Schools (NCES district)
- District
- Dearborn City School District
- NCES district ID
- 2611600
- Math proficiency
- 26% ▼ -14.00%
- Reading proficiency
- 39% ▼ -8.00%
- Median HH income
- $46,884
- Composite
- 27.93/100
- National rank
- #6864
- State rank
- #325 of 540 in MI
Livability — Dearborn
- Score
- 80/100
- State rank
- #84
- US rank
- #1904
Category grades
Schools grade is shown separately in the Schools card above.
Census & demographics
- Census place
- Dearborn, MI
- County
- Wayne County · 1,562,939 people
- City population
- 86,476
- Metro
- Detroit-Warren-Dearborn, MI
- Population (ZIP)
- 51,997
- Household income
- $42,140
- Rent vs Own
- Severe rent burden
- 2742.0
Population outlook (Wayne County) Hauer SSP2
- Today (2025)
- 1,675,273 people
- By 2030
- 1,620,300 · -3.3%
- By 2040
- 1,502,341 · -10.3%
- By 2050
- 1,384,039 · -17.4%
- By 2075
- 1,124,592 · -32.9%
- By 2100
- 881,193 · -47.4%
Race, ethnicity, and origin ACS 2023
- Neighborhood character
- Predominantly White (90%)
- Race & ethnicity
- White 90% Two or more races 4% Black 3% Asian 2% Hispanic / Latino 1%
- Common ancestry
- Arab 8% Romanian 2% Armenian 1%
- Foreign-born
- 43% · Canada, South Korea
- Languages at home
- 26% English-only · Arabic 70% Other Indo-European 2% Spanish 1%
Political lean MEDSL · Wayne
- 2024 margin
- Strong D (+29.0) · D 62.7% · R 33.7% · Other 3.6%
- 2008→2024 swing
- -20.5pp toward R · 2008: 49.5pp · 2024: 29.0pp
- All cycles
- 2024: D+29.0 2020: D+38.1 2016: D+37.3 2012: D+46.9 2008: D+49.5
Not yet ingested
- Civics
- —
Market trends
- HPI YoY
- ▼ -266.09%
- Current HPI
- 241.0732
- Rent YoY
- ▲ 13.15%
- Metro
- Detroit-Warren-Dearborn, MI
- State GDP YoY
- ▲ 1.37%
- F500 in state
- 28
Industry mix (Fortune 500 HQ in MI)
| Industry | F500 HQs | Revenue |
|---|---|---|
| Automotive Parts | 3 | $48B |
|
||
| Automotive | 2 | $372B |
|
||
| Chemicals | 1 | $45B |
|
||
| Automotive Retail | 1 | $29B |
|
||
| Healthcare / Medical Devices | 1 | $23B |
|
||
| Automotive Technology | 1 | $20B |
|
||
Price history
+133.2% since first listed32 events — show timeline
- 2026-06-15 Listing Removed — REALCOMP
- 2026-06-15 Listing Removed — MiRealSource-MiMLS
- 2026-06-12 Listed $170,000 REALCOMP
- 2026-06-12 Listed $170,000 MiRealSource-MiMLS
- 2016-03-18 Sold (MLS) $45,000 MiRealSource-MiMLS
- 2016-03-18 Sold (MLS) $45,000 REALCOMP
- 2016-03-04 Pending — REALCOMP
- 2016-03-02 Listing Removed — REALCOMP
- 2016-01-09 Pending — REALCOMP
- 2016-01-08 Listing Removed — MiRealSource-MiMLS
- 2016-01-06 Listing Removed — REALCOMP
- 2016-01-06 Listed $49,900 REALCOMP
- 2016-01-06 Listing Removed — MiRealSource-MiMLS
- 2016-01-06 Listed $49,900 MiRealSource-MiMLS
- 2016-01-06 Pending — REALCOMP
- 2015-11-06 Price Changed $32,900 REALCOMP
- 2015-11-06 Listing Removed — REALCOMP
- 2015-11-06 Relisted — REALCOMP
- 2015-09-28 Listing Removed — REALCOMP
- 2015-09-28 Relisted — REALCOMP
- 2015-09-23 Listing Removed — REALCOMP
- 2015-09-18 Listed $34,900 REALCOMP
- 2015-09-18 Listed $32,900 MiRealSource-MiMLS
- 2009-08-02 Listing Removed — REALCOMP
- 2009-06-30 Listing Removed — REALCOMP
- 2009-01-02 Listed $69,900 REALCOMP
- 2009-01-02 Listed $69,900 REALCOMP
- 2000-12-14 Sold (Public Records) $92,000 Public Records
- 1999-03-15 Sold (Public Records) $36,234 Public Records
- 1997-02-18 Sold (Public Records) $70,000 Public Records
- 1997-01-22 Sold (MLS) $70,000 REALCOMP
- 1996-10-24 Listed $72,900 REALCOMP
Property tax history
+5.4%/yrLatest (2025): $3,305 · -0.3% YoY. Source: county tax records.
Cash-flow waterfall
monthlySold comps — $/sqft
last 12 mo · ≤1 miLoading sold comps…