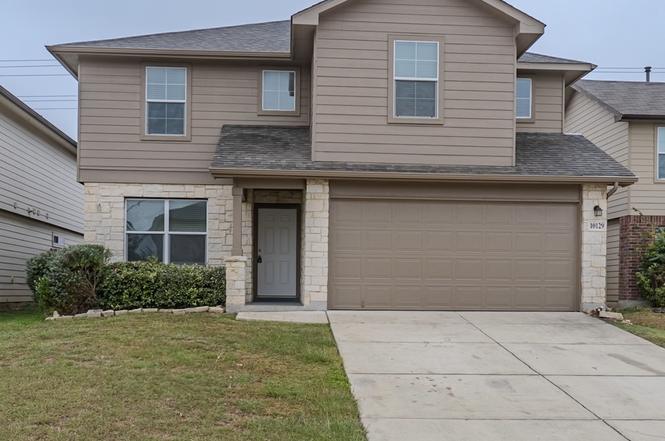
10129 Strasbourg Way · Schertz, TX
Flood risk 1/10 · Minimal
- FEMA flood zone
- X (unshaded)
- Chance of flooding over 30 yrs
- 0.0%
- Est. flood insurance / yr
- $507 – $1,088
Fire risk 5/10 · Moderate
- Est. fire insurance / yr
- $1,222 – $2,270
Heat risk 8/10 · Major
- Hot days now (above 108°F)
- 7 days/yr
- Hot days in 30 yrs
- 22 days/yr
Wind risk 8/10 · Major
- Chance of severe wind over 30 yrs
- 80.0%
Air-quality risk 1/10 · Minimal
- Unhealthy air days now
- 0 days/yr
- Unhealthy air days in 30 yrs
- 0 days/yr
Risk factors via First Street. Map © Google.
Why this score? — see what drove the D+ grade
The composite is a weighted blend of 9 inputs, each scored 0–100. Each bar is that input's sub-score; the figure is the points it added to the 100-point composite (weight × sub-score).
- ARV discount +15.0/15.0
- Cash flow +12.6/30.0
- Schools +4.4/10.0
- DSCR +3.8/10.0
- Livability +3.7/5.0
- 1% rule +3.0/10.0
- Condition / age +2.5/5.0
- Rent growth +1.8/5.0
- Appreciation +0.0/10.0
$312,500
🖨 Deal sheet 📄 Offer letter ✓ Due diligence
Listing remarks
Check out this very well maintained 5-bedroom home featuring an open floor plan and no carpets downstairs for easy maintenance. Enjoy the benefits of a new roof and a covered patio with a spacious backyard, perfect for outdoor gatherings! Located just minutes from schools, shopping centers, dining, and Randolph Air Force Base, this home offers convenience and comfort.
Key facts
- Open floor plan
- Spacious backyard
- Covered patio
Tags
Property features AI
Finance
- Financial info: Down payment assistance resources available
- HOA & community: Mandatory HOA; HOA dues $210 semi-annually; Association transfer fee applies; Neighborhood amenities include park/playground
Exterior
- Parking: 2-car garage
- Utilities: Gas supplied by CPS; Electricity supplied by CPS; Water supplied by SAWB; Sewer supplied by SAWB; Connected to water and sewer systems
- Home design: Pre-owned single-family home; East-facing
- Construction: Approximately 10 years old; Built by D.R. Horton; Brick and cement fiber exterior; Composition roof; Slab foundation
- Exterior features: Covered patio; Double pane windows; Street paved with sidewalks and streetlights; Asphalt streets
Interior
- Kitchen: Gas cooking; Microwave oven; Refrigerator included; Dishwasher; Disposal; Island; Solid countertops
- Bedrooms: Primary bedroom on lower level with walk-in closet, ceiling fan, and full bath; Bedroom 2 — 15 x 12; Bedroom 3 — 14 x 12; Bedroom 4 — 11 x 10; Bedroom 5 — 12 x 12; Primary bedroom dimensions — 14 x 16
- Flooring: Carpeting; Ceramic tile flooring
- Bathrooms: Two full bathrooms and one half bathroom; Primary bath with separate tub and shower and double vanity; Primary bath dimensions — 10 x 8
- Heating & cooling: Central heating (electric); Central air conditioning
- Interior features: Ceiling fans throughout; Smoke alarm; Garage door opener; Solid countertops; Island kitchen; Walk-in pantry; Game room; Utility room inside; Laundry on main level; Laundry room; Attic with radiant barrier decking; Open floor plan; High ceilings; Separate dining room; Two eating areas; Ground level / no steps; Secondary bedroom on lower level; All window coverings remain; Private garbage service
- Laundry & utility: Washer and dryer connections; Electric water heater
Neighborhood map
What this means for you Summary
Snapshot
- This is a 5-bed/2.5-bath single-family listed at $312k.
Deal economics
- At list price, monthly cash flow is $-40 ($-477/yr) — negative.
- To cash-flow at today's rent, offer at most $305k (2.2% below list).
- To meet the 1% rule (rent ≥ 1% of price), the offer needs to be $249k (20.4% below list).
- Recommended offer: $249k (20.4% below list) — sets the bar for 1% rule.
- Cap rate 6.1% vs local median 2.8% in Schertz — top-decile yield for the area; either an underpriced asset or a hidden risk that comps aren't pricing in. Stress-test before assuming the spread holds.
Location & tenants
- Location reads 73/100 on livability (#198 in TX) — a middle-class / working-renter tenant base. Strengths: employment A+, housing A+, crime A; Watch: health & safety D+, amenities F, commute F.
- Schertz-Cibolo-U City ISD (suburban): math 49% / reading 48% proficiency, ranked #152 of 826 in TX (top 18%) — families likely to look elsewhere, expect single-tenant / working-renter base with shorter leases.
- Zoned schools: Watts El (math 44% / reading 44%, grade F, #1,243 of 4,322 statewide, top 29%, 593 students, 44% FRL); Samuel Clemens H S (math 45% / reading 60%, grade C-, #444 of 1,632 statewide, top 27%, 2,544 students, 30% FRL).
- Market conditions: Rents soft (-2.9%/yr); 495 active listings in the ZIP; 12 comparable units currently listed for rent nearby; rentals at typical pace (median 22d on market — plan ~3-4 weeks tenant-placement turnaround); solid renter incomes; 8,308 units permitted in Bexar County in 2024 (2,506 in 5+ unit buildings).
Forward outlook
- Local home prices are declining (-3.0%/yr); year-one equity from $2k of loan paydown is wiped out by about $9k of value loss. Plan a longer hold.
- Bexar County population projected at +50% by 2050 — long-run rental-demand tailwind backs the buy-and-hold thesis.
Negotiation context
- It's been on market 191 days — a 12% lower offer ($275k) is reasonable based on typical stale-listing flexibility.
Risks & watch-outs
- Climate carrying-cost: severe wind risk, 80% chance of damaging wind over 30y; moderate wildfire risk; extreme-heat days projected 7→22/yr by 2055 (HVAC capex compounding) — expect insurance premiums to compound above CPI over the hold.
Questions for the listing agent
- What do current leases actually rent for vs. the listed asking? Can we see a recent rent roll and the last 12 months of T-12 income?
- It's been on market 191 days. Have you received any prior offers? Is the seller open to a 20% concession, seller financing, or rate buy-down credit?
- What does the HOA fee cover, when was the last increase, and are there any pending special assessments or reserve-fund shortfalls?
- Why hasn't it sold? Are there any deal-killer items the seller is aware of (foundation, flood, title, zoning, code violations)?
- Is there a deadline driving the sale (1031 exchange, divorce, estate, relocation)? That informs how much negotiation room exists.
- The area grade is low — what's the realistic commute time and amenity access for the typical tenant pool here? Any planned neighborhood developments (good or bad) we should know about?
- What's the average days-on-market for RENTAL listings here right now (not sales)? A rising rental-DOM trend means longer vacancies and softer asking-rent achievability than the comps imply.
- What's the recent tenant-quality profile in this submarket — average credit score on applications, eviction rate, late-payment / NSF rate, and stable-employment percentage? A property-management company in the area should have these aggregated.
- How much new for-sale + rental construction is in the pipeline within 1–3 miles? Heavy new supply typically softens prices + rents 12–24 months out; constrained supply supports both.
Investment metrics
- 1% rule
- 0.80% ✗
- Cap rate
- 6.14%
- Cash-on-cash
- -0.54%
- DSCR
- 0.98
- GRM
- 10.5
CMA / ARV
- ARV (on-the-fly)
- $396,864
- Comps found
- 12
Show comp detail 12 sales within ~0.75 mi
| Address | Dist | Beds/Ba | Sqft | Sold | Price | $/sf | Match |
|---|---|---|---|---|---|---|---|
| 10226 Galineer Gln | 0.44mi | 5/3.0 | 2,609 (+3%) | 1mo | $361,990 | $139 | 72 |
| 12811 Prairie Vly | 0.44mi | 5/3.0 | 2,609 (+3%) | 2mo | $369,990 | $142 | 72 |
| 10223 Pine River Dr | 0.47mi | 5/3.0 | 2,609 (+3%) | 2mo | $363,490 | $139 | 70 |
| 10157 Galineer Gln | 0.44mi | 4/2.5 (-1) | 2,338 (-8%) | 2mo | $349,990 | $150 | 59 |
| 10113 Peppercorn Pl | 0.63mi | 4/3.5 (-1) | 2,522 (-1%) | 1mo | $442,990 | $176 | 59 |
| 10110 Pine Riv | 0.62mi | 4/3.5 (-1) | 2,522 (-1%) | 2mo | $429,990 | $170 | 59 |
| 10134 Pine River Dr | 0.57mi | 4/2.5 (-1) | 2,338 (-8%) | 2mo | $339,990 | $145 | 53 |
| 10231 Pine River Dr | 0.46mi | 4/3.0 (-1) | 2,260 (-11%) | 1mo | $344,990 | $153 | 52 |
| 9439 Hidden Stone | 0.75mi | 4/3.0 (-1) | 2,638 (+4%) | 1mo | $421,800 | $160 | 51 |
| 10114 Pine River Rd | 0.61mi | 4/2.5 (-1) | 2,884 (+13%) | 2mo | $449,990 | $156 | 43 |
| 10139 Dew Ridge Way | 0.66mi | 4/3.5 (-1) | 2,858 (+12%) | 1mo | $534,990 | $187 | 39 |
| 10106 Pine River Rd | 0.63mi | 4/3.0 (-1) | 2,165 (-15%) | 2mo | $421,990 | $195 | 37 |
Match score weights: distance 35% · size 25% · config 20% · recency 20%. Top-matched comps best support the ARV.
Projected returns pro-forma
-3.0% appreciation · 0.0% rent growth · sell at horizon
- IRR
- -20.4%
- Equity multiple
- 0.31×
- Total profit
- $-60,516
- Equity at exit
- $46,595
- IRR
- -21.3%
- Equity multiple
- 0.04×
- Total profit
- $-84,360
- Equity at exit
- $27,019
Cash invested: $87,500 (down + closing). Projections, not guarantees.
Landlord ↔ Tenant lean methodology
- Overall (STATE)
- 87 Strongly Landlord-Friendly
- State Texas
- 87 Strongly Landlord-Friendly · R+5
- County
- — inherits STATE
- City
- — inherits STATE
ZIP-level market 78154
- Home prices YoY
- -17.6%
- Rents YoY
- -2.9%
- Active inventory
- 495
- Price-to-rent
- 10.5×
Monthly cashflow live
- Estimated rent
- $2,487 high interval (Pro) →
- Mortgage (P&I)
- −$1,639
- Tax from tax record
- −$201 /mo · $2,410/yr
- Insurance
- −$130
- HOA
- −$35
- Vacancy / Maint / Mgmt
- −$522
- Net cashflow
- $-40
Break-even live
Sensitivity live
| Price | -10% $137 | -5% $49 | +0% $-40 | +5% $-128 | +10% $-217 |
|---|---|---|---|---|---|
| Rent | -10% $-236 | -5% $-138 | +0% $-40 | +5% $59 | +10% $157 |
| Rate | -1.0pp $118 | -0.5pp $40 | base $-40 | +0.5pp $-121 | +1.0pp $-203 |
UW: 25.0% down · 7.5% · 30yr · 1.5% tax · 5.0% vac · 8.0% maint · 8.0% mgmt
Financing live
Cash to close
- Down payment
- $78,125
- Closing costs
- $9,375
- Reserves months
- —
- Total cash needed
- —
Loan-product check · same deal, 3 products live
Conventional
25% down · 7.5% · 30yr
- Down + closing
- —
- Monthly P&I
- —
- Monthly cashflow
- —
- DSCR
- —
- Eligible?
- —
Personal DTI + credit; lowest rate.
DSCR
20% down · 8.5% · 30yr
- Down + closing
- —
- Monthly P&I
- —
- Monthly cashflow
- —
- DSCR
- —
- Eligible?
- —
No personal income docs; deal must DSCR.
Hard money
10% down · 12.0% · 12mo
- Down + closing
- —
- Monthly P&I
- —
- Monthly cashflow
- —
- DSCR
- —
- Eligible?
- —
Short-term bridge; refi at stabilization.
Rent comps 12 comps
| Address | Beds | Baths | Sqft | Rent | $/sqft | DOM | Units | Dist |
|---|---|---|---|---|---|---|---|---|
| 12371 Erstein Vly Selma, TX | 4.0 | 2.0 | 1901 | $1,900 | $1.00 | 24d | 1 | 0.10mi |
| 10151 Bussang Rd Schertz, TX | 5.0 | 3.5 | 2812 | $2,825 | $1.00 | 20d | 1 | 0.14mi |
| 10051 Mulhouse Dr Schertz, TX | 5.0 | 2.5 | 2945 | $3,200 | $1.09 | 24d | 1 | 0.25mi |
| 9942 Sarrebourg St Schertz, TX | 4.0 | 3.0 | 1904 | $2,000 | $1.05 | 4d | 1 | 0.53mi |
| 10226 Shadowy Dusk Schertz, TX | 4.0 | 2.5 | 2413 | $2,297 | $0.95 | 22d | 1 | 0.76mi |
| 12025 Vignette Schertz, TX | 4.0 | 3.5 | 2793 | $2,900 | $1.04 | 10d | 1 | 0.88mi |
| 3013 Muntjac Schertz, TX | 4.0 | 2.5 | 2280 | $2,100 | $0.92 | 44d | 1 | 0.93mi |
| 3129 Turquoise Schertz, TX | 4.0 | 2.5 | 2339 | $2,097 | $0.90 | 24d | 1 | 0.96mi |
| 9337 Canopy Bnd Schertz, TX | 4.0 | 2.0 | 1880 | $2,700 | $1.44 | 2d | 1 | 1.03mi |
| 9107 Curling Post Schertz, TX | 4.0 | 3.0 | 2785 | $2,900 | $1.04 | 44d | 1 | 1.03mi |
| 9010 Canopy Bnd Schertz, TX | 4.0 | 3.0 | 3180 | $3,100 | $0.97 | 2d | 1 | 1.10mi |
| 11526 Hollering Pass Schertz, TX | 4.0 | 2.5 | 3014 | $3,000 | $1.00 | 10d | 1 | 1.34mi |
HOA detail
- Monthly dues
- $35 · $420/yr
Listing history 18 events
-
2026-06-18days on market $312,500 Active 191 DOM
-
2026-06-17days on market $312,500 Active 190 DOM
-
2026-06-16days on market $312,500 Active 189 DOM
-
2026-06-13days on market $312,500 Active 186 DOM
-
2026-06-13days on market $312,500 Active 185 DOM
-
2026-06-09days on market $312,500 Active 182 DOM
-
2026-06-08days on market $312,500 Active 181 DOM
-
2026-06-07days on market $312,500 Active 180 DOM
-
2026-06-04days on market $312,500 Active 177 DOM
-
2026-06-03days on market $312,500 Active 176 DOM
-
2026-06-02days on market $312,500 Active 175 DOM
-
2026-06-01days on market $312,500 Active 174 DOM
-
2026-05-31days on market $312,500 Active 173 DOM
-
2026-05-15price $312,500
-
2026-02-21price $317,500
-
2026-02-03price $319,000
-
2025-12-09$321,000 New
-
2016-03-01soldstatus
ⓘ Source: listings_history table (triggers on properties + properties_extension) + one-shot
backfill from property_details.listing_events for pre-trigger history.
Tax reassessment forecast TX · Resets to sale price
- Current annual tax
- $2,410 · $201/mo
- Projected year-2 tax
- $5,719 · $477/mo
- Expected delta
- +$3,309/yr (+$276/mo · 137.3%)
ⓘ Screening estimate from a state-policy table — verify with the county assessor before closing.
Climate risk First Street
- Flood 1/10 Low FEMA zone X (unshaded) · 0% chance over 30 yrs
- Wildfire 5/10 Major
- Heat 8/10 Severe 7 d/yr ≥108°F today · 22 d/yr by 30 yrs out
- Wind 8/10 Severe 80% chance of damaging wind over 30 yrs
- Air quality 1/10 Low 0 unhealthy d/yr today · 0 by 30 yrs out
Nearby sold comps map
Loading sold comps map…
Walkable amenities ~0.75 mi
Loading nearby amenities…
Taxation est. · year 1
- Rental income
- $29,849
- − Mortgage interest
- −$17,505
- − Property taxes
- −$2,410
- − Insurance
- −$1,562
- − Repairs & maintenance
- −$2,388
- − Management
- −$2,388
- − HOA
- −$420
- − Depreciation
- −$9,091
- Taxable loss
- −$5,915
- Est. tax savings @ 24.0%
- +$1,420
- After-tax cash flow
- $943/yr
For passive investors: Depreciation is non-cash, so a rental often shows a tax loss while cash-flowing — sheltering income. Rental losses are passive: they offset passive income freely, and up to $25,000/yr can offset ordinary (W-2) income if you actively participate and your MAGI is under $100k (phasing out to $0 by $150k); unused losses carry forward. On sale, claimed depreciation is recaptured at up to 25%, and gains may owe capital-gains tax (a 1031 exchange can defer both). Figures are a year-1 estimate at your 24.0% rate — not tax advice; consult a CPA.
Schools (NCES district)
- District
- Schertz-Cibolo-U City ISD
- NCES district ID
- 4839480
- Math proficiency
- 49% ▼ -12.00%
- Reading proficiency
- 48% ▼ -4.00%
- Median HH income
- $75,790
- Composite
- 44.02/100
- National rank
- #2886
- State rank
- #152 of 826 in TX
Livability — Schertz
- Score
- 73/100
- State rank
- #198
- US rank
- #5013
Category grades
Schools grade is shown separately in the Schools card above.
Census & demographics
- Census place
- Schertz, TX
- County
- Guadalupe County · 147,291 people
- City population
- 41,907
- Metro
- San Antonio-New Braunfels, TX
- Population (ZIP)
- 41,907
- Household income
- $100,572
- Rent vs Own
- Severe rent burden
- 776.0
Population outlook (Bexar County) Hauer SSP2
- Today (2025)
- 2,336,851 people
- By 2030
- 2,560,728 · +9.6%
- By 2040
- 3,020,569 · +29.3%
- By 2050
- 3,493,522 · +49.5%
- By 2075
- 4,668,459 · +99.8%
- By 2100
- 5,533,242 · +136.8%
Race, ethnicity, and origin ACS 2023
- Neighborhood character
- Diverse neighborhood (Simpson 0.66)
- Race & ethnicity
- White 46% Hispanic / Latino 32% Two or more races 19% Black 15% Asian 2%
- Hispanic origin (detail)
- Mexican 26%
- Common ancestry
- Italian 3% Romanian 3% Lithuanian 2%
- Foreign-born
- 6% · Canada
- Languages at home
- 82% English-only · Spanish 16% German/W. Germanic 1% Other Indo-European 1%
Political lean MEDSL · Bexar
- 2024 margin
- Lean D (+9.8) · D 54.3% · R 44.6% · Other 1.1%
- 2008→2024 swing
- +4.2pp toward D · 2008: 5.6pp · 2024: 9.8pp
- All cycles
- 2024: D+9.8 2020: D+18.2 2016: D+13.5 2012: D+4.6 2008: D+5.6
Not yet ingested
- Civics
- —
Market trends
- HPI YoY
- ▼ -47.53%
- Current HPI
- 222.8314
- Rent YoY
- ▼ -2.86%
- Metro
- San Antonio-New Braunfels, TX
- State GDP YoY
- ▲ 3.95%
- F500 in state
- 110
Industry mix (Fortune 500 HQ in TX)
| Industry | F500 HQs | Revenue |
|---|---|---|
| Energy | 16 | $1,198B |
|
||
| Technology | 5 | $198B |
|
||
| Engineering / Construction | 4 | $72B |
|
||
| Energy Services | 3 | $60B |
|
||
| Utilities | 3 | $41B |
|
||
| Healthcare | 2 | $330B |
|
||
Price history
-2.6% since first listed5 events — show timeline
- 2026-05-15 Price Changed $312,500 LERA
- 2026-02-21 Price Changed $317,500 LERA
- 2026-02-03 Price Changed $319,000 LERA
- 2025-12-09 Listed $321,000 LERA
- 2016-03-01 Sold (Public Records) — Public Records
Property tax history
+14.4%/yrLatest (2025): $2,410 · -71.8% YoY. Source: county tax records.
Cash-flow waterfall
monthlySold comps — $/sqft
last 12 mo · ≤1 miLoading sold comps…