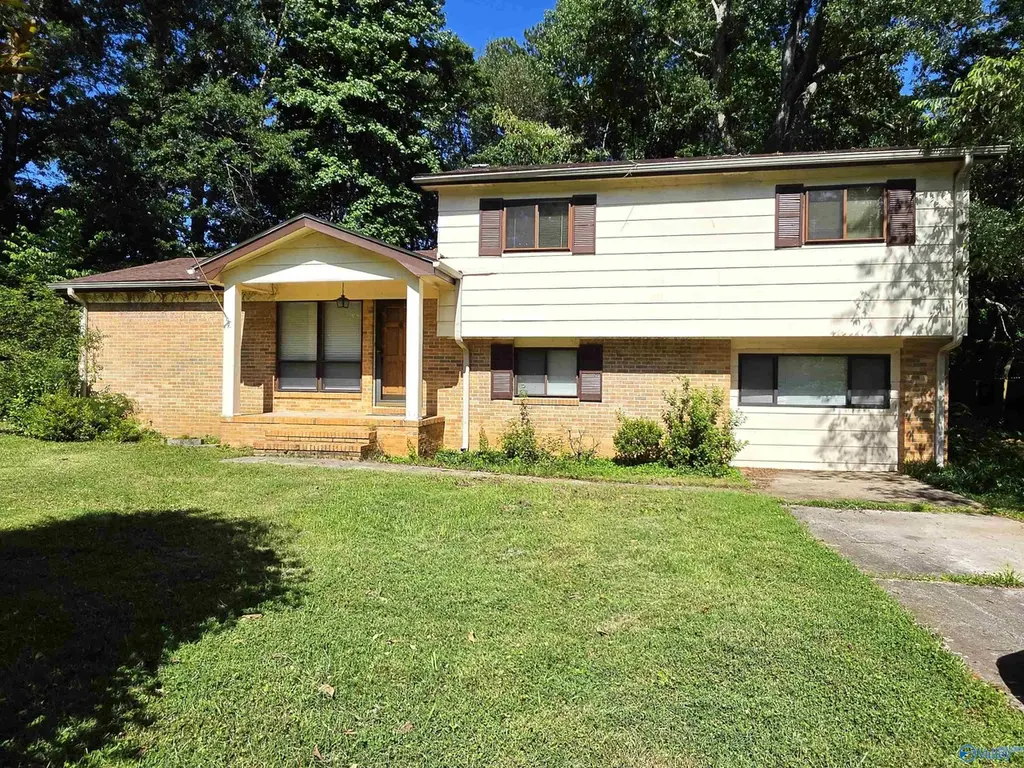
520 Seaborn Dr · Huntsville, AL
Flood risk 3/10 · Minor
- FEMA flood zone
- X (unshaded)
- Chance of flooding over 30 yrs
- 0.2%
- Est. flood insurance / yr
- $507 – $1,088
Fire risk 3/10 · Minor
- Est. fire insurance / yr
- $916 – $1,700
Heat risk 5/10 · Moderate
- Hot days now (above 105°F)
- 7 days/yr
- Hot days in 30 yrs
- 19 days/yr
Wind risk 4/10 · Minor
- Chance of severe wind over 30 yrs
- 17.0%
Air-quality risk 2/10 · Minimal
- Unhealthy air days now
- 0 days/yr
- Unhealthy air days in 30 yrs
- 2 days/yr
Risk factors via First Street. Map © Google.
Why this score? — see what drove the C grade
The composite is a weighted blend of 9 inputs, each scored 0–100. Each bar is that input's sub-score; the figure is the points it added to the 100-point composite (weight × sub-score).
- ARV discount +15.0/15.0
- Cash flow +12.1/30.0
- Appreciation +10.0/10.0
- Livability +4.1/5.0
- DSCR +3.6/10.0
- Rent growth +3.1/5.0
- 1% rule +2.9/10.0
- Schools +2.9/10.0
- Condition / age +2.5/5.0
$239,000
🖨 Deal sheet 📄 Offer letter ✓ Due diligence
Listing remarks
Spacious home with lots of living area. Lovely hardwood flooring! Kitchen had some remodeling a few years ago. New Roof in 2023, New hvac in 2025 Home needs some other work but has lots of potential! 4 bedrooms and 3 baths. Lower area could be used as a separate living area for extended family as it has a full bath or could be used a bonus room for family gatherings with kitchenette. Large deck and wooded yard. Adjoining side lot 3/4 acre, comes with the purchase for additional privacy. Just 5 min. to Bridgestreet shopping and Research Park work locations and close to Gate 9 to the Redstone Arsenal.
Key facts
- Hardwood flooring
- New hvac
- Remodeled kitchen
Tags
Property features AI
Finance
- Other: Directions provided for property access
- HOA & community: No association; Subdivision: Hermitage Forest
Exterior
- Parking: No designated parking
- Utilities: Public water; Public sewer
- Home design: Single-family residence; Residential property; Built in 1962; Multi/split levels
- Construction: Masonite exterior; Slab foundation
- Exterior features: Deck; Front porch; Adjoining wooded buffer lot included (additional ~0.71 acre)
Interior
- Kitchen: Range; Dishwasher; Refrigerator
- Bedrooms: 9 total rooms (bedroom count not specified)
- Bathrooms: 2 full bathrooms; 1 three-quarter bathroom
- Heating & cooling: Central heating (natural gas); Central cooling (electric)
- Interior features: Multi-level/split floorplan; Crawl space basement
Neighborhood map
What this means for you Summary
Snapshot
- This is a 4-bed/1.0-bath single-family listed at $239k.
Deal economics
- At list price, monthly cash flow is $-52 ($-623/yr) — negative.
- To cash-flow at today's rent, offer at most $230k (3.8% below list).
- To meet the 1% rule (rent ≥ 1% of price), the offer needs to be $188k (21.2% below list).
- Recommended offer: $188k (21.2% below list) — sets the bar for 1% rule.
- Cap rate 6.0% vs local median 3.8% in Huntsville — top-decile yield for the area; either an underpriced asset or a hidden risk that comps aren't pricing in. Stress-test before assuming the spread holds.
Location & tenants
- Location reads 82/100 on livability (#3 in AL, #1,082 nationally) — a professional / high-income tenant draw. Strengths: commute A+, cost of living A+, housing A+; Watch: crime F.
- Huntsville City (urban): math 21% / reading 46% proficiency, ranked #48 of 129 in AL (top 37%) — families likely to look elsewhere, expect single-tenant / working-renter base with shorter leases.
- Zoned schools: Morris Elementary School (math 5% / reading 31%, grade F, #481 of 627 statewide, top 77%, 515 students, 90% FRL); Columbia High School (math 12% / reading 17%, grade F, #220 of 305 statewide, top 77%, 954 students, 50% FRL) — zoned schools average 70% FRL vs 46% district-wide (24 pts higher); higher-poverty schools than district average — tighter screening recommended.
- Zoned-school proficiency averages 16% at this address vs 34% district-wide (-17 pts) — the specific schools serving this property underperform the Huntsville City average; the district grade overstates school quality for this exact location.
- Market conditions: Rents rising (+2.6%/yr); 213 active listings in the ZIP; 18 comparable units currently listed for rent nearby; rentals at typical pace (median 21d on market — plan ~3-4 weeks tenant-placement turnaround); solid renter incomes; 4,709 units permitted in Madison County in 2024 (1,186 in 5+ unit buildings).
Forward outlook
- In year one you build about $26k of equity ($2k loan paydown + $24k appreciation (10.0% local appreciation)).
- Madison County population projected at +18% by 2050 — long-run rental-demand tailwind backs the buy-and-hold thesis.
- At projected returns (10.0% appreciation + 2.6% rent growth), your $67k cash investment doubles in ~3 years — after that, you're playing with house money.
- By year 2, paydown + projected appreciation supports a ~$41k cash-out refi (75% LTV) — recoverable capital for the next deal without selling this one.
Negotiation context
- Only 14 days on market — expect competitive offers; lowballing is unlikely to land.
Risks & watch-outs
- Climate carrying-cost: extreme-heat days projected 7→19/yr by 2055 (HVAC capex compounding) — expect insurance premiums to compound above CPI over the hold.
Questions for the listing agent
- What do current leases actually rent for vs. the listed asking? Can we see a recent rent roll and the last 12 months of T-12 income?
- Built in 1962 — when were the roof, HVAC, electrical panel, plumbing, and water heater last replaced?
- Is there a deadline driving the sale (1031 exchange, divorce, estate, relocation)? That informs how much negotiation room exists.
- Crime grade is F in this area — have there been break-ins, vandalism, or insurance claims at this property in the last 3 years? What carrier currently insures it and at what premium?
- What's the average days-on-market for RENTAL listings here right now (not sales)? A rising rental-DOM trend means longer vacancies and softer asking-rent achievability than the comps imply.
- What's the recent tenant-quality profile in this submarket — average credit score on applications, eviction rate, late-payment / NSF rate, and stable-employment percentage? A property-management company in the area should have these aggregated.
- How much new for-sale + rental construction is in the pipeline within 1–3 miles? Heavy new supply typically softens prices + rents 12–24 months out; constrained supply supports both.
Investment metrics
- 1% rule
- 0.79% ✗
- Cap rate
- 6.03%
- Cash-on-cash
- -0.93%
- DSCR
- 0.96
- GRM
- 10.6
CMA / ARV
- ARV (on-the-fly)
- $296,550
- Comps found
- 12
Show comp detail 12 sales within ~0.75 mi
| Address | Dist | Beds/Ba | Sqft | Sold | Price | $/sf | Match |
|---|---|---|---|---|---|---|---|
| 517 Hermitagewood Dr NW | 0.10mi | 3/1.0 (-1) | 1,975 (-0%) | 12mo | $307,000 | $155 | 80 |
| 504 Delaney Rd NW | 0.29mi | 4/3.0 | 1,804 (-9%) | 3mo | $285,000 | $158 | 62 |
| 6410 Deramus Ave NW | 0.58mi | 4/3.0 | 2,047 (+4%) | 1mo | $235,000 | $115 | 59 |
| 309 Forrest Park Ct NW | 0.42mi | 3/2.0 (-1) | 2,067 (+5%) | 9mo | $310,500 | $150 | 56 |
| 528 Delaney Rd | 0.13mi | 3/2.0 (-1) | 1,750 (-12%) | 11mo | $189,000 | $108 | 56 |
| 413 Forrest Park Ct | 0.36mi | 5/2.0 (+1) | 1,915 (-3%) | 19mo | $299,000 | $156 | 53 |
| 6112 Stratford Ct NW | 0.55mi | 3/2.0 (-1) | 1,888 (-4%) | 6mo | $225,000 | $119 | 52 |
| 316 Forrest Park Ct | 0.47mi | 4/2.5 | 1,993 (+1%) | 23mo | $315,000 | $158 | 52 |
| 319 Forrest Park Ct NW | 0.49mi | 3/2.0 (-1) | 1,852 (-6%) | 7mo | $265,000 | $143 | 52 |
| 6206 NW Stratford Ct | 0.58mi | 3/2.0 (-1) | 1,800 (-9%) | 3mo | $185,000 | $103 | 47 |
| 6205 Deramus Ave | 0.68mi | 3/2.0 (-1) | 1,720 (-13%) | 12mo | $270,000 | $157 | 27 |
| 415 Harolds Dr NW | 0.69mi | 3/2.0 (-1) | 1,715 (-13%) | 13mo | $247,350 | $144 | 26 |
Match score weights: distance 35% · size 25% · config 20% · recency 20%. Top-matched comps best support the ARV.
Projected returns pro-forma
10.0% appreciation · 2.57% rent growth · sell at horizon
- IRR
- 23.5%
- Equity multiple
- 2.88×
- Total profit
- $126,005
- Equity at exit
- $215,310
- IRR
- 20.8%
- Equity multiple
- 6.56×
- Total profit
- $371,969
- Equity at exit
- $464,324
Cash invested: $66,920 (down + closing). Projections, not guarantees.
Landlord ↔ Tenant lean methodology
- Overall (STATE)
- 90 Strongly Landlord-Friendly
- State Alabama
- 90 Strongly Landlord-Friendly · R+15
- County
- — inherits STATE
- City
- — inherits STATE
ZIP-level market 35806
- Home prices YoY
- 20.0%
- Rents YoY
- 2.6%
- Active inventory
- 213
- Price-to-rent
- 10.6×
Monthly cashflow live
- Estimated rent
- $1,884 high interval (Pro) →
- Mortgage (P&I)
- −$1,253
- Tax from tax record
- −$188 /mo · $2,253/yr
- Insurance
- −$100
- HOA
- −$0
- Vacancy / Maint / Mgmt
- −$396
- Net cashflow
- $-52
Break-even live
UW: 25.0% down · 7.5% · 30yr · 1.5% tax · 5.0% vac · 8.0% maint · 8.0% mgmt
Financing live
Cash to close
- Down payment
- $59,750
- Closing costs
- $7,170
- Reserves months
- —
- Total cash needed
- —
Loan-product check · same deal, 3 products live
Conventional
25% down · 7.5% · 30yr
- Down + closing
- —
- Monthly P&I
- —
- Monthly cashflow
- —
- DSCR
- —
- Eligible?
- —
Personal DTI + credit; lowest rate.
DSCR
20% down · 8.5% · 30yr
- Down + closing
- —
- Monthly P&I
- —
- Monthly cashflow
- —
- DSCR
- —
- Eligible?
- —
No personal income docs; deal must DSCR.
Hard money
10% down · 12.0% · 12mo
- Down + closing
- —
- Monthly P&I
- —
- Monthly cashflow
- —
- DSCR
- —
- Eligible?
- —
Short-term bridge; refi at stabilization.
Rent comps 18 comps
| Address | Beds | Baths | Sqft | Rent | $/sqft | DOM | Units | Dist |
|---|---|---|---|---|---|---|---|---|
| 511 Delaney Rd NW Huntsville, AL | 3.0 | 2.0 | 1550 | $1,550 | $1.00 | 43d | 1 | 0.24mi |
| 505 Forrest Park Ct NW Huntsville, AL | 3.0 | 2.5 | 2091 | $2,200 | $1.05 | 13d | 1 | 0.31mi |
| 400 Forrest Park Ct NW Huntsville, AL | 3.0 | 3.0 | 2021 | $1,800 | $0.89 | 43d | 1 | 0.50mi |
| 5801 Sanderson St NW Huntsville, AL | 1.0–3.0 | 1.0–2.0 | 1088 | $2,016 | $1.85 | 13d | 14 | 0.62mi |
| 6854 Governors West NW Huntsville, AL | 1.0–3.0 | 1.0–2.0 | 1083 | $1,662 | $1.53 | 13d | 16 | 0.72mi |
| 413 Harolds Dr NW Huntsville, AL | 3.0 | 2.0 | 1700 | $1,795 | $1.06 | 43d | 1 | 0.74mi |
| 925 Makers Way NW Huntsville, AL | 3.0 | 1.0–2.0 | 1072 | $2,455 | $2.29 | 23d | 52 | 0.78mi |
| 5810 Stax St NW Huntsville, AL | 3.0 | 1.0–2.0 | 1188 | $2,705 | $2.28 | 13d | 237 | 0.79mi |
| 320 Voyager Way NW Huntsville, AL | 1.0–3.0 | 1.0–2.0 | 1063 | $1,714 | $1.61 | 21d | 19 | 0.79mi |
| 400 Harolds Dr NW Huntsville, AL | 3.0 | 2.0 | 1750 | $1,795 | $1.03 | 43d | 1 | 0.79mi |
| 6407 Marsh Ave NW Huntsville, AL | 3.0 | 2.0 | 1600 | $1,699 | $1.06 | 43d | 1 | 0.82mi |
| 1100 Enterprise Way Huntsville, AL | 1.0–3.0 | 1.0–2.0 | 1059 | $2,174 | $2.05 | 13d | 35 | 0.86mi |
| 6315 Old Madison Pike NW Huntsville, AL | 1.0–3.0 | 1.0–1.5 | 1065 | $1,437 | $1.35 | 43d | 1 | 0.97mi |
| 6170 Kitt Ln NW Huntsville, AL | 1.0–3.0 | 1.0–2.0 | 1031 | $1,678 | $1.63 | 13d | 31 | 1.03mi |
| 6200 Rime Village Dr NW Huntsville, AL | 3.0 | 1.0–2.0 | 1015 | $1,615 | $1.59 | 13d | 45 | 1.15mi |
| 100 Chawston Ave NW Huntsville, AL | 1.0–3.0 | 1.0–2.5 | 1133 | $1,995 | $1.76 | 13d | 31 | 1.27mi |
| 1060 Sandy Springs Rd NW Huntsville, AL | 3.0 | 2.0 | 1297 | $1,700 | $1.31 | 23d | 1 | 1.34mi |
| 1505 Sparkman Dr NW Huntsville, AL | 2.0–3.0 | 1.5–2.0 | 1150 | $1,139 | $0.99 | 21d | 4 | 1.42mi |
Listing history 10 events
-
2026-06-18days on market $239,000 Active 14 DOM
-
2026-06-17days on market $239,000 Active 13 DOM
-
2026-06-16days on market $239,000 Active 12 DOM
-
2026-06-15days on market $239,000 Active 11 DOM
-
2026-06-14days on market $239,000 Active 9 DOM
-
2026-06-10days on market $239,000 Active 6 DOM
-
2026-06-09days on market $239,000 Active 5 DOM
-
2026-06-08days on market $239,000 Active 4 DOM
-
2026-06-07remarks 607-char remark
-
2026-06-07$239,000 Active 3 DOM
ⓘ Source: listings_history table (triggers on properties + properties_extension) + one-shot
backfill from property_details.listing_events for pre-trigger history.
Tax reassessment forecast AL · Resets to sale price
- Current annual tax
- $2,253 · $188/mo
- Projected year-2 tax
- $2,253 · $188/mo
- Expected delta
- $0/yr ($0/mo · 0.0%)
ⓘ Screening estimate from a state-policy table — verify with the county assessor before closing.
Climate risk First Street
- Flood 3/10 Moderate FEMA zone X (unshaded) · 20% chance over 30 yrs
- Wildfire 3/10 Moderate
- Heat 5/10 Major 7 d/yr ≥105°F today · 19 d/yr by 30 yrs out
- Wind 4/10 Moderate 17% chance of damaging wind over 30 yrs
- Air quality 2/10 Low 0 unhealthy d/yr today · 2 by 30 yrs out
Nearby sold comps map
Loading sold comps map…
Walkable amenities ~0.75 mi
Loading nearby amenities…
Taxation est. · year 1
- Rental income
- $22,613
- − Mortgage interest
- −$13,388
- − Property taxes
- −$2,253
- − Insurance
- −$1,195
- − Repairs & maintenance
- −$1,809
- − Management
- −$1,809
- − Depreciation
- −$6,953
- Taxable loss
- −$4,793
- Est. tax savings @ 24.0%
- +$1,150
- After-tax cash flow
- $527/yr
For passive investors: Depreciation is non-cash, so a rental often shows a tax loss while cash-flowing — sheltering income. Rental losses are passive: they offset passive income freely, and up to $25,000/yr can offset ordinary (W-2) income if you actively participate and your MAGI is under $100k (phasing out to $0 by $150k); unused losses carry forward. On sale, claimed depreciation is recaptured at up to 25%, and gains may owe capital-gains tax (a 1031 exchange can defer both). Figures are a year-1 estimate at your 24.0% rate — not tax advice; consult a CPA.
Schools (NCES district)
- District
- Huntsville City
- NCES district ID
- 0101800
- Math proficiency
- 21% ▼ -23.00%
- Reading proficiency
- 46% ▬ 0.00%
- Median HH income
- $48,264
- Composite
- 28.84/100
- National rank
- #6647
- State rank
- #48 of 129 in AL
Livability — Huntsville
- Score
- 82/100
- State rank
- #3
- US rank
- #1082
Category grades
Schools grade is shown separately in the Schools card above.
Census & demographics
- Census place
- Huntsville, AL
- County
- Madison County · 380,832 people
- City population
- 220,435
- Metro
- Huntsville, AL
- Population (ZIP)
- 29,161
- Household income
- $86,768
- Rent vs Own
- Severe rent burden
- 1249.0
Population outlook (Madison County) Hauer SSP2
- Today (2025)
- 392,086 people
- By 2030
- 409,788 · +4.5%
- By 2040
- 440,557 · +12.4%
- By 2050
- 460,990 · +17.6%
- By 2075
- 502,872 · +28.3%
- By 2100
- 513,623 · +31.0%
Race, ethnicity, and origin ACS 2023
- Neighborhood character
- Diverse neighborhood (Simpson 0.57)
- Race & ethnicity
- White 58% Black 30% Hispanic / Latino 5% Two or more races 5% Asian 4%
- Hispanic origin (detail)
- Mexican 2% Puerto Rican 2%
- Common ancestry
- Slovak 2% Italian 2% Serbian 2%
- Foreign-born
- 7% · Canada, Vietnam, China
- Languages at home
- 93% English-only · Spanish 2% Other Indo-European 1% Other Asian/Pacific 1%
Political lean MEDSL · Madison
- 2024 margin
- Lean R (+9.0) · D 44.7% · R 53.7% · Other 1.6%
- 2008→2024 swing
- +6.0pp toward D · 2008: -14.9pp · 2024: -9.0pp
- All cycles
- 2024: R+9.0 2020: R+8.0 2016: R+16.8 2012: R+18.7 2008: R+14.9
Not yet ingested
- Civics
- —
Market trends
- HPI YoY
- ▲ 71.67%
- Current HPI
- 430.5866
- Rent YoY
- ▲ 2.57%
- Metro
- Huntsville, AL
- State GDP YoY
- ▲ 2.94%
- F500 in state
- 4
Industry mix (Fortune 500 HQ in AL)
| Industry | F500 HQs | Revenue |
|---|---|---|
| Financial Services | 1 | $8B |
|
||
| Healthcare | 1 | $5B |
|
||
Price history
1 event — show timeline
- 2026-06-04 Listed $239,000 VMLS
Property tax history
+14.9%/yrLatest (2024): $2,253 · +4.4% YoY. Source: county tax records.
Cash-flow waterfall
monthlySold comps — $/sqft
last 12 mo · ≤1 miLoading sold comps…