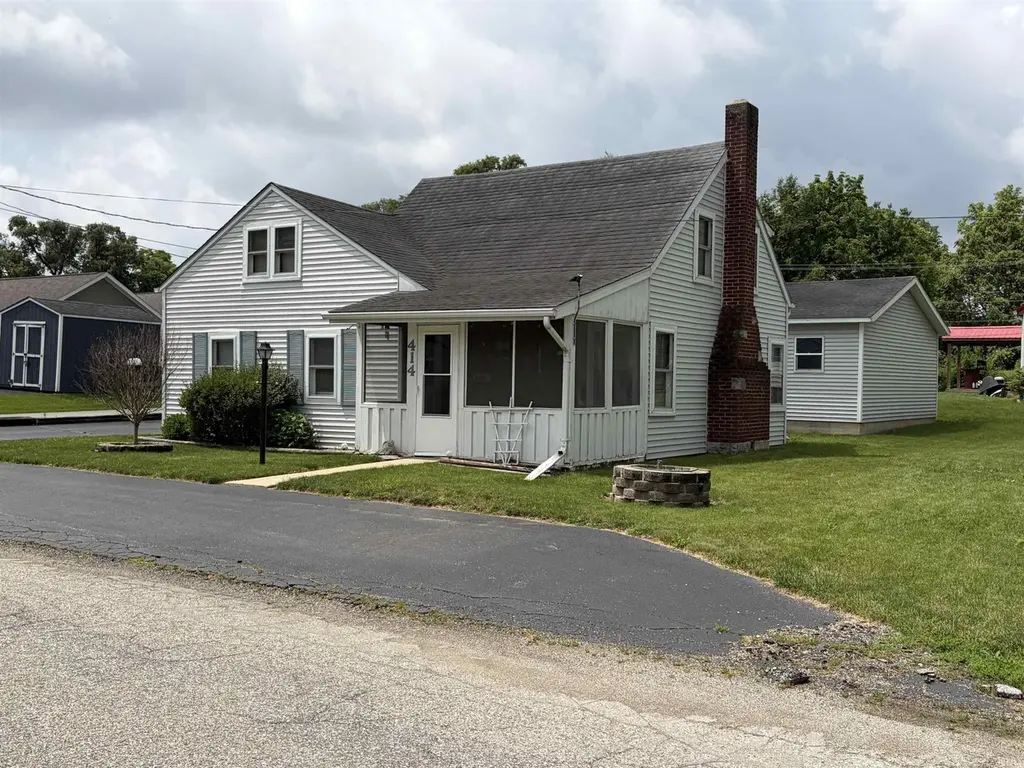
414 N Oliver St · Peru, IN
Flood risk 1/10 · Minimal
- FEMA flood zone
- X (unshaded)
- Chance of flooding over 30 yrs
- 0.0%
- Est. flood insurance / yr
- $473 – $860
Fire risk 1/10 · Minimal
- Est. fire insurance / yr
- $717 – $1,331
Heat risk 3/10 · Minor
- Hot days now (above 102°F)
- 7 days/yr
- Hot days in 30 yrs
- 16 days/yr
Wind risk 2/10 · Minimal
- Chance of severe wind over 30 yrs
- —
Air-quality risk 2/10 · Minimal
- Unhealthy air days now
- 1 days/yr
- Unhealthy air days in 30 yrs
- 2 days/yr
Risk factors via First Street. Map © Google.
Why this score? — see what drove the B- grade
The composite is a weighted blend of 9 inputs, each scored 0–100. Each bar is that input's sub-score; the figure is the points it added to the 100-point composite (weight × sub-score).
- Cash flow +26.8/30.0
- ARV discount +15.0/15.0
- DSCR +9.2/10.0
- 1% rule +6.4/10.0
- Livability +3.9/5.0
- Schools +3.0/10.0
- Rent growth +2.5/5.0
- Condition / age +2.5/5.0
- Appreciation +0.0/10.0
$110,000
🖨 Deal sheet 📄 Offer letter ✓ Due diligence
Listing remarks
Charming 4-bedroom, 1-bath home offering 1,836 square feet of comfortable living space. This inviting 1½-story property features a cozy fireplace, perfect for gathering with family and friends. The spacious 2-car garage includes a dedicated workshop area, ideal for hobbies, projects, or extra storage. With ample room inside and practical amenities throughout, this home combines character, functionality, and value.
Key facts
- 5,227 sq ft lot
- 2 garage spots
- Built 1943
Neighborhood map
What this means for you Summary
Snapshot
- This is a 3-bed/1.0-bath single-family listed at $110k.
Deal economics
- At list price, monthly cash flow is $302 ($4k/yr) — positive.
- The deal already cash-flows at list — no discount required.
- Meets the 1% rule at list price ($1k rent vs $110k).
- Cap rate 9.6% vs local median 6.1% in Peru — top-decile yield for the area; either an underpriced asset or a hidden risk that comps aren't pricing in. Stress-test before assuming the spread holds.
Location & tenants
- Location reads 77/100 on livability (#35 in IN, #2,834 nationally) — a middle-class / working-renter tenant base. Strengths: amenities A+, cost of living A+, housing A+; Watch: crime D+, commute F, employment F.
- Peru Community Schools (town): math 31% / reading 42% proficiency, ranked #192 of 301 in IN (top 64%) — families likely to look elsewhere, expect single-tenant / working-renter base with shorter leases.
- Zoned schools: Blair Pointe Upper Elementary (math 34% / reading 38%, grade F, #577 of 994 statewide, top 59%, 552 students, 63% FRL); Peru Jr/Sr High School (math 27% / reading 57%, grade F, #197 of 369 statewide, top 57%, 883 students, 59% FRL).
- Market conditions: 129 active listings in the ZIP; 35 units permitted in Miami County in 2024 (0 in 5+ unit buildings).
Forward outlook
- Local home prices are declining (-3.0%/yr); year-one equity from $761 of loan paydown is wiped out by about $3k of value loss. Plan a longer hold.
- Miami County population projected at -12% by 2050 — secular population decline; favor cash flow + early exit over multi-decade hold.
- At projected returns (-3.0% appreciation + 3.0% rent growth), your $31k cash investment doubles in ~10 years — after that, you're playing with house money.
Negotiation context
- Only 0 days on market — expect competitive offers; lowballing is unlikely to land.
Risks & watch-outs
- Watch-outs: built in 1943 — expect roof / HVAC / electrical / plumbing capex.
Questions for the listing agent
- Built in 1943 — when were the roof, HVAC, electrical panel, plumbing, and water heater last replaced?
- Is there a deadline driving the sale (1031 exchange, divorce, estate, relocation)? That informs how much negotiation room exists.
- Schools are D-rated, which usually means shorter tenancies and higher turnover. Who's the typical renter profile here, and what's been the actual vacancy rate?
- Crime grade is D in this area — have there been break-ins, vandalism, or insurance claims at this property in the last 3 years? What carrier currently insures it and at what premium?
- What's the average days-on-market for RENTAL listings here right now (not sales)? A rising rental-DOM trend means longer vacancies and softer asking-rent achievability than the comps imply.
- What's the recent tenant-quality profile in this submarket — average credit score on applications, eviction rate, late-payment / NSF rate, and stable-employment percentage? A property-management company in the area should have these aggregated.
- How much new for-sale + rental construction is in the pipeline within 1–3 miles? Heavy new supply typically softens prices + rents 12–24 months out; constrained supply supports both.
Investment metrics
- 1% rule
- 1.14% ✓
- Cap rate
- 9.59%
- Cash-on-cash
- 11.78%
- DSCR
- 1.52
- GRM
- 7.3
CMA / ARV
- ARV (on-the-fly)
- $143,208
- Comps found
- 12
Show comp detail 12 sales within ~0.75 mi
| Address | Dist | Beds/Ba | Sqft | Sold | Price | $/sf | Match |
|---|---|---|---|---|---|---|---|
| 350 N Broadway | 0.19mi | 3/1.5 | 2,080 (+13%) | 0mo | $143,000 | $69 | 67 |
| 20 Logan St | 0.07mi | 3/1.5 | 1,970 (+7%) | 20mo | $153,000 | $78 | 66 |
| 85 Boulevard | 0.14mi | 3/1.5 | 1,675 (-9%) | 19mo | $152,500 | $91 | 61 |
| 128 W 6th St | 0.46mi | 4/1.0 (+1) | 1,696 (-8%) | 1mo | $77,000 | $45 | 60 |
| 84 Ewing St | 0.49mi | 3/2.0 | 1,736 (-5%) | 11mo | $69,000 | $40 | 55 |
| 226 W 5th St | 0.60mi | 4/1.5 (+1) | 1,904 (+4%) | 7mo | $146,200 | $77 | 54 |
| 210 W 5th St | 0.58mi | 4/2.0 (+1) | 1,779 (-3%) | 14mo | $171,000 | $96 | 48 |
| 262 E 6th St | 0.74mi | 2/1.0 (-1) | 1,728 (-6%) | 4mo | $69,000 | $40 | 47 |
| 72 W 7th St | 0.37mi | 4/1.5 (+1) | 1,984 (+8%) | 18mo | $36,900 | $19 | 47 |
| 134 W 2nd St | 0.72mi | 4/2.0 (+1) | 1,848 (+1%) | 15mo | $170,000 | $92 | 44 |
| 107 E Main St | 0.68mi | 4/2.0 (+1) | 1,733 (-6%) | 14mo | $144,000 | $83 | 38 |
| 75 W 2nd St | 0.74mi | 3/1.5 | 1,584 (-14%) | 5mo | $147,000 | $93 | 36 |
Match score weights: distance 35% · size 25% · config 20% · recency 20%. Top-matched comps best support the ARV.
Projected returns pro-forma
-3.0% appreciation · 3.0% rent growth · sell at horizon
- IRR
- 1.2%
- Equity multiple
- 1.05×
- Total profit
- $1,407
- Equity at exit
- $16,401
- IRR
- 10.8%
- Equity multiple
- 1.84×
- Total profit
- $25,923
- Equity at exit
- $9,511
Cash invested: $30,800 (down + closing). Projections, not guarantees.
Landlord ↔ Tenant lean methodology
- Overall (STATE)
- 90 Strongly Landlord-Friendly
- State Indiana
- 90 Strongly Landlord-Friendly · R+11
- County
- — inherits STATE
- City
- — inherits STATE
ZIP-level market 46970
- Home prices YoY
- -8.8%
- Active inventory
- 129
- Price-to-rent
- 7.3×
Monthly cashflow live
- Estimated rent
- $1,257 medium interval (Pro) →
- Mortgage (P&I)
- −$577
- Tax from tax record
- −$68 /mo · $818/yr
- Insurance
- −$46
- HOA
- −$0
- Vacancy / Maint / Mgmt
- −$264
- Net cashflow
- $302
Break-even live
UW: 25.0% down · 7.5% · 30yr · 1.5% tax · 5.0% vac · 8.0% maint · 8.0% mgmt
Financing live
Cash to close
- Down payment
- $27,500
- Closing costs
- $3,300
- Reserves months
- —
- Total cash needed
- —
Loan-product check · same deal, 3 products live
Conventional
25% down · 7.5% · 30yr
- Down + closing
- —
- Monthly P&I
- —
- Monthly cashflow
- —
- DSCR
- —
- Eligible?
- —
Personal DTI + credit; lowest rate.
DSCR
20% down · 8.5% · 30yr
- Down + closing
- —
- Monthly P&I
- —
- Monthly cashflow
- —
- DSCR
- —
- Eligible?
- —
No personal income docs; deal must DSCR.
Hard money
10% down · 12.0% · 12mo
- Down + closing
- —
- Monthly P&I
- —
- Monthly cashflow
- —
- DSCR
- —
- Eligible?
- —
Short-term bridge; refi at stabilization.
Listing history 2 events
-
2026-06-18remarks 417-char remark
-
2026-06-18$110,000 Pending
ⓘ Source: listings_history table (triggers on properties + properties_extension) + one-shot
backfill from property_details.listing_events for pre-trigger history.
Tax reassessment forecast IN · Partial reset (capped growth)
- Current annual tax
- $818 · $68/mo
- Projected year-2 tax
- $876 · $73/mo
- Expected delta
- +$58/yr (+$5/mo · 7.2%)
ⓘ Screening estimate from a state-policy table — verify with the county assessor before closing.
Climate risk First Street
- Flood 1/10 Low FEMA zone X (unshaded) · 0% chance over 30 yrs
- Wildfire 1/10 Low
- Heat 3/10 Moderate 7 d/yr ≥102°F today · 16 d/yr by 30 yrs out
- Wind 2/10 Low
- Air quality 2/10 Low 1 unhealthy d/yr today · 2 by 30 yrs out
Nearby sold comps map
Loading sold comps map…
Walkable amenities ~0.75 mi
Loading nearby amenities…
Taxation est. · year 1
- Rental income
- $15,086
- − Mortgage interest
- −$6,162
- − Property taxes
- −$818
- − Insurance
- −$550
- − Repairs & maintenance
- −$1,207
- − Management
- −$1,207
- − Depreciation
- −$3,200
- Taxable income
- $1,943
- Est. tax owed @ 24.0%
- −$466
- After-tax cash flow
- $3,162/yr
For passive investors: Depreciation is non-cash, so a rental often shows a tax loss while cash-flowing — sheltering income. Rental losses are passive: they offset passive income freely, and up to $25,000/yr can offset ordinary (W-2) income if you actively participate and your MAGI is under $100k (phasing out to $0 by $150k); unused losses carry forward. On sale, claimed depreciation is recaptured at up to 25%, and gains may owe capital-gains tax (a 1031 exchange can defer both). Figures are a year-1 estimate at your 24.0% rate — not tax advice; consult a CPA.
Schools (NCES district)
- District
- Peru Community Schools
- NCES district ID
- 1808850
- Math proficiency
- 31% ▼ -9.00%
- Reading proficiency
- 42% ▼ -2.00%
- Median HH income
- $35,624
- Composite
- 30.18/100
- National rank
- #6316
- State rank
- #192 of 301 in IN
Livability — Peru
- Score
- 77/100
- State rank
- #35
- US rank
- #2834
Category grades
Schools grade is shown separately in the Schools card above.
Census & demographics
- Census place
- Peru, IN
- County
- Miami County · 23,020 people
- City population
- 23,020
- Metro
- Peru, IN
- Population (ZIP)
- 23,020
- Household income
- $57,842
- Rent vs Own
- Severe rent burden
- 498.0
Population outlook (Miami County) Hauer SSP2
- Today (2025)
- 34,421 people
- By 2030
- 33,571 · -2.5%
- By 2040
- 31,919 · -7.3%
- By 2050
- 30,313 · -11.9%
- By 2075
- 26,202 · -23.9%
- By 2100
- 20,856 · -39.4%
Race, ethnicity, and origin ACS 2023
- Neighborhood character
- Predominantly White (87%)
- Race & ethnicity
- White 87% Two or more races 6% Hispanic / Latino 4% Black 3%
- Common ancestry
- Iranian 2% Romanian 2% Slovak 2%
- Foreign-born
- 1% · Canada
- Languages at home
- 97% English-only · Spanish 2% German/W. Germanic 0%
Political lean MEDSL · Miami
- 2024 margin
- Solid R (+54.5) · D 21.8% · R 76.3% · Other 1.9%
- 2008→2024 swing
- -35.1pp toward R · 2008: -19.5pp · 2024: -54.5pp
- All cycles
- 2024: R+54.5 2020: R+53.1 2016: R+53.6 2012: R+30.9 2008: R+19.5
Not yet ingested
- Civics
- —
Market trends
- HPI YoY
- ▼ -24.29%
- Current HPI
- 252.7166
- Rent YoY
- —
- Metro
- Peru, IN
- State GDP YoY
- ▲ 2.90%
- F500 in state
- 18
Industry mix (Fortune 500 HQ in IN)
| Industry | F500 HQs | Revenue |
|---|---|---|
| Industrial Machinery | 2 | $37B |
|
||
| Healthcare | 1 | $177B |
|
||
| Pharmaceuticals | 1 | $45B |
|
||
| Metals / Steel | 1 | $18B |
|
||
| Agriculture | 1 | $17B |
|
||
| Packaging | 1 | $12B |
|
||
Price history
2 events — show timeline
- 2026-06-18 Delisted — IRMLS
- 2026-06-18 Listed $110,000 IRMLS
Property tax history
+2.5%/yrLatest (2024): $818 · +18.9% YoY. Source: county tax records.
Cash-flow waterfall
monthlySold comps — $/sqft
last 12 mo · ≤1 miLoading sold comps…