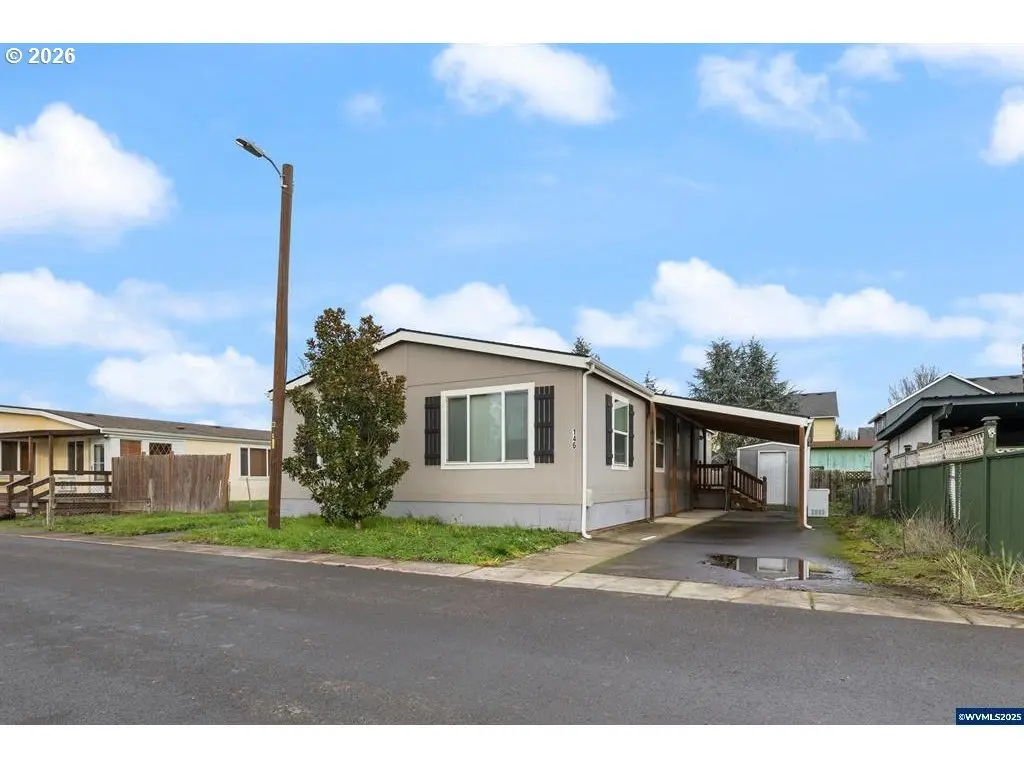
151 Edwards Rd · Monmouth, OR
Flood risk No data
- FEMA flood zone
- —
- Chance of flooding over 30 yrs
- —
- Est. flood insurance / yr
- —
Fire risk No data
- Est. fire insurance / yr
- —
Heat risk No data
- Hot days now (above threshold)
- —
- Hot days in 30 yrs
- —
Wind risk No data
- Chance of severe wind over 30 yrs
- —
Air-quality risk No data
- Unhealthy air days now
- —
- Unhealthy air days in 30 yrs
- —
Risk factors via First Street. Map © Google.
Why this score? — see what drove the C+ grade
The composite is a weighted blend of 9 inputs, each scored 0–100. Each bar is that input's sub-score; the figure is the points it added to the 100-point composite (weight × sub-score).
- Cash flow +26.2/30.0
- DSCR +8.9/10.0
- ARV discount +7.5/15.0
- 1% rule +7.0/10.0
- Livability +3.6/5.0
- Schools +3.1/10.0
- Rent growth +2.5/5.0
- Condition / age +2.5/5.0
- Appreciation +0.0/10.0
$155,000
🖨 Deal sheet (PDF) 📄 Offer letter ✓ Due diligence
Listing remarks MLS
Welcome home to this move-in ready 3-bedroom, 2-bath manufactured home with 1,512 sq ft of comfortable living space. Built in 2016 and thoughtfully refreshed with new carpet, fresh interior paint, and professional cleaning. The inviting layout offers generous living areas and great functionality. Located in a family park, this home is clean, comfortable, and ready for you to move right in.
Key facts
- Built 2016
- Listed 118 days
Neighborhood map
What this means for you Summary
Snapshot
- This is a 3-bed/2.0-bath single-family listed at $155k.
Deal economics
- At list price, monthly cash flow is $395 ($5k/yr) — positive.
- The deal already cash-flows at list — no discount required.
- Meets the 1% rule at list price ($2k rent vs $155k).
- Recommended offer: $141k (9.0% below list) — sets the bar for market timing.
- Cap rate 9.4% vs local median 2.5% in Monmouth — top-decile yield for the area; either an underpriced asset or a hidden risk that comps aren't pricing in. Stress-test before assuming the spread holds.
Location & tenants
- Location reads 72/100 on livability (#108 in OR) — a middle-class / working-renter tenant base. Strengths: crime A+, commute A+, housing B+; Watch: health & safety D+, amenities D, employment D.
- Central SD 13J (town): math 26% / reading 41% proficiency, ranked #149 of 183 in OR (top 81%) — families likely to look elsewhere, expect single-tenant / working-renter base with shorter leases.
- Zoned schools: Ash Creek Elementary School (473 students, 65% FRL); Talmadge Middle School (740 students, 64% FRL); Central High School (1,100 students, 65% FRL).
- Market conditions: 67 active listings in the ZIP; 20 comparable units currently listed for rent nearby; rentals at typical pace (median 25d on market — plan ~3-4 weeks tenant-placement turnaround); 45% of comp listings sitting > 30 days — soft ceiling on asking rent; 177 units permitted in Polk County in 2024 (14 in 5+ unit buildings).
- This rent runs 32% of the median local income ($70k/yr) — at the standard rent-burdened threshold; future hikes will face affordability resistance.
Forward outlook
- Local home prices are declining (-3.0%/yr); year-one equity from $1k of loan paydown is wiped out by about $5k of value loss. Plan a longer hold.
- Polk County population projected at +25% by 2050 — long-run rental-demand tailwind backs the buy-and-hold thesis.
- At projected returns (-3.0% appreciation + 3.0% rent growth), your $43k cash investment doubles in ~10 years — after that, you're playing with house money.
Negotiation context
- It's been on market 119 days — a 9% lower offer ($141k) is reasonable based on typical stale-listing flexibility.
Questions for the listing agent
- It's been on market 119 days. Have you received any prior offers? Is the seller open to a 9% concession, seller financing, or rate buy-down credit?
- Why hasn't it sold? Are there any deal-killer items the seller is aware of (foundation, flood, title, zoning, code violations)?
- Is there a deadline driving the sale (1031 exchange, divorce, estate, relocation)? That informs how much negotiation room exists.
- What's the average days-on-market for RENTAL listings here right now (not sales)? A rising rental-DOM trend means longer vacancies and softer asking-rent achievability than the comps imply.
- What's the recent tenant-quality profile in this submarket — average credit score on applications, eviction rate, late-payment / NSF rate, and stable-employment percentage? A property-management company in the area should have these aggregated.
- How much new for-sale + rental construction is in the pipeline within 1–3 miles? Heavy new supply typically softens prices + rents 12–24 months out; constrained supply supports both.
Investment metrics
- 1% rule
- 1.20% ✓
- Cap rate
- 9.35%
- Cash-on-cash
- 10.93%
- DSCR
- 1.49
- GRM
- 7.0
CMA / ARV
- ARV (median comp)
- $444,537
- List price
- $155,000
- Delta
- -65.13%
- Verdict
- UNDERPRICED
- Comps
- 20 within 1.0 mi
Show comp detail 12 sales within ~0.75 mi
| Address | Dist | Beds/Ba | Sqft | Sold | Price | $/sf | Match |
|---|---|---|---|---|---|---|---|
| 1369 Bentley St E | 0.26mi | 3/2.0 | 1,554 (+3%) | 8mo | $549,000 | $353 | 76 |
| 1328 Alberta Ave E | 0.25mi | 3/2.0 | 1,392 (-8%) | 2mo | $444,500 | $319 | 74 |
| 1466 Ash Creek Dr | 0.53mi | 3/2.0 | 1,574 (+4%) | 7mo | $605,597 | $385 | 63 |
| 1082 Alberta Ave E | 0.31mi | 3/2.0 | 1,356 (-10%) | 8mo | $410,000 | $302 | 62 |
| 1515 Bentley St E | 0.25mi | 4/2.0 (+1) | 1,699 (+12%) | 4mo | $370,000 | $218 | 60 |
| 1176 Gwinn St E | 0.40mi | 3/2.0 | 1,676 (+11%) | 4mo | $573,000 | $342 | 60 |
| 1884 Denali Dr | 0.60mi | 3/2.0 | 1,564 (+3%) | 9mo | $439,000 | $281 | 59 |
| 1665 Gwinn St E | 0.42mi | 3/2.5 | 1,627 (+8%) | 10mo | $495,000 | $304 | 58 |
| 555 N High St | 0.56mi | 3/3.0 | 1,618 (+7%) | 8mo | $435,000 | $269 | 51 |
| 789 Craven St N | 0.62mi | 3/2.0 | 1,627 (+8%) | 9mo | $461,500 | $284 | 51 |
| 89 S Gun Club Rd | 0.73mi | 3/2.0 | 1,345 (-11%) | 8mo | $400,000 | $297 | 41 |
| 751 Catron St N | 0.75mi | 3/1.5 | 1,304 (-14%) | 2mo | $320,000 | $245 | 38 |
Match score weights: distance 35% · size 25% · config 20% · recency 20%. Top-matched comps best support the ARV.
Projected returns pro-forma
-3.0% appreciation · 3.0% rent growth · sell at horizon
- IRR
- 0.1%
- Equity multiple
- 1.00×
- Total profit
- $86
- Equity at exit
- $23,111
- IRR
- 9.7%
- Equity multiple
- 1.75×
- Total profit
- $32,604
- Equity at exit
- $13,402
Cash invested: $43,400 (down + closing). Projections, not guarantees.
Landlord ↔ Tenant lean methodology
- Overall (STATE)
- 28 Tenant-Leaning
- State Oregon
- 28 Tenant-Leaning · D+6
- County
- — inherits STATE
- City
- — inherits STATE
ZIP-level market 97361
- Home prices YoY
- -34.5%
- Active inventory
- 67
- Price-to-rent
- 7.0×
Monthly cashflow live
- Estimated rent
- $1,856 high interval (Pro) →
- Mortgage (P&I)
- −$813
- Tax est. 1.5%
- −$194 /mo · $2,325/yr
- Insurance
- −$65
- HOA
- −$0
- Vacancy / Maint / Mgmt
- −$390
- Net cashflow
- $395
Break-even live
Sensitivity live
| Price | -10% $502 | -5% $449 | +0% $395 | +5% $342 | +10% $288 |
|---|---|---|---|---|---|
| Rent | -10% $249 | -5% $322 | +0% $395 | +5% $469 | +10% $542 |
| Rate | -1.0pp $473 | -0.5pp $435 | base $395 | +0.5pp $355 | +1.0pp $314 |
UW: 25.0% down · 7.5% · 30yr · 1.5% tax · 5.0% vac · 8.0% maint · 8.0% mgmt
Financing live
Cash to close
- Down payment
- $38,750
- Closing costs
- $4,650
- Reserves months
- —
- Total cash needed
- —
Loan-product check · same deal, 3 products live
Conventional
25% down · 7.5% · 30yr
- Down + closing
- —
- Monthly P&I
- —
- Monthly cashflow
- —
- DSCR
- —
- Eligible?
- —
Personal DTI + credit; lowest rate.
DSCR
20% down · 8.5% · 30yr
- Down + closing
- —
- Monthly P&I
- —
- Monthly cashflow
- —
- DSCR
- —
- Eligible?
- —
No personal income docs; deal must DSCR.
Hard money
10% down · 12.0% · 12mo
- Down + closing
- —
- Monthly P&I
- —
- Monthly cashflow
- —
- DSCR
- —
- Eligible?
- —
Short-term bridge; refi at stabilization.
Rent comps 20 comps
| Address | Beds | Baths | Sqft | Rent | $/sqft | DOM | Units | Dist |
|---|---|---|---|---|---|---|---|---|
| 314 Monmouth Independence Hwy Monmouth, OR | 3.0 | 1.0 | 1100 | $1,795 | $1.63 | 45d | 1 | 0.21mi |
| 460 Talmadge Rd Independence, OR | 3.0 | 2.0 | 1886 | $1,995 | $1.06 | 25d | 1 | 0.30mi |
| 1439 Falcon Loop Unit 1439 Independence, OR | 3.0 | 2.5 | 1262 | $1,895 | $1.50 | 25d | 1 | 0.59mi |
| 501 Catron St N Monmouth, OR | 2.0 | 2.0 | 1090 | $1,450 | $1.33 | 15d | 1 | 0.62mi |
| 406 Madrona St E Unit 406 Monmouth, OR | 4.0 | 2.5 | 1250 | $2,000 | $1.60 | 45d | 1 | 0.63mi |
| 1408 Falcon Loop Unit 1408 Independence, OR | 3.0 | 2.0 | 1056 | $1,795 | $1.70 | 15d | 1 | 0.64mi |
| 523 Catron St N Unit 523-05 Monmouth, OR | 2.0 | 2.0 | 1090 | $1,450 | $1.33 | 25d | 1 | 0.65mi |
| 523 Catron St N Unit 523-11 Monmouth, OR | 2.0 | 2.0 | 1090 | $1,400 | $1.28 | 45d | 1 | 0.65mi |
| 468 Catron St N Monmouth, OR | 3.0 | 2.5 | 1300 | $1,895 | $1.46 | 15d | 1 | 0.67mi |
| 537 Catron St N Unit 537-05 Monmouth, OR | 2.0 | 2.0 | 1090 | $1,400 | $1.28 | 45d | 1 | 0.67mi |
| 1400 E St Independence, OR | 2.0–3.0 | 1.0–2.0 | 962 | $1,725 | $1.79 | 15d | 2 | 0.69mi |
| 331 Broad St N Unit 331-3 Monmouth, OR | 2.0 | 1.5 | 1188 | $1,395 | $1.17 | 45d | 1 | 0.70mi |
| 263 Gwinn St E Unit 263 Monmouth, OR | 3.0 | 2.5 | 1250 | $1,795 | $1.44 | 25d | 1 | 0.80mi |
| 1085 Sassafras St Independence, OR | 3.0 | 2.0 | 1679 | $2,350 | $1.40 | 45d | 1 | 1.04mi |
| 1422 Marigold Dr Independence, OR | 3.0 | 2.5 | 1380 | $1,995 | $1.45 | 45d | 1 | 1.04mi |
| 1428 Northgate Dr Independence, OR | 3.0 | 2.5 | 1530 | $2,350 | $1.54 | 45d | 1 | 1.12mi |
| 312 Hoxton Ave Unit 3bd/2ba_1,149sq Monmouth, OR | 3.0 | 2.0 | 1149 | $2,150 | $1.87 | 15d | 1 | 1.17mi |
| 300 Hoxton Ave #202 Monmouth, OR | 3.0 | 2.0 | 1149 | $2,150 | $1.87 | 45d | 1 | 1.18mi |
| 300 Hoxton Ave Monmouth, OR | 2.0–3.0 | 2.0 | 960 | $2,150 | $2.24 | 15d | 9 | 1.18mi |
| 528 S 7th St Unit 1 Independence, OR | 3.0 | 2.0 | 1541 | $2,295 | $1.49 | 25d | 1 | 1.24mi |
Listing history 12 events
-
2026-06-10days on market $155,000 Active 119 DOM
-
2026-06-09days on market $155,000 Active 118 DOM
-
2026-06-08days on market $155,000 Active 117 DOM
-
2026-06-07days on market $155,000 Active 116 DOM
-
2026-06-05days on market $155,000 Active 113 DOM
-
2026-06-03days on market $155,000 Active 112 DOM
-
2026-06-02days on market $155,000 Active 111 DOM
-
2026-06-01days on market $155,000 Active 110 DOM
-
2026-05-31days on market $155,000 Active 109 DOM
-
2026-05-30days on market $155,000 Active 108 DOM
-
2026-02-12price $155,000 392-char remark
Show marketing remark (392 chars)
Welcome home to this move-in ready 3-bedroom, 2-bath manufactured home with 1,512 sq ft of comfortable living space. Built in 2016 and thoughtfully refreshed with new carpet, fresh interior paint, and professional cleaning. The inviting layout offers generous living areas and great functionality. Located in a family park, this home is clean, comfortable, and ready for you to move right in.
-
2026-02-11$165,000 Active 392-char remark
Show marketing remark (392 chars)
Welcome home to this move-in ready 3-bedroom, 2-bath manufactured home with 1,512 sq ft of comfortable living space. Built in 2016 and thoughtfully refreshed with new carpet, fresh interior paint, and professional cleaning. The inviting layout offers generous living areas and great functionality. Located in a family park, this home is clean, comfortable, and ready for you to move right in.
ⓘ Source: listings_history table (triggers on properties + properties_extension) + one-shot
backfill from property_details.listing_events for pre-trigger history.
Nearby sold comps map
Loading sold comps map…
Walkable amenities ~0.75 mi
Loading nearby amenities…
Taxation est. · year 1
- Rental income
- $22,275
- − Mortgage interest
- −$8,682
- − Property taxes
- −$2,325
- − Insurance
- −$775
- − Repairs & maintenance
- −$1,782
- − Management
- −$1,782
- − Depreciation
- −$4,509
- Taxable income
- $2,419
- Est. tax owed @ 24.0%
- −$581
- After-tax cash flow
- $4,162/yr
For passive investors: Depreciation is non-cash, so a rental often shows a tax loss while cash-flowing — sheltering income. Rental losses are passive: they offset passive income freely, and up to $25,000/yr can offset ordinary (W-2) income if you actively participate and your MAGI is under $100k (phasing out to $0 by $150k); unused losses carry forward. On sale, claimed depreciation is recaptured at up to 25%, and gains may owe capital-gains tax (a 1031 exchange can defer both). Figures are a year-1 estimate at your 24.0% rate — not tax advice; consult a CPA.
Schools (NCES district)
- District
- Central SD 13J
- NCES district ID
- 4102840
- Math proficiency
- 26% ▼ -3.00%
- Reading proficiency
- 41% ▼ -2.00%
- Median HH income
- $42,374
- Composite
- 31.04/100
- National rank
- #11310
- State rank
- #149 of 183 in OR
Livability — Monmouth
- Score
- 72/100
- State rank
- #108
- US rank
- #5992
Category grades
Schools grade is shown separately in the Schools card above.
Census & demographics
- Census place
- Monmouth, OR
- County
- Polk County · 84,240 people
- City population
- 14,488
- Metro
- Salem, OR
- Population (ZIP)
- 14,488
- Household income
- $69,505
- Rent vs Own
- Severe rent burden
- 412.0
Population outlook (Polk County) Hauer SSP2
- Today (2025)
- 88,594 people
- By 2030
- 93,209 · +5.2%
- By 2040
- 101,942 · +15.1%
- By 2050
- 110,395 · +24.6%
- By 2075
- 131,091 · +48.0%
- By 2100
- 141,746 · +60.0%
Race, ethnicity, and origin ACS 2023
- Neighborhood character
- Predominantly White (76%)
- Race & ethnicity
- White 76% Hispanic / Latino 16% Two or more races 12% Native American 2% Asian 1%
- Hispanic origin (detail)
- Mexican 15%
- Common ancestry
- Slovak 4% Italian 3% Portuguese 3%
- Foreign-born
- 6% · Canada, South Korea
- Languages at home
- 87% English-only · Spanish 10% Other Asian/Pacific 1% Korean 1%
Political lean MEDSL · Polk
- 2024 margin
- Toss-up / Even · D 46.6% · R 50.4% · Other 3.0%
- 2008→2024 swing
- -3.3pp toward R · 2008: -0.5pp · 2024: -3.8pp
- All cycles
- 2024: R+3.8 2020: R+1.7 2016: R+7.0 2012: R+4.8 2008: R+0.5
Not yet ingested
- Civics
- —
Market trends
- HPI YoY
- ▼ -162.97%
- Current HPI
- 309.076
- Rent YoY
- —
- Metro
- Salem, OR
- State GDP YoY
- ▲ 2.05%
- F500 in state
- 2
Industry mix (Fortune 500 HQ in OR)
| Industry | F500 HQs | Revenue |
|---|---|---|
| Consumer Goods | 1 | $51B |
|
||
Price history
-6.1% since first listed2 events — show timeline
- 2026-02-12 Price Changed $155,000 RMLS
- 2026-02-11 Listed $165,000 RMLS
Cash-flow waterfall
monthlySold comps — $/sqft
last 12 mo · ≤1 miLoading sold comps…