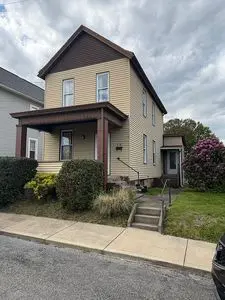
478 Heller St · Rochester, PA
Flood risk 1/10 · Minimal
- FEMA flood zone
- X (unshaded)
- Chance of flooding over 30 yrs
- 0.0%
- Est. flood insurance / yr
- $473 – $860
Fire risk 1/10 · Minimal
- Est. fire insurance / yr
- $511 – $949
Heat risk 4/10 · Minor
- Hot days now (above 97°F)
- 7 days/yr
- Hot days in 30 yrs
- 18 days/yr
Wind risk 2/10 · Minimal
- Chance of severe wind over 30 yrs
- 0.0%
Air-quality risk 3/10 · Minor
- Unhealthy air days now
- 2 days/yr
- Unhealthy air days in 30 yrs
- 4 days/yr
Risk factors via First Street. Map © Google.
Why this score? — see what drove the C- grade
The composite is a weighted blend of 9 inputs, each scored 0–100. Each bar is that input's sub-score; the figure is the points it added to the 100-point composite (weight × sub-score).
- Cash flow +15.1/30.0
- ARV discount +15.0/15.0
- 1% rule +4.9/10.0
- DSCR +4.6/10.0
- Livability +4.0/5.0
- Schools +3.3/10.0
- Rent growth +2.5/5.0
- Condition / age +2.5/5.0
- Appreciation +0.0/10.0
$112,500
🖨 Deal sheet (PDF) 📄 Offer letter ✓ Due diligence
Listing remarks
This charming two-story home is nestled on a quiet street in Rochester, just one block from Rochester school & acirc; & euro; & rdquo; perfect for convenience and a peaceful neighborhood setting. The home features two comfortable bedrooms with natural light and a spacious, well-appointed kitchen that offers plenty of room for cooking and gathering. A dedicated laundry and mud room adds everyday functionality, while the full bathroom is centrally located for easy access. The property also includes a garage for parking or additional storage. For added value and move-in readiness, the home comes equipped with a refrigerator, stove and microwave, making it an ideal choice for those
Key facts
- Built 1900
- Listed 22 days
Tags
Neighborhood map
What this means for you Summary
Snapshot
- This is a 2-bed/1.0-bath single-family listed at $112k.
Deal economics
- At list price, monthly cash flow is $37 ($448/yr) — positive.
- The deal already cash-flows at list — no discount required.
- To meet the 1% rule (rent ≥ 1% of price), the offer needs to be $112k (0.7% below list).
- Recommended offer: $111k (1.5% below list) — sets the bar for market timing.
Location & tenants
- Location reads 80/100 on livability (#220 in PA, #1,937 nationally) — a professional / high-income tenant draw. Strengths: commute A+, cost of living A+, health & safety A+; Watch: amenities D, crime F, employment F.
- Rochester Area SD (rural): math 28% / reading 50% proficiency, ranked #375 of 539 in PA (top 70%) — families likely to look elsewhere, expect single-tenant / working-renter base with shorter leases.
- Zoned schools: Rochester Area El Sch (math 42% / reading 57%, grade D, #654 of 1,518 statewide, top 47%, 334 students, 100% FRL); Rochester Ms (math 17% / reading 42%, grade F, #385 of 512 statewide, top 76%, 160 students, 100% FRL); Rochester High School (math 34%, 225 students, 83% FRL) — zoned schools average 94% FRL vs 57% district-wide (37 pts higher); higher-poverty schools than district average — tighter screening recommended.
- Market conditions: 35 active listings in the ZIP; 10 comparable units currently listed for rent nearby; rentals at typical pace (median 17d on market — plan ~3-4 weeks tenant-placement turnaround); 272 units permitted in Beaver County in 2024 (80 in 5+ unit buildings).
Forward outlook
- Local home prices are declining (-3.0%/yr); year-one equity from $778 of loan paydown is wiped out by about $3k of value loss. Plan a longer hold.
- Beaver County population projected at -14% by 2050 — secular population decline; favor cash flow + early exit over multi-decade hold.
Negotiation context
- It's been on market 22 days — a 2% lower offer ($111k) is reasonable based on typical stale-listing flexibility.
- Current owner paid $40k; list at $112k implies a 185% gain — meaningful room to come down on a strong offer.
Risks & watch-outs
- Watch-outs: built in 1900 — expect roof / HVAC / electrical / plumbing capex.
Questions for the listing agent
- Built in 1900 — when were the roof, HVAC, electrical panel, plumbing, and water heater last replaced?
- Is there a deadline driving the sale (1031 exchange, divorce, estate, relocation)? That informs how much negotiation room exists.
- Crime grade is F in this area — have there been break-ins, vandalism, or insurance claims at this property in the last 3 years? What carrier currently insures it and at what premium?
- What's the average days-on-market for RENTAL listings here right now (not sales)? A rising rental-DOM trend means longer vacancies and softer asking-rent achievability than the comps imply.
- What's the recent tenant-quality profile in this submarket — average credit score on applications, eviction rate, late-payment / NSF rate, and stable-employment percentage? A property-management company in the area should have these aggregated.
- How much new for-sale + rental construction is in the pipeline within 1–3 miles? Heavy new supply typically softens prices + rents 12–24 months out; constrained supply supports both.
Investment metrics
- 1% rule
- 0.99% ✗
- Cap rate
- 6.69%
- Cash-on-cash
- 1.42%
- DSCR
- 1.06
- GRM
- 8.4
CMA / ARV
- ARV (on-the-fly)
- $148,717
- Comps found
- 12
Show comp detail 12 sales within ~0.75 mi
| Address | Dist | Beds/Ba | Sqft | Sold | Price | $/sf | Match |
|---|---|---|---|---|---|---|---|
| 467 Reno St | 0.09mi | 3/1.0 (+1) | 1,092 (-7%) | 4mo | $50,000 | $46 | 76 |
| 531 Reno St | 0.14mi | 2/2.0 | 1,108 (-5%) | 6mo | $199,000 | $180 | 75 |
| 478 Reno St | 0.07mi | 3/1.0 (+1) | 1,232 (+5%) | 9mo | $95,500 | $78 | 75 |
| 444 E Washington St | 0.35mi | 3/1.0 (+1) | 1,165 (-0%) | 7mo | $40,000 | $34 | 72 |
| 582 E Madison St | 0.23mi | 2/1.0 | 1,088 (-7%) | 11mo | $129,000 | $119 | 68 |
| 147 Monroe St | 0.50mi | 3/1.0 (+1) | 1,170 (-0%) | 8mo | $155,000 | $132 | 64 |
| 16 Community Springs Ct | 0.22mi | 3/1.5 (+1) | 1,071 (-8%) | 5mo | $55,000 | $51 | 64 |
| 424 Pennsylvania Ave | 0.06mi | 3/2.5 (+1) | 1,320 (+13%) | 1mo | $90,000 | $68 | 64 |
| 469 Ohio Ave | 0.19mi | 3/2.0 (+1) | 1,334 (+14%) | 0mo | $170,000 | $127 | 58 |
| 580 New York Ave | 0.31mi | 3/2.5 (+1) | 1,248 (+7%) | 8mo | $239,000 | $192 | 57 |
| 612 Virginia Ave | 0.40mi | 2/1.0 | 1,008 (-14%) | 4mo | $170,000 | $169 | 55 |
| 158 Maple St | 0.66mi | 3/2.0 (+1) | 1,200 (+2%) | 7mo | $195,000 | $163 | 50 |
Match score weights: distance 35% · size 25% · config 20% · recency 20%. Top-matched comps best support the ARV.
Projected returns pro-forma
-3.0% appreciation · 3.0% rent growth · sell at horizon
- IRR
- -14.0%
- Equity multiple
- 0.50×
- Total profit
- $-15,795
- Equity at exit
- $16,774
- IRR
- -5.1%
- Equity multiple
- 0.67×
- Total profit
- $-10,458
- Equity at exit
- $9,727
Cash invested: $31,500 (down + closing). Projections, not guarantees.
Landlord ↔ Tenant lean methodology
- Overall (STATE)
- 62 Landlord-Friendly
- State Pennsylvania
- 62 Landlord-Friendly · EVEN
- County
- — inherits STATE
- City
- — inherits STATE
ZIP-level market 15074
- Active inventory
- 35
- Price-to-rent
- 8.4×
Monthly cashflow live
- Estimated rent
- $1,117 high interval (Pro) →
- Mortgage (P&I)
- −$590
- Tax from tax record
- −$208 /mo · $2,498/yr
- Insurance
- −$47
- HOA
- −$0
- Lot rent
- −$0
- Vacancy / Maint / Mgmt
- −$235
- Net cashflow
- $37
Break-even live
Sensitivity live
| Price | -10% $101 | -5% $69 | +0% $37 | +5% $5 | +10% $-26 |
|---|---|---|---|---|---|
| Rent | -10% $-51 | -5% $-7 | +0% $37 | +5% $81 | +10% $126 |
| Rate | -1.0pp $94 | -0.5pp $66 | base $37 | +0.5pp $8 | +1.0pp $-22 |
UW: 25.0% down · 7.5% · 30yr · 1.5% tax · 5.0% vac · 8.0% maint · 8.0% mgmt
Financing live
Cash to close
- Down payment
- $28,125
- Closing costs
- $3,375
- Reserves months
- —
- Total cash needed
- —
Loan-product check · same deal, 3 products live
Conventional
25% down · 7.5% · 30yr
- Down + closing
- —
- Monthly P&I
- —
- Monthly cashflow
- —
- DSCR
- —
- Eligible?
- —
Personal DTI + credit; lowest rate.
DSCR
20% down · 8.5% · 30yr
- Down + closing
- —
- Monthly P&I
- —
- Monthly cashflow
- —
- DSCR
- —
- Eligible?
- —
No personal income docs; deal must DSCR.
Hard money
10% down · 12.0% · 12mo
- Down + closing
- —
- Monthly P&I
- —
- Monthly cashflow
- —
- DSCR
- —
- Eligible?
- —
Short-term bridge; refi at stabilization.
Rent comps 10 comps
| Address | Beds | Baths | Sqft | Rent | $/sqft | DOM | Units | Dist |
|---|---|---|---|---|---|---|---|---|
| 467 Reno St Rochester, PA | 3.0 | 1.0 | 1092 | $1,200 | $1.10 | 0d | 1 | 0.07mi |
| 526 Adams St Unit 2 Rochester, PA | 3.0 | 1.0 | 1000 | $850 | $0.85 | 46d | 1 | 0.24mi |
| 243 Pennsylvania Ave Unit 1 Rochester, PA | 2.0 | 1.0 | 1000 | $1,100 | $1.10 | 17d | 1 | 0.29mi |
| 230 W Madison St Unit 6 Rochester, PA | 2.0 | 1.0 | 975 | $1,100 | $1.13 | 0d | 1 | 0.32mi |
| 549 Virginia Ave Unit 1 Rochester, PA | 2.0 | 1.0 | 1000 | $1,075 | $1.07 | 10d | 1 | 0.37mi |
| 718 Virginia Ave Unit 2 Rochester, PA | 2.0 | 1.0 | 750 | $850 | $1.13 | 0d | 1 | 0.75mi |
| 169 Route 68 Rochester, PA | 3.0 | 1.5 | 1500 | $1,600 | $1.07 | 26d | 1 | 0.90mi |
| 743 Wolf Ave Rochester, PA | 3.0 | 1.0 | 1500 | $1,375 | $0.92 | 46d | 1 | 0.93mi |
| 264 Beaver St Beaver, PA | 1.0 | 1.0 | 800 | $950 | $1.19 | 0d | 1 | 1.29mi |
| 464 4th St Unit 6 Beaver, PA | 2.0 | 1.0 | 891 | $1,195 | $1.34 | 19d | 1 | 1.36mi |
Listing history 13 events
-
2026-06-16status $112,500 Under Contract 22 DOM
-
2026-06-15days on market $112,500 Active 22 DOM
-
2026-06-13days on market $112,500 Active 20 DOM
-
2026-06-09days on market $112,500 Active 16 DOM
-
2026-06-08days on market $112,500 Active 15 DOM
-
2026-06-07days on market $112,500 Active 14 DOM
-
2026-06-03days on market $112,500 Active 10 DOM
-
2026-06-02days on market $112,500 Active 9 DOM
-
2026-06-01days on market $112,500 Active 8 DOM
-
2026-05-31days on market $112,500 Active 7 DOM
-
2026-05-25$112,500 Active
-
2000-09-18soldstatus $39,500
-
1983-06-13soldstatus $28,500
ⓘ Source: listings_history table (triggers on properties + properties_extension) + one-shot
backfill from property_details.listing_events for pre-trigger history.
Tax reassessment forecast PA · Partial reset (capped growth)
- Current annual tax
- $2,498 · $208/mo
- Projected year-2 tax
- $2,498 · $208/mo
- Expected delta
- $0/yr ($0/mo · 0.0%)
ⓘ Screening estimate from a state-policy table — verify with the county assessor before closing.
Climate risk First Street
- Flood 1/10 Low FEMA zone X (unshaded) · 0% chance over 30 yrs
- Wildfire 1/10 Low
- Heat 4/10 Moderate 7 d/yr ≥97°F today · 18 d/yr by 30 yrs out
- Wind 2/10 Low 0% chance of damaging wind over 30 yrs
- Air quality 3/10 Moderate 2 unhealthy d/yr today · 4 by 30 yrs out
Nearby sold comps map
Loading sold comps map…
Walkable amenities ~0.75 mi
Loading nearby amenities…
Taxation est. · year 1
- Rental income
- $13,403
- − Mortgage interest
- −$6,302
- − Property taxes
- −$2,498
- − Insurance
- −$562
- − Repairs & maintenance
- −$1,072
- − Management
- −$1,072
- − Depreciation
- −$3,273
- Taxable loss
- −$1,377
- Est. tax savings @ 24.0%
- +$331
- After-tax cash flow
- $778/yr
For passive investors: Depreciation is non-cash, so a rental often shows a tax loss while cash-flowing — sheltering income. Rental losses are passive: they offset passive income freely, and up to $25,000/yr can offset ordinary (W-2) income if you actively participate and your MAGI is under $100k (phasing out to $0 by $150k); unused losses carry forward. On sale, claimed depreciation is recaptured at up to 25%, and gains may owe capital-gains tax (a 1031 exchange can defer both). Figures are a year-1 estimate at your 24.0% rate — not tax advice; consult a CPA.
Schools (NCES district)
- District
- Rochester Area SD
- NCES district ID
- 4220460
- Math proficiency
- 28% ▼ -3.00%
- Reading proficiency
- 50% ▼ -9.00%
- Median HH income
- $40,841
- Composite
- 32.7/100
- National rank
- #5644
- State rank
- #375 of 539 in PA
Livability — Rochester
- Score
- 80/100
- State rank
- #220
- US rank
- #1937
Category grades
Schools grade is shown separately in the Schools card above.
Census & demographics
- Census place
- Rochester, PA
- Population (ZIP)
- 8,543
Population outlook (Beaver County) Hauer SSP2
- Today (2025)
- 164,976 people
- By 2030
- 161,449 · -2.1%
- By 2040
- 151,752 · -8.0%
- By 2050
- 141,155 · -14.4%
- By 2075
- 118,142 · -28.4%
- By 2100
- 91,740 · -44.4%
Race, ethnicity, and origin ACS 2023
- Neighborhood character
- Predominantly White (85%)
- Race & ethnicity
- White 85% Black 8% Two or more races 6%
- Common ancestry
- Romanian 4% Slovak 2% Serbian 2%
- Foreign-born
- 2%
- Languages at home
- 96% English-only · German/W. Germanic 3% French/Haitian/Cajun 1%
Political lean MEDSL · Beaver
- 2024 margin
- Strong R (+20.7) · D 39.2% · R 59.9%
- 2008→2024 swing
- -17.9pp toward R · 2008: -2.8pp · 2024: -20.7pp
- All cycles
- 2024: R+20.7 2020: R+17.7 2016: R+20.1 2012: R+6.6 2008: R+2.8
Not yet ingested
- Civics
- —
Market trends
- HPI YoY
- ▼ -92.06%
- Current HPI
- 166.4711
- Rent YoY
- —
- Metro
- —
- State GDP YoY
- ▲ 1.68%
- F500 in state
- 34
Industry mix (Fortune 500 HQ in PA)
| Industry | F500 HQs | Revenue |
|---|---|---|
| Healthcare | 2 | $309B |
|
||
| Insurance | 2 | $27B |
|
||
| Telecommunications / Media | 1 | $124B |
|
||
| Industrial Distribution | 1 | $22B |
|
||
| Financial Services | 1 | $20B |
|
||
| Chemicals / Materials | 1 | $18B |
|
||
Price history
+294.7% since first listed3 events — show timeline
- 2026-05-25 Listed $112,500 FSBO.com
- 2000-09-18 Sold (Public Records) $39,500 Public Records
- 1983-06-13 Sold (Public Records) $28,500 Public Records
Property tax history
+3.6%/yrLatest (2026): $2,498 · +2.9% YoY. Source: county tax records.
Cash-flow waterfall
monthlySold comps — $/sqft
last 12 mo · ≤1 miLoading sold comps…