193 Robin Hood Cir #203 · Naples, FL
Flood risk 1/10 · Minimal
- FEMA flood zone
- X (unshaded)
- Chance of flooding over 30 yrs
- 0.0%
- Est. flood insurance / yr
- $507 – $1,088
Fire risk 3/10 · Minor
- Est. fire insurance / yr
- $947 – $1,759
Heat risk 9/10 · Severe
- Hot days now (above 107°F)
- 5 days/yr
- Hot days in 30 yrs
- 20 days/yr
Wind risk 10/10 · Severe
- Chance of severe wind over 30 yrs
- 99.0%
Air-quality risk 2/10 · Minimal
- Unhealthy air days now
- 2 days/yr
- Unhealthy air days in 30 yrs
- 2 days/yr
Risk factors via First Street. Map © Google.
Why this score? — see what drove the D+ grade
The composite is a weighted blend of 9 inputs, each scored 0–100. Each bar is that input's sub-score; the figure is the points it added to the 100-point composite (weight × sub-score).
- Cash flow +16.3/30.0
- ARV discount +7.5/15.0
- 1% rule +5.8/10.0
- DSCR +5.0/10.0
- Schools +5.0/10.0
- Livability +4.0/5.0
- Condition / age +2.5/5.0
- Rent growth +2.2/5.0
- Appreciation +0.0/10.0
$249,999
🖨 Deal sheet (PDF) 📄 Offer letter ✓ Due diligence
Listing remarks
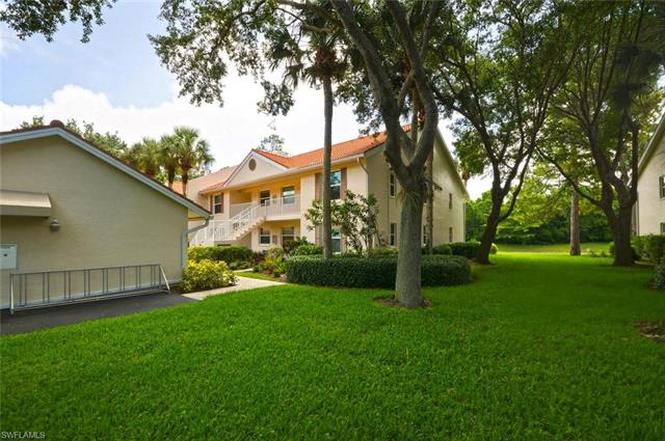
RARELY AVAILABLE! Enjoy spectacular lake views, lush tropical landscaping, and a peaceful preserve backdrop from this beautiful second-floor condo in the highly sought-after Sherwood community. Offering brand new impact windows and slider in this 2 bedrooms, 2 baths, with a detached 1-car garage is this move-in-ready residence and delivers the perfect combination of comfort, privacy, and the Naples lifestyle buyers are searching for. Designed to maximize natural light and showcase the stunning scenery, this well-maintained home features impact-resistant windows and an impact glass sliding door, providing peace of mind and energy efficiency. Recent improvements include a new A/C system, wate
Key facts
- New a/c system
- Long lake views
- Updated countertops
Tags
Property features AI
Other
- Other: Possession at closing; Part of a complex with 104 units and 8 units in the building (1 floor; 2 units per floor); Irrigation: central
Finance
- HOA & community: Mandatory HOA; Quarterly condo fee ($1,550); Total annual recurring fees: $6,200; One-time fees: $150; Professional management; Maintenance covers cable, insurance, internet/Wi‑Fi, irrigation water, lawn/land maintenance, legal/accounting, manager, exterior pest control, reserves, street lights, street maintenance, and trash removal; Community amenities include clubhouse, community pool, spa/hot tub, exercise room, billiards, business center, library, bike/jog path, pickleball, sidewalks, and streetlights; Community type: non-gated with tennis
Exterior
- Parking: Deeded assigned parking (1 space); Detached garage; Guest parking; Paved parking
- Security: Garage secured; Impact resistant windows
- Utilities: Central water; Central sewer; Cable available
- Home design: Residential garden apartment in a low-rise (1–3) building; Built in 1997; Concrete block construction; Stucco exterior; Tile roof; Rear exposure faces southeast; Unit: 203 in the Sherwood community
- Construction: Concrete block construction; Stucco finish; Tile roof; Built in 1997; Garden apartment building design
- Exterior features: Automatic sprinkler system; Water display/feature; Lake frontage/view; Landscaped areas; Wooded area views; Paved road access; Zero lot line
Interior
- Kitchen: Pantry; Dishwasher; Disposal; Microwave; Range; Self-cleaning oven; Refrigerator/Freezer; Breakfast bar; Eat-in kitchen; Dining (family) area
- Bedrooms: 2 bedrooms with a split bedroom floor plan
- Flooring: Carpet; Tile
- Bathrooms: 2 full bathrooms; Master bath with shower only
- Heating & cooling: Central electric heat; Central electric cooling; Ceiling fans
- Interior features: Pantry; Smoke detectors; Volume ceilings; Window coverings; Screened lanai/porch; Partially furnished; Five ceiling fans
- Laundry & utility: Washer and dryer in residence
Neighborhood map
What this means for you Summary
Snapshot
- This is a 2-bed/2.0-bath condo listed at $250k.
Deal economics
- At list price, monthly cash flow is $137 ($2k/yr) — positive.
- The deal already cash-flows at list — no discount required.
- Meets the 1% rule at list price ($3k rent vs $250k).
Location & tenants
- Location reads 80/100 on livability (#126 in FL, #1,903 nationally) — a professional / high-income tenant draw. Strengths: crime A+, amenities A+, employment A+; Watch: commute D+, cost of living F.
- Collier (suburban): math 60% / reading 56% proficiency, ranked #16 of 73 in FL (top 22%) — acceptable for families but not a draw, mixed tenant base, ~2y average lease.
- Zoned schools: Mike Davis Elementary School (math 50% / reading 47%, grade D, #1,152 of 2,144 statewide, top 55%, 574 students, 71% FRL); East Naples Middle School (math 56% / reading 44%, grade C, #254 of 571 statewide, top 45%, 854 students, 63% FRL); Golden Gate High School (math 38% / reading 39%, grade F, #321 of 667 statewide, top 49%, 1,764 students, 53% FRL).
- Zoned-school proficiency averages 46% at this address vs 58% district-wide (-12 pts) — the specific schools serving this property underperform the Collier average; the district grade overstates school quality for this exact location.
- Market conditions: Rents soft (-1.1%/yr); 438 active listings in the ZIP; 40 comparable units currently listed for rent nearby; rentals at typical pace (median 16d on market — plan ~3-4 weeks tenant-placement turnaround); 3,520 units permitted in Collier County in 2024 (959 in 5+ unit buildings).
- At $2,695/mo this rent would consume 45% of the median local household income ($72k/yr) (locally 1423% of renters already pay >50% of income on rent) — very limited rent-growth headroom before tenants either downsize or default.
Forward outlook
- Local home prices are declining (-3.0%/yr); year-one equity from $2k of loan paydown is wiped out by about $8k of value loss. Plan a longer hold.
- Collier County population projected at +30% by 2050 — long-run rental-demand tailwind backs the buy-and-hold thesis.
Negotiation context
- Only 4 days on market — expect competitive offers; lowballing is unlikely to land.
- Current owner paid $134k; list at $250k implies a 87% gain — meaningful room to come down on a strong offer.
Risks & watch-outs
- Climate carrying-cost: severe wind risk, 99% chance of damaging wind over 30y; extreme-heat days projected 5→20/yr by 2055 (HVAC capex compounding) — expect insurance premiums to compound above CPI over the hold.
Questions for the listing agent
- What does the HOA fee cover, when was the last increase, and are there any pending special assessments or reserve-fund shortfalls?
- Any open or pending special assessments — roof, HVAC, plumbing, elevator, façade? What's the per-unit balance and payoff schedule, and is the seller paying it off at close or rolling it to the buyer?
- Is there a deadline driving the sale (1031 exchange, divorce, estate, relocation)? That informs how much negotiation room exists.
- Schools are B-rated — typically a magnet for longer-tenancy family renters. What's the average tenant stay here, and is there a school-zone premium baked into asking?
- The area grade is low — what's the realistic commute time and amenity access for the typical tenant pool here? Any planned neighborhood developments (good or bad) we should know about?
- What's the average days-on-market for RENTAL listings here right now (not sales)? A rising rental-DOM trend means longer vacancies and softer asking-rent achievability than the comps imply.
- What's the recent tenant-quality profile in this submarket — average credit score on applications, eviction rate, late-payment / NSF rate, and stable-employment percentage? A property-management company in the area should have these aggregated.
- How much new apartment / multifamily construction is in the pipeline within 1–3 miles? Heavy new supply (>2% of stock underway) typically softens rents 12–24 months out; light construction supports rent growth.
Investment metrics
- 1% rule
- 1.08% ✓
- Cap rate
- 6.95%
- Cash-on-cash
- 2.35%
- DSCR
- 1.10
- GRM
- 7.7
CMA / ARV
No comps found within radius.
Projected returns pro-forma
-3.0% appreciation · 0.0% rent growth · sell at horizon
- IRR
- -16.4%
- Equity multiple
- 0.44×
- Total profit
- $-39,480
- Equity at exit
- $37,276
- IRR
- -15.9%
- Equity multiple
- 0.25×
- Total profit
- $-52,840
- Equity at exit
- $21,615
Cash invested: $70,000 (down + closing). Projections, not guarantees.
Landlord ↔ Tenant lean methodology
- Overall (STATE)
- 87 Strongly Landlord-Friendly
- State Florida
- 87 Strongly Landlord-Friendly · R+3
- County
- — inherits STATE
- City
- — inherits STATE
ZIP-level market 34104
- Rents YoY
- -1.1%
- Active inventory
- 438
- Price-to-rent
- 7.7×
Monthly cashflow live
- Estimated rent
- $2,695 high interval (Pro) →
- Mortgage (P&I)
- −$1,311
- Tax from tax record
- −$60 /mo · $716/yr
- Insurance
- −$104
- HOA
- −$517
- Vacancy / Maint / Mgmt
- −$566
- Net cashflow
- $137
Break-even live
Sensitivity live
| Price | -10% $279 | -5% $208 | +0% $137 | +5% $66 | +10% $-5 |
|---|---|---|---|---|---|
| Rent | -10% $-76 | -5% $31 | +0% $137 | +5% $243 | +10% $350 |
| Rate | -1.0pp $263 | -0.5pp $201 | base $137 | +0.5pp $72 | +1.0pp $6 |
UW: 25.0% down · 7.5% · 30yr · 1.5% tax · 5.0% vac · 8.0% maint · 8.0% mgmt
Financing live
Cash to close
- Down payment
- $62,500
- Closing costs
- $7,500
- Reserves months
- —
- Total cash needed
- —
Loan-product check · same deal, 3 products live
Conventional
25% down · 7.5% · 30yr
- Down + closing
- —
- Monthly P&I
- —
- Monthly cashflow
- —
- DSCR
- —
- Eligible?
- —
Personal DTI + credit; lowest rate.
DSCR
20% down · 8.5% · 30yr
- Down + closing
- —
- Monthly P&I
- —
- Monthly cashflow
- —
- DSCR
- —
- Eligible?
- —
No personal income docs; deal must DSCR.
Hard money
10% down · 12.0% · 12mo
- Down + closing
- —
- Monthly P&I
- —
- Monthly cashflow
- —
- DSCR
- —
- Eligible?
- —
Short-term bridge; refi at stabilization.
Rent comps 40 comps
| Address | Beds | Baths | Sqft | Rent | $/sqft | DOM | Units | Dist |
|---|---|---|---|---|---|---|---|---|
| 209 Robin Hood Cir #201 Naples, FL | 2.0 | 2.0 | 1225 | $3,500 | $2.86 | 15d | 1 | 0.05mi |
| 241 Robin Hood Cir #204 Naples, FL | 2.0 | 2.0 | 1225 | $3,800 | $3.10 | 15d | 1 | 0.09mi |
| 7823 Regal Heron Cir #103 Naples, FL | 2.0 | 2.0 | 1304 | $1,995 | $1.53 | 15d | 1 | 0.14mi |
| 8215 Ibis Club Dr #102 Naples, FL | 2.0 | 2.0 | 1043 | $1,625 | $1.56 | 25d | 1 | 0.15mi |
| 280 Robin Hood Cir #102 Naples, FL | 3.0 | 2.0 | 1450 | $3,995 | $2.76 | 25d | 1 | 0.16mi |
| 280 Robin Hood Cir #101 Naples, FL | 3.0 | 2.0 | 1413 | $3,900 | $2.76 | 25d | 1 | 0.16mi |
| 8225 Ibis Club Dr #216 Naples, FL | 1.0 | 1.0 | 828 | $1,600 | $1.93 | 23d | 1 | 0.18mi |
| 8225 Ibis Club Dr #216 Naples, FL | 1.0 | 1.0 | 811 | $1,650 | $2.03 | 25d | 1 | 0.18mi |
| 321 Robin Hood Cir #201 Naples, FL | 2.0 | 2.0 | 1225 | $3,500 | $2.86 | 25d | 1 | 0.19mi |
| 7818 Great Heron Way #303 Naples, FL | 2.0 | 2.0 | 1304 | $3,395 | $2.60 | 15d | 1 | 0.20mi |
| 7831 Regal Heron Cir Unit 1506858P Naples, FL | 3.0 | 2.0 | 1420 | $4,283 | $3.02 | 15d | 1 | 0.21mi |
| 7822 Great Heron Way #106 Naples, FL | 3.0 | 2.0 | 1431 | $2,200 | $1.54 | 15d | 1 | 0.22mi |
| 7822 Great Heron Way #106 Naples, FL | 3.0 | 2.0 | 1431 | $2,200 | $1.54 | 25d | 1 | 0.22mi |
| 7804 Regal Heron Cir #304 Naples, FL | 2.0 | 2.0 | 1304 | $2,000 | $1.53 | 15d | 1 | 0.24mi |
| 7835 Regal Heron Cir Naples, FL | 2.0–3.0 | 2.0 | 1316 | $1,795 | $1.36 | 25d | 2 | 0.24mi |
| 8245 Ibis Club Dr #403 Naples, FL | 1.0 | 1.0 | 811 | $1,600 | $1.97 | 15d | 1 | 0.25mi |
| 8265 Ibis Club Dr #610 Naples, FL | 1.0 | 1.0 | 811 | $1,600 | $1.97 | 25d | 1 | 0.28mi |
| 7839 Regal Heron Cir #202 Naples, FL | 2.0 | 2.0 | 1202 | $2,000 | $1.66 | 25d | 1 | 0.28mi |
| 8255 Ibis Club Dr Naples, FL | 2.0 | 2.0 | 1021 | $1,750 | $1.71 | 15d | 2 | 0.30mi |
| 8285 Ibis Club Dr #805 Naples, FL | 3.0 | 2.0 | 1175 | $2,450 | $2.09 | 25d | 1 | 0.32mi |
| 120 Asaf Dr Unit 4304 Naples, FL | 2.0 | 2.0 | 1350 | $4,300 | $3.19 | 15d | 1 | 0.47mi |
| 218 Gabriel Cir Unit 3809 Naples, FL | 2.0 | 2.0 | 1200 | $3,800 | $3.17 | 15d | 1 | 0.47mi |
| 153 Gabriel Cir Unit 3003 Naples, FL | 2.0 | 2.0 | 1200 | $4,000 | $3.33 | 15d | 1 | 0.55mi |
| 675 Luisa Ln Unit 825 Naples, FL | 3.0 | 2.0 | 1484 | $2,300 | $1.55 | 15d | 1 | 0.57mi |
| 448 Gabriel Cir Unit 3310 Naples, FL | 2.0 | 2.0 | 1200 | $3,500 | $2.92 | 15d | 1 | 0.62mi |
| 228 Belina Dr Unit 606 Naples, FL | 2.0 | 2.0 | 1200 | $4,800 | $4.00 | 15d | 1 | 0.65mi |
| 620 Luisa Ct Unit 803 Naples, FL | 2.0 | 2.0 | 1200 | $2,400 | $2.00 | 15d | 1 | 0.66mi |
| 120 Bedzel Cir Naples, FL | 1.0–3.0 | 1.0–2.0 | 1079 | $2,518 | $2.33 | 15d | 38 | 0.69mi |
| 515 Gabriel Cir Unit 1910 Naples, FL | 2.0 | 2.0 | 1200 | $4,700 | $3.92 | 15d | 1 | 0.70mi |
| 388 Belina Dr Unit 1104 Naples, FL | 2.0 | 2.0 | 1200 | $4,000 | $3.33 | 15d | 1 | 0.71mi |
| 484 Belina Dr Naples, FL | 2.0 | 1.0 | 1200 | $2,400 | $2.00 | 25d | 1 | 0.77mi |
| 3250 Magnolia Pond Dr Naples, FL | 1.0–3.0 | 1.0–2.0 | 1039 | $2,349 | $2.26 | 15d | 20 | 0.79mi |
| 7790 Woodbrook Cir #2603 Naples, FL | 3.0 | 2.5 | 1406 | $4,500 | $3.20 | 25d | 1 | 0.91mi |
| 7725 Tara Cir Naples, FL | 1.0–3.0 | 1.0–2.0 | 929 | $1,512 | $1.63 | 15d | 1 | 0.93mi |
| 1180 Wildwood Lakes Blvd Naples, FL | 2.0 | 1.0–2.0 | 975 | $1,850 | $1.90 | 23d | 2 | 0.94mi |
| 1180 Wildwood Lakes Blvd Naples, FL | 2.0 | 1.0–2.0 | 975 | $1,800 | $1.85 | 25d | 3 | 0.94mi |
| 1260 Wildwood Lakes Blvd Naples, FL | 1.0–2.0 | 1.0–2.0 | 856 | $2,620 | $3.06 | 15d | 4 | 0.94mi |
| 1240 Wildwood Lakes Blvd Naples, FL | 2.0 | 2.0 | 1042 | $1,875 | $1.80 | 25d | 2 | 0.97mi |
| 1270 Wildwood Lakes Blvd #202 Naples, FL | 2.0 | 1.0 | 909 | $1,909 | $2.10 | 15d | 1 | 0.98mi |
| 1270 Wildwood Lakes Blvd #202 Naples, FL | 2.0 | 1.0 | 909 | $1,900 | $2.09 | 25d | 1 | 0.98mi |
HOA detail condo
- Monthly dues
- $517 · $6,204/yr
- Likely covers
- landscaping
- Assessments
- None detected in remarks — confirm with the listing agent.
Listing history 3 events
-
2026-06-21days on market $249,999 Active 4 DOM
-
2026-06-18remarks 699-char remark
-
2026-06-18$249,999 Active 1 DOM
ⓘ Source: listings_history table (triggers on properties + properties_extension) + one-shot
backfill from property_details.listing_events for pre-trigger history.
Tax reassessment forecast FL · Resets to sale price
- Current annual tax
- $716 · $60/mo
- Projected year-2 tax
- $2,075 · $173/mo
- Expected delta
- +$1,359/yr (+$113/mo · 189.7%)
ⓘ Screening estimate from a state-policy table — verify with the county assessor before closing.
Climate risk First Street
- Flood 1/10 Low FEMA zone X (unshaded) · 0% chance over 30 yrs
- Wildfire 3/10 Moderate
- Heat 9/10 Extreme 5 d/yr ≥107°F today · 20 d/yr by 30 yrs out
- Wind 10/10 Extreme 99% chance of damaging wind over 30 yrs
- Air quality 2/10 Low 2 unhealthy d/yr today · 2 by 30 yrs out
Nearby sold comps map
Loading sold comps map…
Walkable amenities ~0.75 mi
Loading nearby amenities…
Taxation est. · year 1
- Rental income
- $32,337
- − Mortgage interest
- −$14,004
- − Property taxes
- −$716
- − Insurance
- −$1,250
- − Repairs & maintenance
- −$2,587
- − Management
- −$2,587
- − HOA
- −$6,204
- − Depreciation
- −$7,273
- Taxable loss
- −$2,284
- Est. tax savings @ 24.0%
- +$548
- After-tax cash flow
- $2,192/yr
For passive investors: Depreciation is non-cash, so a rental often shows a tax loss while cash-flowing — sheltering income. Rental losses are passive: they offset passive income freely, and up to $25,000/yr can offset ordinary (W-2) income if you actively participate and your MAGI is under $100k (phasing out to $0 by $150k); unused losses carry forward. On sale, claimed depreciation is recaptured at up to 25%, and gains may owe capital-gains tax (a 1031 exchange can defer both). Figures are a year-1 estimate at your 24.0% rate — not tax advice; consult a CPA.
Schools (NCES district)
- District
- Collier
- NCES district ID
- 1200330
- Math proficiency
- 60% ▼ -4.00%
- Reading proficiency
- 56% ▼ -2.00%
- Median HH income
- $58,275
- Composite
- 50.23/100
- National rank
- #1892
- State rank
- #16 of 73 in FL
Livability — Naples
- Score
- 80/100
- State rank
- #126
- US rank
- #1903
Category grades
Schools grade is shown separately in the Schools card above.
Census & demographics
- County
- Collier County · 396,295 people
- Metro
- Naples-Marco Island, FL
- Population (ZIP)
- 26,408
- Household income
- $71,686
- Rent vs Own
- Severe rent burden
- 1423.0
Population outlook (Collier County) Hauer SSP2
- Today (2025)
- 420,858 people
- By 2030
- 450,054 · +6.9%
- By 2040
- 502,232 · +19.3%
- By 2050
- 544,932 · +29.5%
- By 2075
- 627,203 · +49.0%
- By 2100
- 659,015 · +56.6%
Race, ethnicity, and origin ACS 2023
- Neighborhood character
- Majority White (62%)
- Race & ethnicity
- White 62% Hispanic / Latino 30% Two or more races 19% Black 4% Asian 2%
- Hispanic origin (detail)
- Mexican 7% Puerto Rican 3% Cuban 6% Dominican 1%
- Common ancestry
- Lithuanian 6% Romanian 3% Hispanic 2%
- Foreign-born
- 30% · Canada, Jamaica, Dominican Republic
- Languages at home
- 66% English-only · Spanish 24% French/Haitian/Cajun 5% Russian/Polish/Slavic 1%
Political lean MEDSL · Collier
- 2024 margin
- Solid R (+33.1) · D 33.1% · R 66.2%
- 2008→2024 swing
- -10.6pp toward R · 2008: -22.5pp · 2024: -33.1pp
- All cycles
- 2024: R+33.1 2020: R+24.7 2016: R+26.0 2012: R+30.1 2008: R+22.5
Not yet ingested
- Civics
- —
Market trends
- HPI YoY
- ▼ -252.48%
- Current HPI
- 259.3498
- Rent YoY
- ▼ -1.10%
- Metro
- Naples-Marco Island, FL
- State GDP YoY
- ▲ 3.28%
- F500 in state
- 36
Industry mix (Fortune 500 HQ in FL)
| Industry | F500 HQs | Revenue |
|---|---|---|
| Industrial Technology | 2 | $29B |
|
||
| Insurance | 2 | $17B |
|
||
| Retail | 1 | $60B |
|
||
| Technology Distribution | 1 | $58B |
|
||
| Homebuilding | 1 | $35B |
|
||
| Technology Manufacturing | 1 | $35B |
|
||
Price history
+191.4% since first listed3 events — show timeline
- 2026-06-17 Listed $249,999 NAPLESMLS
- 2003-09-05 Sold (Public Records) $134,000 Public Records
- 1997-08-01 Sold (Public Records) $85,800 Public Records
Property tax history
+1.9%/yrLatest (2025): $716 · +7.5% YoY. Source: county tax records.
Cash-flow waterfall
monthlySold comps — $/sqft
last 12 mo · ≤1 miLoading sold comps…