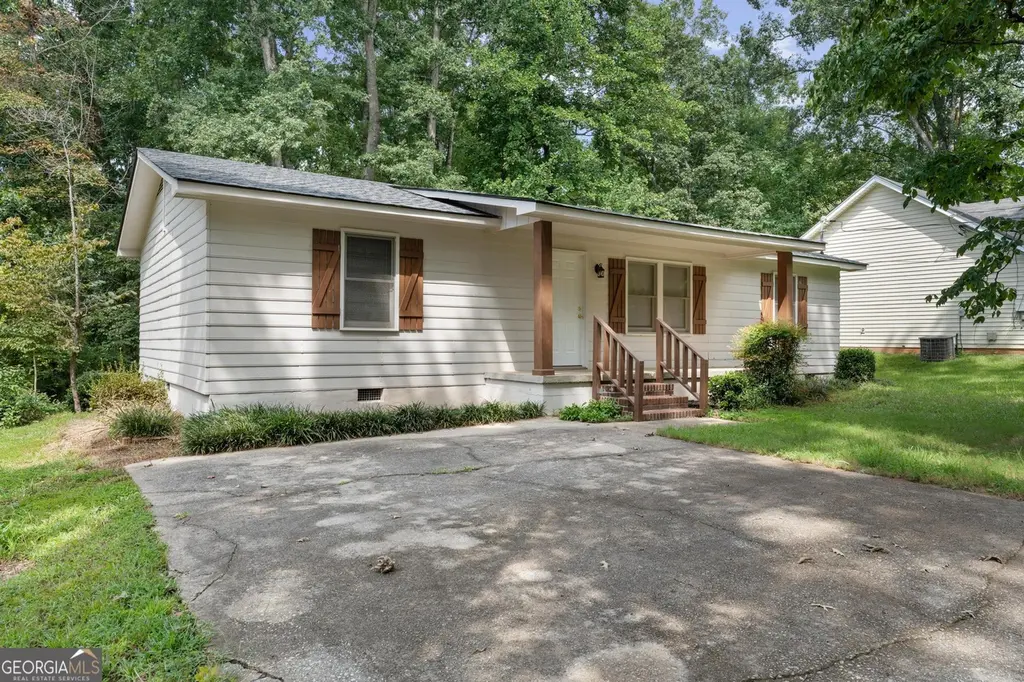
214 Ashland Dr · Stockbridge, GA
Flood risk 1/10 · Minimal
- FEMA flood zone
- X (unshaded)
- Chance of flooding over 30 yrs
- 0.0%
- Est. flood insurance / yr
- $507 – $1,088
Fire risk 3/10 · Minor
- Est. fire insurance / yr
- $963 – $1,789
Heat risk 5/10 · Moderate
- Hot days now (above 106°F)
- 7 days/yr
- Hot days in 30 yrs
- 18 days/yr
Wind risk 5/10 · Moderate
- Chance of severe wind over 30 yrs
- 26.0%
Air-quality risk 4/10 · Minor
- Unhealthy air days now
- 5 days/yr
- Unhealthy air days in 30 yrs
- 7 days/yr
Risk factors via First Street. Map © Google.
Why this score? — see what drove the D grade
The composite is a weighted blend of 9 inputs, each scored 0–100. Each bar is that input's sub-score; the figure is the points it added to the 100-point composite (weight × sub-score).
- Cash flow +12.7/30.0
- ARV discount +11.5/15.0
- DSCR +3.8/10.0
- 1% rule +3.5/10.0
- Livability +3.0/5.0
- Rent growth +2.7/5.0
- Schools +2.6/10.0
- Condition / age +2.5/5.0
- Appreciation +0.0/10.0
$210,000
🖨 Deal sheet (PDF) 📄 Offer letter ✓ Due diligence
Listing remarks
PRICE ADJUSTMENT ON THIS MOVE-IN READY RANCH HOME! 100% Financing Programs Available! You will love the covered front porch that leads to the OPEN floor plan w/ Large Great Room & Dining Room, spacious kitchen w/ breakfast bar! Split Bedroom design w/ spacious bedrooms; the Owner's Suite has a private bath & lots of closet space! Nice secondary bedrooms & hall bath! New carpet & LVP flooring throughout the home plus fresh paint! The large laundry room leads out to a great deck for grilling and overlooking the private backyard & storage building! Total Electric & move-in ready! * * Call for financing details & payments less than rent * *
Key facts
- Covered front porch
- Open floor plan
- Split bedroom design
Tags
Neighborhood map
What this means for you Summary
Snapshot
- This is a 3-bed/2.0-bath single-family listed at $210k.
Deal economics
- At list price, monthly cash flow is $-23 ($-275/yr) — negative.
- To cash-flow at today's rent, offer at most $206k (1.9% below list).
- To meet the 1% rule (rent ≥ 1% of price), the offer needs to be $177k (15.5% below list).
- Recommended offer: $177k (15.5% below list) — sets the bar for 1% rule.
- Cap rate 6.2% vs local median 4.2% in Stockbridge — top-decile yield for the area; either an underpriced asset or a hidden risk that comps aren't pricing in. Stress-test before assuming the spread holds.
Location & tenants
- Location reads 60/100 on livability (#389 in GA) — a middle-class / working-renter tenant base. Strengths: housing A+, cost of living A; Watch: crime D, amenities F, commute F.
- Henry County (rural): math 24% / reading 33% proficiency, ranked #89 of 174 in GA (top 51%) — low school quality limits family demand, transient renter base, plan for 1-2y turnover.
- Zoned schools: Woodland Elementary School (math 21% / reading 22%, grade F, #845 of 1,228 statewide, top 69%, 619 students, 56% FRL); Woodland Middle School (math 20% / reading 30%, grade F, #291 of 470 statewide, top 64%, 705 students, 53% FRL); Woodland High School (math 15% / reading 24%, grade F, #238 of 424 statewide, top 57%, 1,334 students, 42% FRL).
- Market conditions: Rents flat; 611 active listings in the ZIP; 7 comparable units currently listed for rent nearby; rentals at typical pace (median 24d on market — plan ~3-4 weeks tenant-placement turnaround); 43% of comp listings sitting > 30 days — soft ceiling on asking rent; 1,989 units permitted in Henry County in 2024 (92 in 5+ unit buildings).
Forward outlook
- Local home prices are declining (-3.0%/yr); year-one equity from $1k of loan paydown is wiped out by about $6k of value loss. Plan a longer hold.
- Henry County population projected at +29% by 2050 — long-run rental-demand tailwind backs the buy-and-hold thesis.
Negotiation context
- It's been on market 137 days — a 12% lower offer ($185k) is reasonable based on typical stale-listing flexibility.
- 4 sale attempts since 2y ago with the ask held roughly flat each time — persistent listings suggest the price (not the market) is what's stuck; bring a comps-based counter.
Risks & watch-outs
- Climate carrying-cost: moderate wind risk, 26% chance of damaging wind over 30y; extreme-heat days projected 7→18/yr by 2055 (HVAC capex compounding) — expect insurance premiums to compound above CPI over the hold.
Questions for the listing agent
- What do current leases actually rent for vs. the listed asking? Can we see a recent rent roll and the last 12 months of T-12 income?
- It's been on market 137 days. Have you received any prior offers? Is the seller open to a 15% concession, seller financing, or rate buy-down credit?
- Why hasn't it sold? Are there any deal-killer items the seller is aware of (foundation, flood, title, zoning, code violations)?
- Is there a deadline driving the sale (1031 exchange, divorce, estate, relocation)? That informs how much negotiation room exists.
- Schools are D-rated, which usually means shorter tenancies and higher turnover. Who's the typical renter profile here, and what's been the actual vacancy rate?
- Crime grade is D in this area — have there been break-ins, vandalism, or insurance claims at this property in the last 3 years? What carrier currently insures it and at what premium?
- The area grade is low — what's the realistic commute time and amenity access for the typical tenant pool here? Any planned neighborhood developments (good or bad) we should know about?
- What's the average days-on-market for RENTAL listings here right now (not sales)? A rising rental-DOM trend means longer vacancies and softer asking-rent achievability than the comps imply.
- What's the recent tenant-quality profile in this submarket — average credit score on applications, eviction rate, late-payment / NSF rate, and stable-employment percentage? A property-management company in the area should have these aggregated.
- How much new for-sale + rental construction is in the pipeline within 1–3 miles? Heavy new supply typically softens prices + rents 12–24 months out; constrained supply supports both.
Investment metrics
- 1% rule
- 0.85% ✗
- Cap rate
- 6.16%
- Cash-on-cash
- -0.47%
- DSCR
- 0.98
- GRM
- 9.9
CMA / ARV
- ARV (median comp)
- $230,447
- List price
- $210,000
- Delta
- -8.87%
- Verdict
- FAIR
- Comps
- 20 within 1.0 mi
Show comp detail 8 sales within ~0.75 mi
| Address | Dist | Beds/Ba | Sqft | Sold | Price | $/sf | Match |
|---|---|---|---|---|---|---|---|
| 241 Hillcrest Dr | 0.14mi | 3/2.0 | 1,280 (+11%) | 13mo | $210,000 | $164 | 64 |
| 115 Lakeview Dr | 0.36mi | 3/2.0 | 1,299 (+13%) | 2mo | $155,000 | $119 | 60 |
| 385 Lakeshore Dr | 0.69mi | 3/2.0 | 1,172 (+2%) | 13mo | $208,550 | $178 | 54 |
| 214 Pinewood Ln | 0.27mi | 4/1.0 (+1) | 1,236 (+7%) | 15mo | $94,900 | $77 | 54 |
| 135 Lakeview Dr | 0.29mi | 3/2.0 | 1,248 (+8%) | 24mo | $232,000 | $186 | 52 |
| 135 Greenwood Dr | 0.35mi | 3/2.0 | 1,264 (+10%) | 19mo | $240,000 | $190 | 52 |
| 623 Swan Lake Rd | 0.54mi | 3/2.0 | 1,313 (+14%) | 15mo | $272,500 | $208 | 39 |
| 312 Cedar Ln | 0.66mi | 3/2.0 | 1,228 (+7%) | 24mo | $191,000 | $156 | 39 |
Match score weights: distance 35% · size 25% · config 20% · recency 20%. Top-matched comps best support the ARV.
Projected returns pro-forma
-3.0% appreciation · 0.87% rent growth · sell at horizon
- IRR
- -19.4%
- Equity multiple
- 0.33×
- Total profit
- $-39,201
- Equity at exit
- $31,312
- IRR
- -17.3%
- Equity multiple
- 0.14×
- Total profit
- $-50,614
- Equity at exit
- $18,157
Cash invested: $58,800 (down + closing). Projections, not guarantees.
Landlord ↔ Tenant lean methodology
- Overall (STATE)
- 90 Strongly Landlord-Friendly
- State Georgia
- 90 Strongly Landlord-Friendly · R+3
- County
- — inherits STATE
- City
- — inherits STATE
ZIP-level market 30281
- Home prices YoY
- -33.6%
- Rents YoY
- 0.9%
- Active inventory
- 611
- Price-to-rent
- 9.9×
Monthly cashflow live
- Estimated rent
- $1,775 high interval (Pro) →
- Mortgage (P&I)
- −$1,101
- Tax from tax record
- −$236 /mo · $2,832/yr
- Insurance
- −$88
- HOA
- −$0
- Vacancy / Maint / Mgmt
- −$373
- Net cashflow
- $-23
Break-even live
Sensitivity live
| Price | -10% $96 | -5% $37 | +0% $-23 | +5% $-82 | +10% $-142 |
|---|---|---|---|---|---|
| Rent | -10% $-163 | -5% $-93 | +0% $-23 | +5% $47 | +10% $117 |
| Rate | -1.0pp $83 | -0.5pp $31 | base $-23 | +0.5pp $-77 | +1.0pp $-133 |
UW: 25.0% down · 7.5% · 30yr · 1.5% tax · 5.0% vac · 8.0% maint · 8.0% mgmt
Financing live
Cash to close
- Down payment
- $52,500
- Closing costs
- $6,300
- Reserves months
- —
- Total cash needed
- —
Loan-product check · same deal, 3 products live
Conventional
25% down · 7.5% · 30yr
- Down + closing
- —
- Monthly P&I
- —
- Monthly cashflow
- —
- DSCR
- —
- Eligible?
- —
Personal DTI + credit; lowest rate.
DSCR
20% down · 8.5% · 30yr
- Down + closing
- —
- Monthly P&I
- —
- Monthly cashflow
- —
- DSCR
- —
- Eligible?
- —
No personal income docs; deal must DSCR.
Hard money
10% down · 12.0% · 12mo
- Down + closing
- —
- Monthly P&I
- —
- Monthly cashflow
- —
- DSCR
- —
- Eligible?
- —
Short-term bridge; refi at stabilization.
Rent comps 7 comps
| Address | Beds | Baths | Sqft | Rent | $/sqft | DOM | Units | Dist |
|---|---|---|---|---|---|---|---|---|
| 135 Wildwood Dr Stockbridge, GA | 3.0 | 1.0 | 1012 | $1,460 | $1.44 | 45d | 1 | 0.25mi |
| 25 Berryman Ln Stockbridge, GA | 3.0 | 2.0 | 1200 | $1,640 | $1.37 | 14d | 1 | 0.29mi |
| 285 Lakeshore Dr Stockbridge, GA | 3.0 | 2.0 | 1411 | $1,895 | $1.34 | 24d | 1 | 0.51mi |
| 70 Summerfield Ct Stockbridge, GA | 3.0 | 2.0 | 1444 | $1,795 | $1.24 | 45d | 1 | 0.88mi |
| 422 Hawthorne Cir Stockbridge, GA | 4.0 | 1.5 | 1488 | $1,756 | $1.18 | 14d | 1 | 1.07mi |
| 479 Lakeshore Dr Stockbridge, GA | 3.0 | 2.0 | 1281 | $1,750 | $1.37 | 7d | 1 | 1.19mi |
| 1069 Estates Ct Stockbridge, GA | 3.0 | 2.0 | 1476 | $1,746 | $1.18 | 45d | 1 | 1.43mi |
Listing history 24 events
-
2026-06-21days on market $210,000 Active 137 DOM
-
2026-06-18days on market $210,000 Active 134 DOM
-
2026-06-17days on market $210,000 Active 133 DOM
-
2026-06-16days on market $210,000 Active 132 DOM
-
2026-06-15days on market $210,000 Active 131 DOM
-
2026-06-13statusdays on market $210,000 Active 129 DOM
-
2026-06-10remarks 661-char remark
-
2026-06-10pricestatus $210,000 Price Change 125 DOM
-
2026-06-09days on market $215,000 Active 125 DOM
-
2026-06-08days on market $215,000 Active 124 DOM
-
2026-06-07days on market $215,000 Active 123 DOM
-
2026-06-04days on market $215,000 Active 120 DOM
-
2026-06-03days on market $215,000 Active 119 DOM
-
2026-06-02days on market $215,000 Active 118 DOM
-
2026-06-01days on market $215,000 Active 117 DOM
-
2026-05-31days on market $215,000 Active 116 DOM
-
2026-04-30historical
-
2026-02-23$215,000 Active
-
2026-02-03historical
-
2026-01-30$215,000 New
-
2025-08-11$215,000 New
-
2025-05-05historical $1,600
-
2024-11-26$1,600
-
2023-06-30historical
ⓘ Source: listings_history table (triggers on properties + properties_extension) + one-shot
backfill from property_details.listing_events for pre-trigger history.
Tax reassessment forecast GA · Resets to sale price
- Current annual tax
- $2,832 · $236/mo
- Projected year-2 tax
- $2,832 · $236/mo
- Expected delta
- $0/yr ($0/mo · 0.0%)
ⓘ Screening estimate from a state-policy table — verify with the county assessor before closing.
Climate risk First Street
- Flood 1/10 Low FEMA zone X (unshaded) · 0% chance over 30 yrs
- Wildfire 3/10 Moderate
- Heat 5/10 Major 7 d/yr ≥106°F today · 18 d/yr by 30 yrs out
- Wind 5/10 Major 26% chance of damaging wind over 30 yrs
- Air quality 4/10 Moderate 5 unhealthy d/yr today · 7 by 30 yrs out
Nearby sold comps map
Loading sold comps map…
Walkable amenities ~0.75 mi
Loading nearby amenities…
Taxation est. · year 1
- Rental income
- $21,295
- − Mortgage interest
- −$11,763
- − Property taxes
- −$2,832
- − Insurance
- −$1,050
- − Repairs & maintenance
- −$1,704
- − Management
- −$1,704
- − Depreciation
- −$6,109
- Taxable loss
- −$3,867
- Est. tax savings @ 24.0%
- +$928
- After-tax cash flow
- $653/yr
For passive investors: Depreciation is non-cash, so a rental often shows a tax loss while cash-flowing — sheltering income. Rental losses are passive: they offset passive income freely, and up to $25,000/yr can offset ordinary (W-2) income if you actively participate and your MAGI is under $100k (phasing out to $0 by $150k); unused losses carry forward. On sale, claimed depreciation is recaptured at up to 25%, and gains may owe capital-gains tax (a 1031 exchange can defer both). Figures are a year-1 estimate at your 24.0% rate — not tax advice; consult a CPA.
Schools (NCES district)
- District
- Henry County
- NCES district ID
- 1302820
- Math proficiency
- 24% ▼ -9.00%
- Reading proficiency
- 33% ▼ -7.00%
- Median HH income
- $62,594
- Composite
- 26.13/100
- National rank
- #7279
- State rank
- #89 of 174 in GA
Livability — Stockbridge
- Score
- 60/100
- State rank
- #389
- US rank
- #19479
Category grades
Schools grade is shown separately in the Schools card above.
Census & demographics
- County
- Henry County · 316,359 people
- City population
- 71,603
- Metro
- Atlanta-Sandy Springs-Alpharetta, GA
- Population (ZIP)
- 71,603
- Household income
- $71,213
- Rent vs Own
- Severe rent burden
- 2464.0
Population outlook (Henry County) Hauer SSP2
- Today (2025)
- 249,041 people
- By 2030
- 264,369 · +6.2%
- By 2040
- 294,459 · +18.2%
- By 2050
- 322,249 · +29.4%
- By 2075
- 392,310 · +57.5%
- By 2100
- 437,836 · +75.8%
Race, ethnicity, and origin ACS 2023
- Neighborhood character
- Diverse neighborhood (Simpson 0.61)
- Race & ethnicity
- Black 55% White 28% Hispanic / Latino 11% Two or more races 6% Asian 4%
- Hispanic origin (detail)
- Mexican 7%
- Common ancestry
- Hispanic 1% Italian 1% Romanian 1%
- Foreign-born
- 9% · Canada, Vietnam
- Languages at home
- 86% English-only · Spanish 8% Vietnamese 2% French/Haitian/Cajun 1%
Political lean MEDSL · Henry
- 2024 margin
- Strong D (+29.7) · D 64.5% · R 34.9%
- 2008→2024 swing
- +37.1pp toward D · 2008: -7.5pp · 2024: 29.7pp
- All cycles
- 2024: D+29.7 2020: D+20.5 2016: D+4.3 2012: R+3.2 2008: R+7.5
Not yet ingested
- Civics
- —
Market trends
- HPI YoY
- ▼ -104.76%
- Current HPI
- 207.2332
- Rent YoY
- ▲ 0.87%
- Metro
- Atlanta-Sandy Springs-Alpharetta, GA
- State GDP YoY
- ▲ 2.66%
- F500 in state
- 28
Industry mix (Fortune 500 HQ in GA)
| Industry | F500 HQs | Revenue |
|---|---|---|
| Paper / Packaging | 2 | $29B |
|
||
| Retail | 1 | $160B |
|
||
| Transportation / Logistics | 1 | $91B |
|
||
| Airlines | 1 | $62B |
|
||
| Consumer Goods | 1 | $47B |
|
||
| Utilities | 1 | $25B |
|
||
Price history
+13337.5% since first listed8 events — show timeline
- 2026-04-30 Listing Removed — FMLS
- 2026-02-23 Listed $215,000 FMLS
- 2026-02-03 Listing Removed — GAMLS
- 2026-01-30 Listed $215,000 GAMLS
- 2025-08-11 Listed $215,000 GAMLS
- 2025-05-05 Rental Removed $1,600 GAMLS
- 2024-11-26 Listed for Rent $1,600 GAMLS
- 2023-06-30 Rental Removed — GAMLS
Property tax history
+4.4%/yrLatest (2025): $2,832 · -3.1% YoY. Source: county tax records.
Cash-flow waterfall
monthlySold comps — $/sqft
last 12 mo · ≤1 miLoading sold comps…