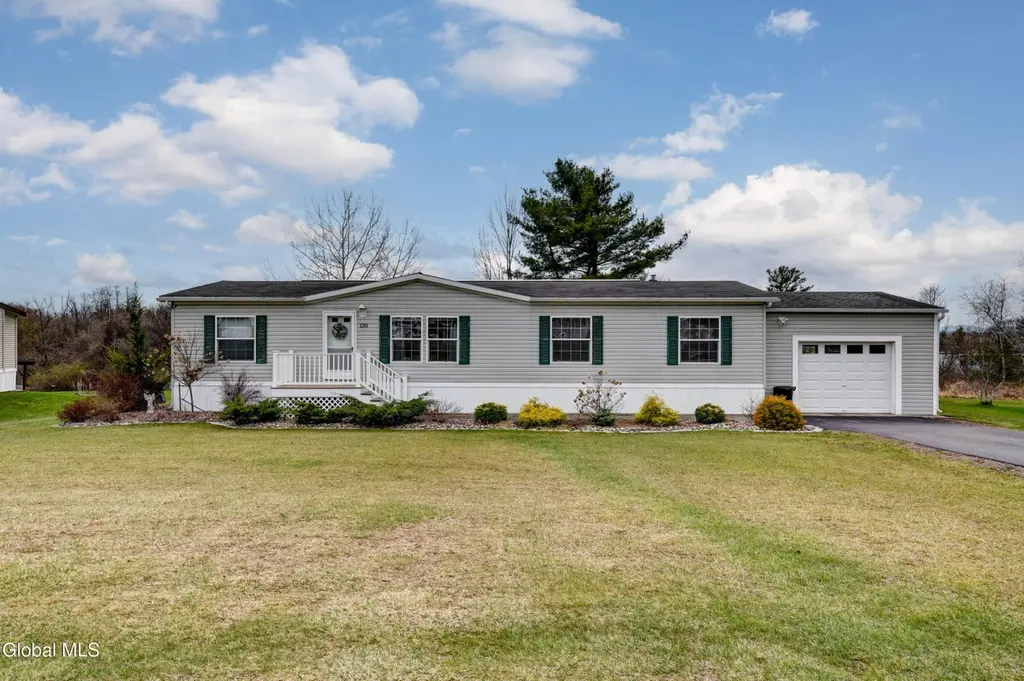
130 Trailer St · Palatine Bridge, NY
Flood risk 1/10 · Minimal
- FEMA flood zone
- X (unshaded)
- Chance of flooding over 30 yrs
- 0.0%
- Est. flood insurance / yr
- $473 – $860
Fire risk 3/10 · Minor
- Est. fire insurance / yr
- $691 – $1,283
Heat risk 2/10 · Minimal
- Hot days now (above 96°F)
- 7 days/yr
- Hot days in 30 yrs
- 16 days/yr
Wind risk 2/10 · Minimal
- Chance of severe wind over 30 yrs
- 3.0%
Air-quality risk 1/10 · Minimal
- Unhealthy air days now
- 0 days/yr
- Unhealthy air days in 30 yrs
- 0 days/yr
Risk factors via First Street. Map © Google.
Why this score? — see what drove the D grade
The composite is a weighted blend of 9 inputs, each scored 0–100. Each bar is that input's sub-score; the figure is the points it added to the 100-point composite (weight × sub-score).
- Appreciation +8.8/10.0
- ARV discount +7.5/15.0
- Cash flow +7.3/30.0
- Schools +4.1/10.0
- Livability +3.3/5.0
- 1% rule +3.2/10.0
- Rent growth +2.5/5.0
- Condition / age +2.5/5.0
- DSCR +1.4/10.0
$149,900
🖨 Deal sheet (PDF) 📄 Offer letter ✓ Due diligence
Listing remarks MLS
A lovely double wide home with open dining area and living room. 2 full baths. Sliding glass doors. Large eat-in kitchen. Proof of funds w/ all offers. Very Good Condition
Key facts
- 0.38 acre lot
- Garage
- Built 2003
Property features AI
Exterior
- Parking: Attached garage (1-car); Paved parking with a total of 4 parking spaces; Additional garage structure
- Utilities: Public water; Public sewer; Cable available
- Home design: Single-family residence; Entry level: First floor
- Construction: Vinyl siding; Asphalt roof; Slab foundation; Built area approximately 1,680 (living area)
- Exterior features: Deck; Landscaped lot; Property on a cul-de-sac; Level lot
Interior
- Kitchen: Dishwasher; Gas oven; Range; Refrigerator
- Bedrooms: Three bedrooms on the first floor
- Bathrooms: Two full bathrooms on the first floor
- Heating & cooling: Forced air heating; AC pump cooling
- Interior features: Double-pane, ENERGY STAR qualified windows; 8 total rooms
- Laundry & utility: Washer and dryer; Laundry located on the main level
Neighborhood map
What this means for you Summary
Snapshot
- This is a 3-bed/2.0-bath manufactured listed at $150k.
Deal economics
- At list price, monthly cash flow is $-202 ($-2k/yr) — negative.
- To cash-flow at today's rent, offer at most $114k (23.8% below list).
- To meet the 1% rule (rent ≥ 1% of price), the offer needs to be $124k (17.5% below list).
- Recommended offer: $114k (23.8% below list) — sets the bar for cash-flow.
Location & tenants
- Location reads 66/100 on livability (#663 in NY) — a middle-class / working-renter tenant base. Strengths: cost of living A+, housing A+, health & safety A+; Watch: employment C-, crime F, amenities F.
- Canajoharie Central School District (town): math 38% / reading 59% proficiency, ranked #414 of 590 in NY (top 70%) — families likely to look elsewhere, expect single-tenant / working-renter base with shorter leases.
- Zoned schools: East Hill School (math 37% / reading 47%, grade F, #1,361 of 2,108 statewide, top 67%, 386 students, 45% FRL); Canajoharie Middle School (math 17% / reading 57%, grade F, #448 of 729 statewide, top 63%, 195 students, 47% FRL); Canajoharie Senior High School (math 87% / reading 84%, grade A, #358 of 1,100 statewide, top 33%, 263 students, 39% FRL).
- Market conditions: 11 active listings in the ZIP; 210 units permitted in Montgomery County in 2024 (168 in 5+ unit buildings).
Forward outlook
- In year one you build about $12k of equity ($1k loan paydown + $11k appreciation (7.6% local appreciation)).
- Montgomery County population projected at -11% by 2050 — secular population decline; favor cash flow + early exit over multi-decade hold.
- By year 3, paydown + projected appreciation supports a ~$31k cash-out refi (75% LTV) — recoverable capital for the next deal without selling this one.
Negotiation context
- Only 12 days on market — expect competitive offers; lowballing is unlikely to land.
- 3 sale attempts since 18y ago with the ask held roughly flat each time — persistent listings suggest the price (not the market) is what's stuck; bring a comps-based counter.
- Current owner paid $55k; list at $150k implies a 173% gain — meaningful room to come down on a strong offer.
Risks & watch-outs
- Watch-outs: property tax is 2.6% of price.
Questions for the listing agent
- What do current leases actually rent for vs. the listed asking? Can we see a recent rent roll and the last 12 months of T-12 income?
- Property tax is high relative to price — has the assessment been appealed recently, and will the sale trigger a re-assessment?
- Is there a deadline driving the sale (1031 exchange, divorce, estate, relocation)? That informs how much negotiation room exists.
- Schools are F-rated, which usually means shorter tenancies and higher turnover. Who's the typical renter profile here, and what's been the actual vacancy rate?
- Crime grade is F in this area — have there been break-ins, vandalism, or insurance claims at this property in the last 3 years? What carrier currently insures it and at what premium?
- The area grade is low — what's the realistic commute time and amenity access for the typical tenant pool here? Any planned neighborhood developments (good or bad) we should know about?
- What's the average days-on-market for RENTAL listings here right now (not sales)? A rising rental-DOM trend means longer vacancies and softer asking-rent achievability than the comps imply.
- What's the recent tenant-quality profile in this submarket — average credit score on applications, eviction rate, late-payment / NSF rate, and stable-employment percentage? A property-management company in the area should have these aggregated.
- How much new for-sale + rental construction is in the pipeline within 1–3 miles? Heavy new supply typically softens prices + rents 12–24 months out; constrained supply supports both.
Investment metrics
- 1% rule
- 0.82% ✗
- Cap rate
- 4.68%
- Cash-on-cash
- -5.76%
- DSCR
- 0.74
- GRM
- 10.1
CMA / ARV
No comps found within radius.
Projected returns pro-forma
7.6% appreciation · 3.0% rent growth · sell at horizon
- IRR
- 14.7%
- Equity multiple
- 2.08×
- Total profit
- $45,210
- Equity at exit
- $109,835
- IRR
- 14.6%
- Equity multiple
- 4.36×
- Total profit
- $140,887
- Equity at exit
- $214,270
Cash invested: $41,972 (down + closing). Projections, not guarantees.
Landlord ↔ Tenant lean methodology
- Overall (STATE)
- 15 Strongly Tenant-Friendly
- State New York
- 15 Strongly Tenant-Friendly · D+10
- County
- — inherits STATE
- City
- — inherits STATE
ZIP-level market 13428
- Home prices YoY
- 2.1%
- Active inventory
- 11
- Price-to-rent
- 10.1×
Monthly cashflow live
- Estimated rent
- $1,237 medium interval (Pro) →
- Mortgage (P&I)
- −$786
- Tax from tax record
- −$330 /mo · $3,959/yr
- Insurance
- −$62
- HOA
- −$0
- Vacancy / Maint / Mgmt
- −$260
- Net cashflow
- $-202
Break-even live
Sensitivity live
| Price | -10% $-117 | -5% $-159 | +0% $-202 | +5% $-244 | +10% $-286 |
|---|---|---|---|---|---|
| Rent | -10% $-299 | -5% $-250 | +0% $-202 | +5% $-153 | +10% $-104 |
| Rate | -1.0pp $-126 | -0.5pp $-163 | base $-202 | +0.5pp $-240 | +1.0pp $-280 |
UW: 25.0% down · 7.5% · 30yr · 1.5% tax · 5.0% vac · 8.0% maint · 8.0% mgmt
Financing live
Cash to close
- Down payment
- $37,475
- Closing costs
- $4,497
- Reserves months
- —
- Total cash needed
- —
Loan-product check · same deal, 3 products live
Conventional
25% down · 7.5% · 30yr
- Down + closing
- —
- Monthly P&I
- —
- Monthly cashflow
- —
- DSCR
- —
- Eligible?
- —
Personal DTI + credit; lowest rate.
DSCR
20% down · 8.5% · 30yr
- Down + closing
- —
- Monthly P&I
- —
- Monthly cashflow
- —
- DSCR
- —
- Eligible?
- —
No personal income docs; deal must DSCR.
Hard money
10% down · 12.0% · 12mo
- Down + closing
- —
- Monthly P&I
- —
- Monthly cashflow
- —
- DSCR
- —
- Eligible?
- —
Short-term bridge; refi at stabilization.
Listing history 8 events
-
2026-04-30status Pending
-
2026-04-15$149,900 Active
-
2010-10-18soldstatus $55,000 175-char remark
Show marketing remark (175 chars)
A lovely double wide home with open dining area and living room. 2 full baths. Sliding glass doors. Large eat-in kitchen. Proof of funds w/ all offers. Very Good Condition
-
2010-09-06historical 175-char remark
Show marketing remark (175 chars)
A lovely double wide home with open dining area and living room. 2 full baths. Sliding glass doors. Large eat-in kitchen. Proof of funds w/ all offers. Very Good Condition
-
2009-08-24$59,900 175-char remark
Show marketing remark (175 chars)
A lovely double wide home with open dining area and living room. 2 full baths. Sliding glass doors. Large eat-in kitchen. Proof of funds w/ all offers. Very Good Condition
-
2009-01-26historical
-
2008-08-01$95,000
-
2003-03-05soldstatus $20,500
ⓘ Source: listings_history table (triggers on properties + properties_extension) + one-shot
backfill from property_details.listing_events for pre-trigger history.
Tax reassessment forecast NY · Partial reset (capped growth)
- Current annual tax
- $3,959 · $330/mo
- Projected year-2 tax
- $3,959 · $330/mo
- Expected delta
- $0/yr ($0/mo · 0.0%)
ⓘ Screening estimate from a state-policy table — verify with the county assessor before closing.
Climate risk First Street
- Flood 1/10 Low FEMA zone X (unshaded) · 0% chance over 30 yrs
- Wildfire 3/10 Moderate
- Heat 2/10 Low 7 d/yr ≥96°F today · 16 d/yr by 30 yrs out
- Wind 2/10 Low 3% chance of damaging wind over 30 yrs
- Air quality 1/10 Low 0 unhealthy d/yr today · 0 by 30 yrs out
Nearby sold comps map
Loading sold comps map…
Walkable amenities ~0.75 mi
Loading nearby amenities…
Taxation est. · year 1
- Rental income
- $14,838
- − Mortgage interest
- −$8,397
- − Property taxes
- −$3,959
- − Insurance
- −$750
- − Repairs & maintenance
- −$1,187
- − Management
- −$1,187
- − Depreciation
- −$4,361
- Taxable loss
- −$5,002
- Est. tax savings @ 24.0%
- +$1,200
- After-tax cash flow
- $-1,219/yr
For passive investors: Depreciation is non-cash, so a rental often shows a tax loss while cash-flowing — sheltering income. Rental losses are passive: they offset passive income freely, and up to $25,000/yr can offset ordinary (W-2) income if you actively participate and your MAGI is under $100k (phasing out to $0 by $150k); unused losses carry forward. On sale, claimed depreciation is recaptured at up to 25%, and gains may owe capital-gains tax (a 1031 exchange can defer both). Figures are a year-1 estimate at your 24.0% rate — not tax advice; consult a CPA.
Schools (NCES district)
- District
- Canajoharie Central School District
- NCES district ID
- 3606300
- Math proficiency
- 38% ▼ -12.00%
- Reading proficiency
- 59% ▲ 10.00%
- Median HH income
- $49,296
- Composite
- 41.39/100
- National rank
- #3482
- State rank
- #414 of 590 in NY
Livability — Palatine Bridge
- Score
- 66/100
- State rank
- #663
- US rank
- #12360
Category grades
Schools grade is shown separately in the Schools card above.
Census & demographics
- Census place
- Palatine Bridge, NY
- Population (ZIP)
- 1,470
Population outlook (Montgomery County) Hauer SSP2
- Today (2025)
- 48,683 people
- By 2030
- 47,785 · -1.8%
- By 2040
- 45,492 · -6.6%
- By 2050
- 43,161 · -11.3%
- By 2075
- 38,134 · -21.7%
- By 2100
- 32,337 · -33.6%
Race, ethnicity, and origin ACS 2023
- Neighborhood character
- Predominantly White (96%)
- Race & ethnicity
- White 96% Two or more races 2%
- Common ancestry
- Iranian 3% Slovak 2% Lithuanian 1%
- Foreign-born
- 1% · Canada
Political lean MEDSL · Montgomery
- 2024 margin
- Strong R (+28.7) · D 35.6% · R 64.4%
- 2008→2024 swing
- -20.6pp toward R · 2008: -8.1pp · 2024: -28.7pp
- All cycles
- 2024: R+28.7 2020: R+22.6 2016: R+26.5 2012: R+4.4 2008: R+8.1
Not yet ingested
- Civics
- —
Market trends
- HPI YoY
- ▲ 7.60%
- Current HPI
- 364.8609
- Rent YoY
- —
- Metro
- —
- State GDP YoY
- ▲ 2.60%
- F500 in state
- 92
Industry mix (Fortune 500 HQ in NY)
| Industry | F500 HQs | Revenue |
|---|---|---|
| Financial Services | 10 | $950B |
|
||
| Consumer Goods | 9 | $162B |
|
||
| Insurance | 4 | $225B |
|
||
| Telecommunications | 2 | $144B |
|
||
| Pharmaceuticals | 2 | $112B |
|
||
| Media / Entertainment | 2 | $69B |
|
||
Price history
+631.2% since first listed8 events — show timeline
- 2026-04-30 Pending — Global MLS
- 2026-04-15 Listed $149,900 Global MLS
- 2010-10-18 Sold (MLS) $55,000 Global MLS
- 2010-09-06 Listing Removed — Global MLS
- 2009-08-24 Listed $59,900 Global MLS
- 2009-01-26 Listing Removed — Global MLS
- 2008-08-01 Listed $95,000 Global MLS
- 2003-03-05 Sold (Public Records) $20,500 Public Records
Property tax history
+6.0%/yrLatest (2025): $3,959 · +13.9% YoY. Source: county tax records.
Cash-flow waterfall
monthlySold comps — $/sqft
last 12 mo · ≤1 miLoading sold comps…