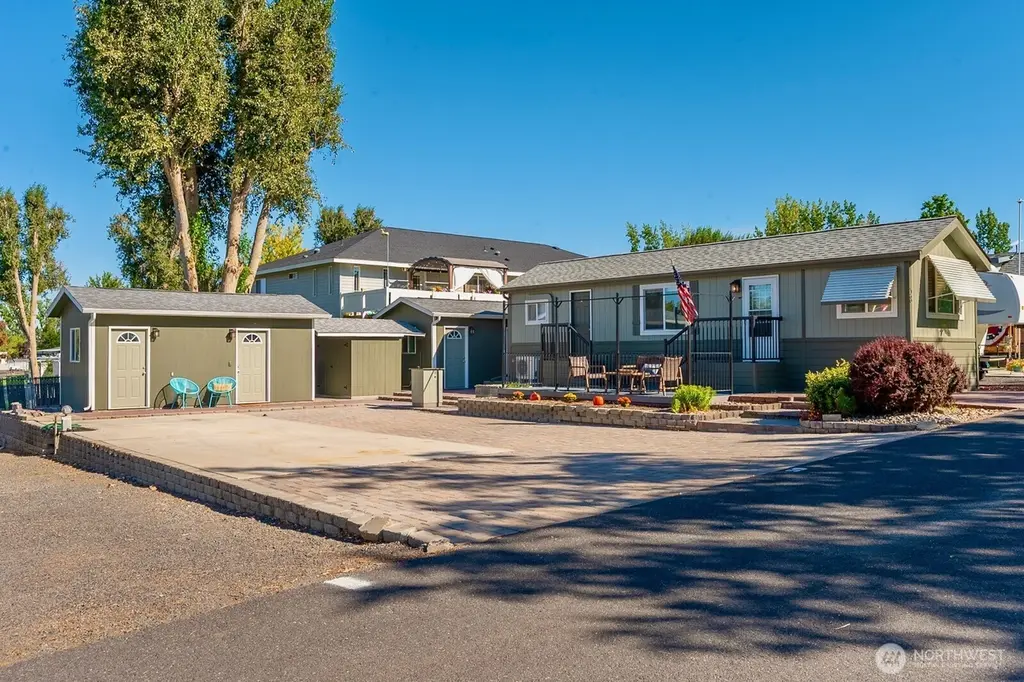
7037 E Highway 262 Unit 58/59 · Marine View, WA
Flood risk 1/10 · Minimal
- FEMA flood zone
- X (unshaded)
- Chance of flooding over 30 yrs
- 0.0%
- Est. flood insurance / yr
- $507 – $1,088
Fire risk 7/10 · Major
- Est. fire insurance / yr
- $604 – $1,122
Heat risk 4/10 · Minor
- Hot days now (above 97°F)
- 6 days/yr
- Hot days in 30 yrs
- 13 days/yr
Wind risk 1/10 · Minimal
- Chance of severe wind over 30 yrs
- —
Air-quality risk 8/10 · Major
- Unhealthy air days now
- 16 days/yr
- Unhealthy air days in 30 yrs
- 17 days/yr
Risk factors via First Street. Map © Google.
Why this score? — see what drove the D- grade
The composite is a weighted blend of 9 inputs, each scored 0–100. Each bar is that input's sub-score; the figure is the points it added to the 100-point composite (weight × sub-score).
- ARV discount +15.0/15.0
- Cash flow +7.7/30.0
- Schools +3.4/10.0
- 1% rule +2.9/10.0
- Rent growth +2.5/5.0
- Livability +2.5/5.0
- Condition / age +2.5/5.0
- DSCR +1.8/10.0
- Appreciation +0.0/10.0
$199,000
🖨 Deal sheet 📄 Offer letter ✓ Due diligence
Listing remarks
Turnkey Opportunity ~ Located on two lots at Legacy Golf Course at Mardon, this versatile property offers recreation and comfort in one package. The 595 sq ft home features, one bedroom, living, kitchen, dining and a 3/4 bath. A spacious deck and huge paved driveway offer room for guests RV, your boat or jet skis. A separate bunkhouse with bathroom/shower adds extra guest space. Outbuildings include a laundry room, shop/office, and storage building. RV space with full hookups makes it easy for visitors or extended stays. Many upgrades including Mitsubishi HVAC installed within last 2 years. Enjoy fishing, golfing, and hunting just steps away-ideal for a weekend retreat or year-round living.
Key facts
- Separate bunkhouse
- Two lots
- Laundry room
Tags
Neighborhood map
What this means for you Summary
Snapshot
- This is a 2-bed/2.0-bath manufactured listed at $199k.
Deal economics
- At list price, monthly cash flow is $-231 ($-3k/yr) — negative.
- To cash-flow at today's rent, offer at most $166k (16.8% below list).
- To meet the 1% rule (rent ≥ 1% of price), the offer needs to be $156k (21.4% below list).
- Recommended offer: $156k (21.4% below list) — sets the bar for 1% rule.
Location & tenants
- Location reads: area grade D — affects rentability + tenant quality, not the cash-flow math above.
- Royal School District (rural): math 34% / reading 40% proficiency, ranked #241 of 291 in WA (top 83%) — families likely to look elsewhere, expect single-tenant / working-renter base with shorter leases; 82% free/reduced lunch — lower-income household profile, screen leases tightly.
- Market conditions: 87 active listings in the ZIP; 559 units permitted in Grant County in 2024 (35 in 5+ unit buildings).
Forward outlook
- Local home prices are declining (-3.0%/yr); year-one equity from $1k of loan paydown is wiped out by about $6k of value loss. Plan a longer hold.
- Grant County population projected at +16% by 2050 — long-run rental-demand tailwind backs the buy-and-hold thesis.
Negotiation context
- It's been on market 300 days — a 12% lower offer ($175k) is reasonable based on typical stale-listing flexibility.
Risks & watch-outs
- Climate carrying-cost: major wildfire risk — expect insurance premiums to compound above CPI over the hold.
Questions for the listing agent
- What do current leases actually rent for vs. the listed asking? Can we see a recent rent roll and the last 12 months of T-12 income?
- It's been on market 300 days. Have you received any prior offers? Is the seller open to a 21% concession, seller financing, or rate buy-down credit?
- What does the HOA fee cover, when was the last increase, and are there any pending special assessments or reserve-fund shortfalls?
- Why hasn't it sold? Are there any deal-killer items the seller is aware of (foundation, flood, title, zoning, code violations)?
- Is there a deadline driving the sale (1031 exchange, divorce, estate, relocation)? That informs how much negotiation room exists.
- The area grade is low — what's the realistic commute time and amenity access for the typical tenant pool here? Any planned neighborhood developments (good or bad) we should know about?
- What's the average days-on-market for RENTAL listings here right now (not sales)? A rising rental-DOM trend means longer vacancies and softer asking-rent achievability than the comps imply.
- What's the recent tenant-quality profile in this submarket — average credit score on applications, eviction rate, late-payment / NSF rate, and stable-employment percentage? A property-management company in the area should have these aggregated.
- How much new for-sale + rental construction is in the pipeline within 1–3 miles? Heavy new supply typically softens prices + rents 12–24 months out; constrained supply supports both.
Investment metrics
- 1% rule
- 0.79% ✗
- Cap rate
- 4.90%
- Cash-on-cash
- -4.97%
- DSCR
- 0.78
- GRM
- 10.6
CMA / ARV
- ARV (median comp)
- $248,006
- List price
- $199,000
- Delta
- -19.76%
- Verdict
- UNDERPRICED
- Comps
- 3 within 1.0 mi
Projected returns pro-forma
-3.0% appreciation · 3.0% rent growth · sell at horizon
- IRR
- -24.7%
- Equity multiple
- 0.16×
- Total profit
- $-46,877
- Equity at exit
- $29,672
- IRR
- -20.2%
- Equity multiple
- -0.07×
- Total profit
- $-59,437
- Equity at exit
- $17,206
Cash invested: $55,720 (down + closing). Projections, not guarantees.
Landlord ↔ Tenant lean methodology
- Overall (STATE)
- 28 Tenant-Leaning
- State Washington
- 28 Tenant-Leaning · D+8
- County
- — inherits STATE
- City
- — inherits STATE
ZIP-level market 99344
- Active inventory
- 87
- Price-to-rent
- 10.6×
Monthly cashflow live
- Estimated rent
- $1,565 medium interval (Pro) →
- Mortgage (P&I)
- −$1,044
- Tax est. 1.5%
- −$249 /mo · $2,985/yr
- Insurance
- −$83
- HOA
- −$92
- Vacancy / Maint / Mgmt
- −$329
- Net cashflow
- $-231
Break-even live
UW: 25.0% down · 7.5% · 30yr · 1.5% tax · 5.0% vac · 8.0% maint · 8.0% mgmt
Financing live
Cash to close
- Down payment
- $49,750
- Closing costs
- $5,970
- Reserves months
- —
- Total cash needed
- —
Loan-product check · same deal, 3 products live
Conventional
25% down · 7.5% · 30yr
- Down + closing
- —
- Monthly P&I
- —
- Monthly cashflow
- —
- DSCR
- —
- Eligible?
- —
Personal DTI + credit; lowest rate.
DSCR
20% down · 8.5% · 30yr
- Down + closing
- —
- Monthly P&I
- —
- Monthly cashflow
- —
- DSCR
- —
- Eligible?
- —
No personal income docs; deal must DSCR.
Hard money
10% down · 12.0% · 12mo
- Down + closing
- —
- Monthly P&I
- —
- Monthly cashflow
- —
- DSCR
- —
- Eligible?
- —
Short-term bridge; refi at stabilization.
HOA detail
- Monthly dues
- $92 · $1,104/yr
Listing history 23 events
-
2026-06-19days on market $199,000 Active 300 DOM
-
2026-06-18days on market $199,000 Active 299 DOM
-
2026-06-17days on market $199,000 Active 298 DOM
-
2026-06-16days on market $199,000 Active 297 DOM
-
2026-06-15days on market $199,000 Active 296 DOM
-
2026-06-14days on market $199,000 Active 294 DOM
-
2026-06-13days on market $199,000 Active 293 DOM
-
2026-06-10days on market $199,000 Active 291 DOM
-
2026-06-09days on market $199,000 Active 290 DOM
-
2026-06-08days on market $199,000 Active 289 DOM
-
2026-06-07days on market $199,000 Active 288 DOM
-
2026-06-03days on market $199,000 Active 284 DOM
-
2026-06-02days on market $199,000 Active 283 DOM
-
2026-06-01days on market $199,000 Active 282 DOM
-
2026-05-31days on market $199,000 Active 281 DOM
-
2026-05-30days on market $199,000 Active 280 DOM
-
2026-04-28price $199,000
-
2026-04-10price $209,000
-
2026-01-21price $219,000
-
2025-12-07price $229,000
-
2025-09-27price $249,000
-
2025-09-17price $269,000
-
2025-08-23$275,000 Active
ⓘ Source: listings_history table (triggers on properties + properties_extension) + one-shot
backfill from property_details.listing_events for pre-trigger history.
Climate risk First Street
- Flood 1/10 Low FEMA zone X (unshaded) · 0% chance over 30 yrs
- Wildfire 7/10 Severe
- Heat 4/10 Moderate 6 d/yr ≥97°F today · 13 d/yr by 30 yrs out
- Wind 1/10 Low
- Air quality 8/10 Severe 16 unhealthy d/yr today · 17 by 30 yrs out
Nearby sold comps map
Loading sold comps map…
Walkable amenities ~0.75 mi
Loading nearby amenities…
Taxation est. · year 1
- Rental income
- $18,779
- − Mortgage interest
- −$11,147
- − Property taxes
- −$2,985
- − Insurance
- −$995
- − Repairs & maintenance
- −$1,502
- − Management
- −$1,502
- − HOA
- −$1,104
- − Depreciation
- −$5,789
- Taxable loss
- −$6,246
- Est. tax savings @ 24.0%
- +$1,499
- After-tax cash flow
- $-1,273/yr
For passive investors: Depreciation is non-cash, so a rental often shows a tax loss while cash-flowing — sheltering income. Rental losses are passive: they offset passive income freely, and up to $25,000/yr can offset ordinary (W-2) income if you actively participate and your MAGI is under $100k (phasing out to $0 by $150k); unused losses carry forward. On sale, claimed depreciation is recaptured at up to 25%, and gains may owe capital-gains tax (a 1031 exchange can defer both). Figures are a year-1 estimate at your 24.0% rate — not tax advice; consult a CPA.
Schools (NCES district)
- District
- Royal School District
- NCES district ID
- 5307620
- Math proficiency
- 34% ▬ 0.00%
- Reading proficiency
- 40% ▼ -1.00%
- Median HH income
- $42,923
- Composite
- 33.87/100
- National rank
- #10366
- State rank
- #241 of 291 in WA
Livability — Marine View
No livability data for this city. (Only ~50 U.S. cities are tracked.)
Census & demographics
- Census place
- Marine View, WA
- Population (ZIP)
- 19,458
Population outlook (Grant County) Hauer SSP2
- Today (2025)
- 99,356 people
- By 2030
- 102,107 · +2.8%
- By 2040
- 108,318 · +9.0%
- By 2050
- 114,712 · +15.5%
- By 2075
- 131,376 · +32.2%
- By 2100
- 146,163 · +47.1%
Race, ethnicity, and origin ACS 2023
- Neighborhood character
- Predominantly Hispanic (73%)
- Race & ethnicity
- Hispanic / Latino 73% White 25% Two or more races 21% Native American 3%
- Hispanic origin (detail)
- Mexican 68%
- Common ancestry
- Portuguese 2% Lithuanian 1% Italian 1%
- Foreign-born
- 27% · Canada
- Languages at home
- 40% English-only · Spanish 59%
Political lean MEDSL · Grant
- 2024 margin
- Solid R (+37.5) · D 30.0% · R 67.4% · Other 2.6%
- 2008→2024 swing
- -9.9pp toward R · 2008: -27.5pp · 2024: -37.5pp
- All cycles
- 2024: R+37.5 2020: R+34.4 2016: R+37.9 2012: R+32.6 2008: R+27.5
Not yet ingested
- Civics
- —
Market trends
- HPI YoY
- ▼ -401.63%
- Current HPI
- 212.6444
- Rent YoY
- —
- Metro
- —
- State GDP YoY
- ▲ 4.65%
- F500 in state
- 22
Industry mix (Fortune 500 HQ in WA)
| Industry | F500 HQs | Revenue |
|---|---|---|
| Retail | 2 | $269B |
|
||
| Technology / Retail | 1 | $638B |
|
||
| Technology | 1 | $245B |
|
||
| Telecommunications | 1 | $38B |
|
||
| Food / Beverage | 1 | $36B |
|
||
| Automotive / Trucks | 1 | $34B |
|
||
Price history
-27.6% since first listed7 events — show timeline
- 2026-04-28 Price Changed $199,000 NWMLS as Distributed by MLS Grid
- 2026-04-10 Price Changed $209,000 NWMLS as Distributed by MLS Grid
- 2026-01-21 Price Changed $219,000 NWMLS as Distributed by MLS Grid
- 2025-12-07 Price Changed $229,000 NWMLS as Distributed by MLS Grid
- 2025-09-27 Price Changed $249,000 NWMLS as Distributed by MLS Grid
- 2025-09-17 Price Changed $269,000 NWMLS as Distributed by MLS Grid
- 2025-08-23 Listed $275,000 NWMLS as Distributed by MLS Grid
Cash-flow waterfall
monthlySold comps — $/sqft
last 12 mo · ≤1 miLoading sold comps…