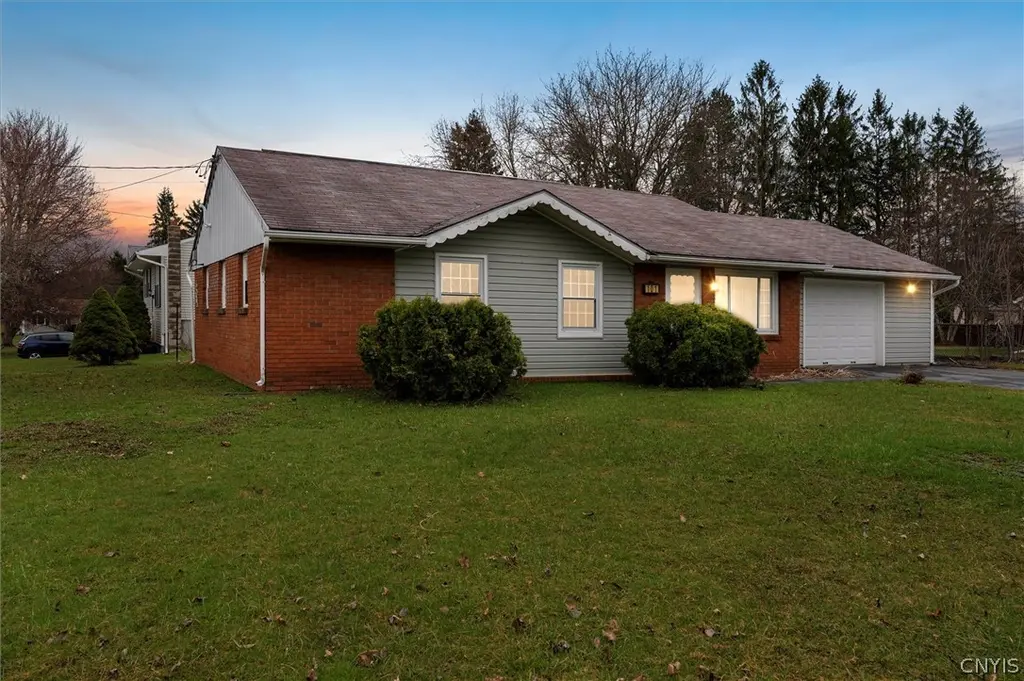
101 Timwood Dr · Village Green, NY
Flood risk 1/10 · Minimal
- FEMA flood zone
- X (unshaded)
- Chance of flooding over 30 yrs
- 0.0%
- Est. flood insurance / yr
- $507 – $1,088
Fire risk 1/10 · Minimal
- Est. fire insurance / yr
- $691 – $1,283
Heat risk 3/10 · Minor
- Hot days now (above 96°F)
- 7 days/yr
- Hot days in 30 yrs
- 16 days/yr
Wind risk 1/10 · Minimal
- Chance of severe wind over 30 yrs
- 0.0%
Air-quality risk 2/10 · Minimal
- Unhealthy air days now
- 0 days/yr
- Unhealthy air days in 30 yrs
- 1 days/yr
Risk factors via First Street. Map © Google.
Why this score? — see what drove the B- grade
The composite is a weighted blend of 9 inputs, each scored 0–100. Each bar is that input's sub-score; the figure is the points it added to the 100-point composite (weight × sub-score).
- Cash flow +24.8/30.0
- ARV discount +15.0/15.0
- DSCR +8.0/10.0
- 1% rule +7.9/10.0
- Schools +4.4/10.0
- Livability +3.2/5.0
- Rent growth +2.5/5.0
- Condition / age +2.5/5.0
- Appreciation +0.0/10.0
$179,900
🖨 Deal sheet 📄 Offer letter ✓ Due diligence
Listing remarks
* * * The seller has asked for best and final by 2PM 04/07/26 * * * Welcome to this charming 1572 sqft 4-bedroom, 1-bathroom ranch in the Baldwinsville School District! Situated on a good size corner lot. Step inside to discover easy, one-level living with a thoughtfully designed layout. The welcoming living room is cozy creating a warm and inviting atmosphere. The eat-in kitchen features pleanty room for added space or cabinets. All FOUR BEDROOMS are decent size. No need to worry about storage as this home also has an attached oversize 1 car garage. Single-level living for ease of accessibility and also includes washer dryer. You will also feel at ease knowing the furnace is approx 1
Key facts
- 0.27 acre lot
- Garage
- Built 1963
Neighborhood map
What this means for you Summary
Snapshot
- This is a 4-bed/1.0-bath single-family listed at $180k.
Deal economics
- At list price, monthly cash flow is $382 ($5k/yr) — positive.
- The deal already cash-flows at list — no discount required.
- Meets the 1% rule at list price ($2k rent vs $180k).
- Recommended offer: $177k (1.5% below list) — sets the bar for market timing.
- Cap rate 8.8% vs local median 5.3% in Village Green — top-decile yield for the area; either an underpriced asset or a hidden risk that comps aren't pricing in. Stress-test before assuming the spread holds.
Location & tenants
- Location reads 64/100 on livability (#720 in NY) — a middle-class / working-renter tenant base. Strengths: housing A+, cost of living A, crime B; Watch: employment C-, amenities F, commute F.
- Baldwinsville Central School District (suburban): math 47% / reading 53% proficiency, ranked #355 of 590 in NY (top 60%) — acceptable for families but not a draw, mixed tenant base, ~2y average lease; only 18% free/reduced lunch — higher-income household profile.
- Market conditions: 222 active listings in the ZIP; solid renter incomes; 616 units permitted in Onondaga County in 2024 (256 in 5+ unit buildings).
- This rent runs 30% of the median local income ($92k/yr) — at the standard rent-burdened threshold; future hikes will face affordability resistance.
Forward outlook
- Local home prices are declining (-3.0%/yr); year-one equity from $1k of loan paydown is wiped out by about $5k of value loss. Plan a longer hold.
- Onondaga County population projected to shrink 9% by 2050 — rents likely to lag national; underwrite the cash flow, not the appreciation.
Negotiation context
- It's been on market 18 days — a 2% lower offer ($177k) is reasonable based on typical stale-listing flexibility.
Risks & watch-outs
- Watch-outs: property tax is 2.9% of price.
Questions for the listing agent
- Built in 1963 — when were the roof, HVAC, electrical panel, plumbing, and water heater last replaced?
- Property tax is high relative to price — has the assessment been appealed recently, and will the sale trigger a re-assessment?
- Is there a deadline driving the sale (1031 exchange, divorce, estate, relocation)? That informs how much negotiation room exists.
- What's the average days-on-market for RENTAL listings here right now (not sales)? A rising rental-DOM trend means longer vacancies and softer asking-rent achievability than the comps imply.
- What's the recent tenant-quality profile in this submarket — average credit score on applications, eviction rate, late-payment / NSF rate, and stable-employment percentage? A property-management company in the area should have these aggregated.
- How much new for-sale + rental construction is in the pipeline within 1–3 miles? Heavy new supply typically softens prices + rents 12–24 months out; constrained supply supports both.
Investment metrics
- 1% rule
- 1.29% ✓
- Cap rate
- 8.84%
- Cash-on-cash
- 9.10%
- DSCR
- 1.40
- GRM
- 6.5
CMA / ARV
- ARV (on-the-fly)
- $260,952
- Comps found
- 12
Show comp detail 12 sales within ~0.75 mi
| Address | Dist | Beds/Ba | Sqft | Sold | Price | $/sf | Match |
|---|---|---|---|---|---|---|---|
| 101 Timwood Dr | 0.00mi | 4/1.0 | 1,572 (0%) | 0mo | $207,000 | $132 | 100 |
| 117 Daywood Dr | 0.07mi | 3/1.5 (-1) | 1,500 (-5%) | 1mo | $280,000 | $187 | 82 |
| 119 Cedarwood Blvd | 0.24mi | 4/1.5 | 1,579 (+0%) | 14mo | $265,000 | $168 | 74 |
| 102 Cedarwood Blvd | 0.23mi | 3/1.5 (-1) | 1,560 (-1%) | 8mo | $227,000 | $146 | 74 |
| 106 Cheerwood Dr | 0.11mi | 3/1.5 (-1) | 1,472 (-6%) | 4mo | $282,500 | $192 | 74 |
| 117 Finwood Dr | 0.12mi | 4/1.5 | 1,406 (-11%) | 4mo | $260,500 | $185 | 72 |
| 438 Birchwood Blvd | 0.21mi | 3/2.0 (-1) | 1,520 (-3%) | 16mo | $270,000 | $178 | 62 |
| 123 Farwood Dr | 0.14mi | 3/2.0 (-1) | 1,725 (+10%) | 11mo | $270,000 | $157 | 59 |
| 740 Village Blvd S | 0.28mi | 3/1.5 (-1) | 1,356 (-14%) | 1mo | $225,000 | $166 | 56 |
| 437 Birchwood Blvd | 0.25mi | 3/1.5 (-1) | 1,756 (+12%) | 12mo | $290,000 | $165 | 52 |
| 825 Fairway Cir | 0.45mi | 3/2.5 (-1) | 1,659 (+6%) | 17mo | $237,500 | $143 | 45 |
| 7652 Maple Rd | 0.72mi | 3/1.0 (-1) | 1,634 (+4%) | 12mo | $239,000 | $146 | 45 |
Match score weights: distance 35% · size 25% · config 20% · recency 20%. Top-matched comps best support the ARV.
Projected returns pro-forma
-3.0% appreciation · 3.0% rent growth · sell at horizon
- IRR
- -2.5%
- Equity multiple
- 0.91×
- Total profit
- $-4,674
- Equity at exit
- $26,824
- IRR
- 7.3%
- Equity multiple
- 1.55×
- Total profit
- $27,891
- Equity at exit
- $15,554
Cash invested: $50,372 (down + closing). Projections, not guarantees.
Landlord ↔ Tenant lean methodology
- Overall (STATE)
- 15 Strongly Tenant-Friendly
- State New York
- 15 Strongly Tenant-Friendly · D+10
- County
- — inherits STATE
- City
- — inherits STATE
ZIP-level market 13027
- Active inventory
- 222
- Price-to-rent
- 6.5×
Monthly cashflow live
- Estimated rent
- $2,313 medium interval (Pro) →
- Mortgage (P&I)
- −$943
- Tax from tax record
- −$427 /mo · $5,127/yr
- Insurance
- −$75
- HOA
- −$0
- Vacancy / Maint / Mgmt
- −$486
- Net cashflow
- $382
Break-even live
UW: 25.0% down · 7.5% · 30yr · 1.5% tax · 5.0% vac · 8.0% maint · 8.0% mgmt
Financing live
Cash to close
- Down payment
- $44,975
- Closing costs
- $5,397
- Reserves months
- —
- Total cash needed
- —
Loan-product check · same deal, 3 products live
Conventional
25% down · 7.5% · 30yr
- Down + closing
- —
- Monthly P&I
- —
- Monthly cashflow
- —
- DSCR
- —
- Eligible?
- —
Personal DTI + credit; lowest rate.
DSCR
20% down · 8.5% · 30yr
- Down + closing
- —
- Monthly P&I
- —
- Monthly cashflow
- —
- DSCR
- —
- Eligible?
- —
No personal income docs; deal must DSCR.
Hard money
10% down · 12.0% · 12mo
- Down + closing
- —
- Monthly P&I
- —
- Monthly cashflow
- —
- DSCR
- —
- Eligible?
- —
Short-term bridge; refi at stabilization.
Listing history 3 events
-
2026-04-20status Pending
-
2026-04-11historical Active Under Contract
-
2026-04-02$179,900 Active
ⓘ Source: listings_history table (triggers on properties + properties_extension) + one-shot
backfill from property_details.listing_events for pre-trigger history.
Tax reassessment forecast NY · Partial reset (capped growth)
- Current annual tax
- $5,127 · $427/mo
- Projected year-2 tax
- $5,127 · $427/mo
- Expected delta
- $0/yr ($0/mo · 0.0%)
ⓘ Screening estimate from a state-policy table — verify with the county assessor before closing.
Climate risk First Street
- Flood 1/10 Low FEMA zone X (unshaded) · 0% chance over 30 yrs
- Wildfire 1/10 Low
- Heat 3/10 Moderate 7 d/yr ≥96°F today · 16 d/yr by 30 yrs out
- Wind 1/10 Low 0% chance of damaging wind over 30 yrs
- Air quality 2/10 Low 0 unhealthy d/yr today · 1 by 30 yrs out
Nearby sold comps map
Loading sold comps map…
Walkable amenities ~0.75 mi
Loading nearby amenities…
Taxation est. · year 1
- Rental income
- $27,759
- − Mortgage interest
- −$10,077
- − Property taxes
- −$5,127
- − Insurance
- −$900
- − Repairs & maintenance
- −$2,221
- − Management
- −$2,221
- − Depreciation
- −$5,233
- Taxable income
- $1,980
- Est. tax owed @ 24.0%
- −$475
- After-tax cash flow
- $4,107/yr
For passive investors: Depreciation is non-cash, so a rental often shows a tax loss while cash-flowing — sheltering income. Rental losses are passive: they offset passive income freely, and up to $25,000/yr can offset ordinary (W-2) income if you actively participate and your MAGI is under $100k (phasing out to $0 by $150k); unused losses carry forward. On sale, claimed depreciation is recaptured at up to 25%, and gains may owe capital-gains tax (a 1031 exchange can defer both). Figures are a year-1 estimate at your 24.0% rate — not tax advice; consult a CPA.
Schools (NCES district)
- District
- Baldwinsville Central School District
- NCES district ID
- 3603870
- Math proficiency
- 47% ▼ -11.00%
- Reading proficiency
- 53% ▲ 2.00%
- Median HH income
- $65,182
- Composite
- 44.22/100
- National rank
- #2848
- State rank
- #355 of 590 in NY
Livability — Village Green
- Score
- 64/100
- State rank
- #720
- US rank
- #13628
Category grades
Schools grade is shown separately in the Schools card above.
Census & demographics
- Census place
- Village Green, NY
- County
- Onondaga County · 247,257 people
- Metro
- Syracuse, NY
- Population (ZIP)
- 35,088
- Household income
- $91,797
- Rent vs Own
- Severe rent burden
- 1057.0
Population outlook (Onondaga County) Hauer SSP2
- Today (2025)
- 467,894 people
- By 2030
- 463,381 · -1.0%
- By 2040
- 447,697 · -4.3%
- By 2050
- 426,399 · -8.9%
- By 2075
- 373,661 · -20.1%
- By 2100
- 307,967 · -34.2%
Race, ethnicity, and origin ACS 2023
- Neighborhood character
- Predominantly White (89%)
- Race & ethnicity
- White 89% Two or more races 6% Hispanic / Latino 4% Black 2% Asian 1%
- Common ancestry
- Romanian 6% Lithuanian 5% Subsaharan African 2%
- Foreign-born
- 3% · Canada
- Languages at home
- 96% English-only · Other Indo-European 1% Russian/Polish/Slavic 1% Spanish 1%
Political lean MEDSL · Onondaga
- 2024 margin
- D (+17.3) · D 58.6% · R 41.4%
- 2008→2024 swing
- -3.0pp toward R · 2008: 20.3pp · 2024: 17.3pp
- All cycles
- 2024: D+17.3 2020: D+20.6 2016: D+12.8 2012: D+21.1 2008: D+20.3
Not yet ingested
- Civics
- —
Market trends
- HPI YoY
- ▼ -204.01%
- Current HPI
- 321.8247
- Rent YoY
- —
- Metro
- Syracuse, NY
- State GDP YoY
- ▲ 2.60%
- F500 in state
- 92
Industry mix (Fortune 500 HQ in NY)
| Industry | F500 HQs | Revenue |
|---|---|---|
| Financial Services | 10 | $950B |
|
||
| Consumer Goods | 9 | $162B |
|
||
| Insurance | 4 | $225B |
|
||
| Telecommunications | 2 | $144B |
|
||
| Pharmaceuticals | 2 | $112B |
|
||
| Media / Entertainment | 2 | $69B |
|
||
Price history
3 events — show timeline
- 2026-04-20 Pending — CNYIS
- 2026-04-11 Contingent — CNYIS
- 2026-04-02 Listed $179,900 CNYIS
Property tax history
+4.0%/yrLatest (2025): $5,127 · +1.5% YoY. Source: county tax records.
Cash-flow waterfall
monthlySold comps — $/sqft
last 12 mo · ≤1 miLoading sold comps…