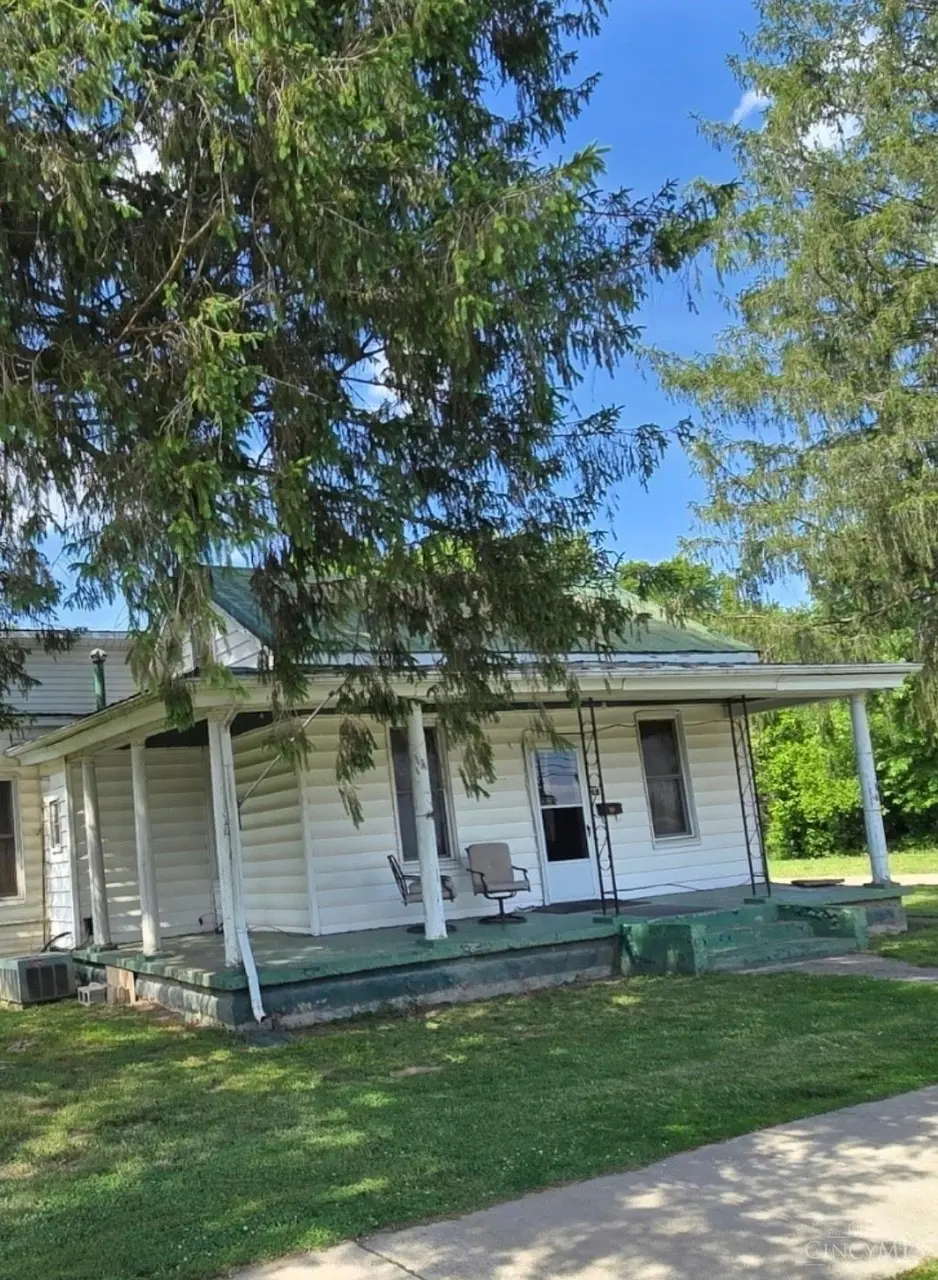
707 E Second St · Manchester, OH
Flood risk 9/10 · Severe
- FEMA flood zone
- X (shaded)
- Chance of flooding over 30 yrs
- 0.79%
- Est. flood insurance / yr
- $507 – $1,088
Fire risk 4/10 · Minor
- Est. fire insurance / yr
- $713 – $1,323
Heat risk 5/10 · Moderate
- Hot days now (above 102°F)
- 7 days/yr
- Hot days in 30 yrs
- 20 days/yr
Wind risk 2/10 · Minimal
- Chance of severe wind over 30 yrs
- 2.0%
Air-quality risk 2/10 · Minimal
- Unhealthy air days now
- 1 days/yr
- Unhealthy air days in 30 yrs
- 1 days/yr
Risk factors via First Street. Map © Google.
Why this score? — see what drove the D+ grade
The composite is a weighted blend of 9 inputs, each scored 0–100. Each bar is that input's sub-score; the figure is the points it added to the 100-point composite (weight × sub-score).
- Cash flow +14.3/30.0
- ARV discount +7.7/15.0
- Appreciation +5.5/10.0
- DSCR +4.3/10.0
- Schools +3.8/10.0
- Livability +3.1/5.0
- 1% rule +2.9/10.0
- Rent growth +2.5/5.0
- Condition / age +2.5/5.0
$115,000
🖨 Deal sheet (PDF) 📄 Offer letter ✓ Due diligence
Listing remarks
Country living with this 3-bedroom home situated on 0.347 acres offering spacious yards and plenty of room to enjoy the outdoors. The home features a versatile loft and dedicated office space, perfect for working from home or additional living needs. The property also includes a concrete workshop building with its own office space, a one-car garage, and an additional storage shed ideal for hobbies, projects, or extra storage. Conveniently located just minutes from a local park and boating dock. Situated near Ohio River and Manchester Islands. Easy access to Shawnee State Park and scenic trails for outdoor recreation. Don't miss this opportunity to own a peaceful country retreat with so mu
Key facts
- 0.35 acre lot
- Garage
- Built 1901
Property features AI
Finance
- Other: Residential zoning; Approximately 0.35 acre lot (.5 to .9 acres listed); Directions: st rt 32 then right on st rt 136 in winchester
- HOA & community: No HOA
Exterior
- Parking: Detached garage; Detached carport; Driveway; 1 garage space
- Utilities: Public water; Public sewer; Natural gas
- Home design: Traditional style; Single family; Two levels
- Construction: Vinyl siding; Metal roof; Block foundation; Built with traditional construction materials
- Exterior features: Level topography; Shed; Workshop; Aluminum windows
Interior
- Kitchen: Kitchen: 15 x 15; Dining room: 15 x 15; Living room / great room: 15 x 15; Appliances included: Refrigerator
- Bedrooms: 3 bedrooms total; Primary bedroom: 15 x 10 (level 1); Bedroom 2: 15 x 10 (level 1); Bedroom 3: 20 x 10 (level 1)
- Bathrooms: 1 full bathroom (level 1)
- Heating & cooling: Central air; Electric heating; Gas heating; Electric water heater
- Interior features: 7 total rooms; Crawl basement
- Laundry & utility: Washer; Dryer
Neighborhood map
What this means for you Summary
Snapshot
- This is a 4-bed/1.0-bath single-family listed at $115k.
Deal economics
- At list price, monthly cash flow is $-46 ($-552/yr) — negative.
- To cash-flow at today's rent, offer at most $107k (7.1% below list).
- To meet the 1% rule (rent ≥ 1% of price), the offer needs to be $91k (20.7% below list).
- Recommended offer: $91k (20.7% below list) — sets the bar for 1% rule.
Location & tenants
- Location reads 61/100 on livability (#957 in OH) — a middle-class / working-renter tenant base. Strengths: crime A+, cost of living A+, housing B+; Watch: schools C-, health & safety C-, amenities F.
- Manchester Local (rural): math 38% / reading 55% proficiency, ranked #497 of 656 in OH (top 76%) — families likely to look elsewhere, expect single-tenant / working-renter base with shorter leases; 67% free/reduced lunch — lower-income household profile, screen leases tightly.
- Market conditions: 37 active listings in the ZIP; lower-income renter base — watch delinquency; 42 units permitted in Adams County in 2024 (0 in 5+ unit buildings).
Forward outlook
- In year one you build about $2k of equity ($795 loan paydown + $1k appreciation (1.0% local appreciation)).
- Adams County population projected at -23% by 2050 — secular population decline; favor cash flow + early exit over multi-decade hold.
Negotiation context
- It's been on market 55 days — a 3% lower offer ($112k) is reasonable based on typical stale-listing flexibility.
Risks & watch-outs
- Watch-outs: flood insurance adds $66/mo; built in 1901 — expect roof / HVAC / electrical / plumbing capex.
- Climate carrying-cost: severe flood risk; extreme-heat days projected 7→20/yr by 2055 (HVAC capex compounding) — expect insurance premiums to compound above CPI over the hold.
Questions for the listing agent
- What do current leases actually rent for vs. the listed asking? Can we see a recent rent roll and the last 12 months of T-12 income?
- It's been on market 55 days. Have you received any prior offers? Is the seller open to a 21% concession, seller financing, or rate buy-down credit?
- Built in 1901 — when were the roof, HVAC, electrical panel, plumbing, and water heater last replaced?
- What's the actual annual flood-insurance premium (NFIP or private), and is the property in a SFHA with mandatory coverage?
- Is there a deadline driving the sale (1031 exchange, divorce, estate, relocation)? That informs how much negotiation room exists.
- The area grade is low — what's the realistic commute time and amenity access for the typical tenant pool here? Any planned neighborhood developments (good or bad) we should know about?
- What's the average days-on-market for RENTAL listings here right now (not sales)? A rising rental-DOM trend means longer vacancies and softer asking-rent achievability than the comps imply.
- What's the recent tenant-quality profile in this submarket — average credit score on applications, eviction rate, late-payment / NSF rate, and stable-employment percentage? A property-management company in the area should have these aggregated.
- How much new for-sale + rental construction is in the pipeline within 1–3 miles? Heavy new supply typically softens prices + rents 12–24 months out; constrained supply supports both.
Investment metrics
- 1% rule
- 0.79% ✗
- Cap rate
- 6.51%
- Cash-on-cash
- 0.76%
- DSCR
- 1.03
- GRM
- 10.5
CMA / ARV
- ARV (on-the-fly)
- $115,452
- Comps found
- 2
Show comp detail 2 sales within ~0.75 mi
| Address | Dist | Beds/Ba | Sqft | Sold | Price | $/sf | Match |
|---|---|---|---|---|---|---|---|
| 732 Easy St | 0.25mi | 3/2.0 (-1) | 1,184 (+11%) | 3mo | $127,500 | $108 | 59 |
| 516 E Eighth St | 0.35mi | 3/1.0 (-1) | 1,160 (+8%) | 14mo | $121,500 | $105 | 53 |
Match score weights: distance 35% · size 25% · config 20% · recency 20%. Top-matched comps best support the ARV.
Projected returns pro-forma
0.96% appreciation · 3.0% rent growth · sell at horizon
- IRR
- -0.6%
- Equity multiple
- 0.97×
- Total profit
- $-986
- Equity at exit
- $39,043
- IRR
- 4.3%
- Equity multiple
- 1.52×
- Total profit
- $16,700
- Equity at exit
- $51,719
Cash invested: $32,200 (down + closing). Projections, not guarantees.
Landlord ↔ Tenant lean methodology
- Overall (STATE)
- 73 Landlord-Friendly
- State Ohio
- 73 Landlord-Friendly · R+6
- County
- — inherits STATE
- City
- — inherits STATE
ZIP-level market 45144
- Home prices YoY
- 0.5%
- Active inventory
- 37
- Price-to-rent
- 10.5×
Monthly cashflow live
- Estimated rent
- $912 medium interval (Pro) →
- Mortgage (P&I)
- −$603
- Tax from tax record
- −$49 /mo · $592/yr
- Insurance
- −$48
- Flood insurance flood zone
- −$66 /mo · $798/yr
- HOA
- −$0
- Vacancy / Maint / Mgmt
- −$192
- Net cashflow
- $-46
Break-even live
Sensitivity live
| Price | -10% $19 | -5% $-13 | +0% $-46 | +5% $-79 | +10% $-111 |
|---|---|---|---|---|---|
| Rent | -10% $-118 | -5% $-82 | +0% $-46 | +5% $-10 | +10% $26 |
| Rate | -1.0pp $12 | -0.5pp $-17 | base $-46 | +0.5pp $-76 | +1.0pp $-106 |
UW: 25.0% down · 7.5% · 30yr · 1.5% tax · 5.0% vac · 8.0% maint · 8.0% mgmt
Financing live
Cash to close
- Down payment
- $28,750
- Closing costs
- $3,450
- Reserves months
- —
- Total cash needed
- —
Loan-product check · same deal, 3 products live
Conventional
25% down · 7.5% · 30yr
- Down + closing
- —
- Monthly P&I
- —
- Monthly cashflow
- —
- DSCR
- —
- Eligible?
- —
Personal DTI + credit; lowest rate.
DSCR
20% down · 8.5% · 30yr
- Down + closing
- —
- Monthly P&I
- —
- Monthly cashflow
- —
- DSCR
- —
- Eligible?
- —
No personal income docs; deal must DSCR.
Hard money
10% down · 12.0% · 12mo
- Down + closing
- —
- Monthly P&I
- —
- Monthly cashflow
- —
- DSCR
- —
- Eligible?
- —
Short-term bridge; refi at stabilization.
Listing history 15 events
-
2026-06-18days on market $115,000 Active 55 DOM
-
2026-06-17days on market $115,000 Active 54 DOM
-
2026-06-16days on market $115,000 Active 53 DOM
-
2026-06-15days on market $115,000 Active 52 DOM
-
2026-06-14days on market $115,000 Active 50 DOM
-
2026-06-10days on market $115,000 Active 47 DOM
-
2026-06-09days on market $115,000 Active 46 DOM
-
2026-06-08days on market $115,000 Active 45 DOM
-
2026-06-07pricedays on market $115,000 Active 44 DOM
-
2026-06-03days on market $121,000 Active 40 DOM
-
2026-06-02days on market $121,000 Active 39 DOM
-
2026-06-01days on market $121,000 Active 38 DOM
-
2026-05-31days on market $121,000 Active 37 DOM
-
2026-05-31days on market $121,000 Active 36 DOM
-
2026-04-25$121,000 Active
ⓘ Source: listings_history table (triggers on properties + properties_extension) + one-shot
backfill from property_details.listing_events for pre-trigger history.
Tax reassessment forecast OH · Partial reset (capped growth)
- Current annual tax
- $592 · $49/mo
- Projected year-2 tax
- $1,193 · $99/mo
- Expected delta
- +$601/yr (+$50/mo · 101.5%)
ⓘ Screening estimate from a state-policy table — verify with the county assessor before closing.
Climate risk First Street
- Flood 9/10 Extreme FEMA zone X (shaded) · 79% chance over 30 yrs
- Wildfire 4/10 Moderate
- Heat 5/10 Major 7 d/yr ≥102°F today · 20 d/yr by 30 yrs out
- Wind 2/10 Low 2% chance of damaging wind over 30 yrs
- Air quality 2/10 Low 1 unhealthy d/yr today · 1 by 30 yrs out
Nearby sold comps map
Loading sold comps map…
Walkable amenities ~0.75 mi
Loading nearby amenities…
Taxation est. · year 1
- Rental income
- $10,948
- − Mortgage interest
- −$6,442
- − Property taxes
- −$592
- − Insurance
- −$1,372
- − Repairs & maintenance
- −$876
- − Management
- −$876
- − Depreciation
- −$3,345
- Taxable loss
- −$2,555
- Est. tax savings @ 24.0%
- +$613
- After-tax cash flow
- $61/yr
For passive investors: Depreciation is non-cash, so a rental often shows a tax loss while cash-flowing — sheltering income. Rental losses are passive: they offset passive income freely, and up to $25,000/yr can offset ordinary (W-2) income if you actively participate and your MAGI is under $100k (phasing out to $0 by $150k); unused losses carry forward. On sale, claimed depreciation is recaptured at up to 25%, and gains may owe capital-gains tax (a 1031 exchange can defer both). Figures are a year-1 estimate at your 24.0% rate — not tax advice; consult a CPA.
Schools (NCES district)
- District
- Manchester Local
- NCES district ID
- 3900537
- Math proficiency
- 38% ▼ -20.00%
- Reading proficiency
- 55% ▼ -10.00%
- Median HH income
- $33,374
- Composite
- 38.23/100
- National rank
- #4246
- State rank
- #497 of 656 in OH
Livability — Manchester
- Score
- 61/100
- State rank
- #957
- US rank
- #18445
Category grades
Schools grade is shown separately in the Schools card above.
Census & demographics
- Census place
- Manchester, OH
- County
- Adams · 32,832 people
- Population (ZIP)
- 4,256
- Household income
- $43,896
- Rent vs Own
- Severe rent burden
- 9.5
Population outlook (Adams County) Hauer SSP2
- Today (2025)
- 26,467 people
- By 2030
- 25,354 · -4.2%
- By 2040
- 22,951 · -13.3%
- By 2050
- 20,394 · -22.9%
- By 2075
- 14,824 · -44.0%
- By 2100
- 9,909 · -62.6%
Race, ethnicity, and origin ACS 2023
- Neighborhood character
- Predominantly White (95%)
- Race & ethnicity
- White 95% Hispanic / Latino 2% Two or more races 2%
- Common ancestry
- Lithuanian 2% Slovak 2% Serbian 1%
- Foreign-born
- 2%
Political lean MEDSL · Adams
- 2024 margin
- Solid R (+65.7) · D 16.9% · R 82.6%
- 2008→2024 swing
- -41.6pp toward R · 2008: -24.1pp · 2024: -65.7pp
- All cycles
- 2024: R+65.7 2020: R+63.5 2016: R+55.6 2012: R+26.3 2008: R+24.1
Not yet ingested
- Civics
- —
Market trends
- HPI YoY
- ▲ 0.96%
- Current HPI
- 189.9563
- Rent YoY
- —
- Metro
- —
- State GDP YoY
- ▲ 1.98%
- F500 in state
- 48
Industry mix (Fortune 500 HQ in OH)
| Industry | F500 HQs | Revenue |
|---|---|---|
| Insurance | 3 | $145B |
|
||
| Industrial Machinery | 3 | $49B |
|
||
| Financial Services | 3 | $24B |
|
||
| Consumer Goods | 2 | $93B |
|
||
| Aerospace / Defense | 2 | $47B |
|
||
| Utilities | 2 | $33B |
|
||
Price history
1 event — show timeline
- 2026-04-25 Listed $121,000 Cincy MLS
Property tax history
+143.4%/yrLatest (2025): $592 · +12.1% YoY. Source: county tax records.
Cash-flow waterfall
monthlySold comps — $/sqft
last 12 mo · ≤1 miLoading sold comps…